53
DAFTAR PUSTAKA
1.
National health service United Kingdom. Sepsis [Internet]. [cited 2013 des
3]. Available from:
http://www.nhs.uk/Conditions/blood-poisoning/Pages/introduction.aspx
2.
Ayudiatama SC. Uji diagnostik prokalsitonin dibanding kultur darah
sebagai baku emas untuk diagnostis sepsis di RSUP dr. Kariadi.
Semarang: Fakultas kedokteran Universitas Diponegoro; 2011.
3.
Dellinger RP, Levy MM, Rhodes A, Annane D, Gerlach H, Opal SM, et
al. Surviving Sepsis Campaign: International Guidelines for Management
of Severe Sepsis and Septic Shock. 2012.
4.
Martin GS. Sepsis, severe sepsis and septic shock: changes in incidence,
pathogens and outcomes. Expert review of anti-infective therapy
[Internet]. 2012 [cited 2013 dec 8]; 10(6):701-6. Available from: National
center for biotechnology information
5.
Vincent JL, Sakr Y, Sprung CL, et al. Sepsis in European intensive care
units: results of the SOAP study. Crit. Care Med. 2006;34(2):344-53.
6.
Danai P, Martin GS. Epidemiology of sepsis: recent advances. Curr.
7.
Global sepsis alliance. Sepsis facts [internet].[updated 2013; cited 2013
Dec 9]. Available from:
http://www.world-sepsis-day.org/?MET=SHOWCONTAINER&vPRIMNAVISELECT=3&vSEKN
AVISELECT=1&vCONTAINERID=
8.
Phua J, Koh YS, Du B, Tang YQ, Divatia JV, Gomersall CD, et al.
Management of severe sepsis in patients admitted to Asian intensive care
units: prospective cohort study. BMJ. 2011 [cited 2013 dec 9];342:d3245.
Available from: British Medical Journal
9.
Pradipta IS. Evaluation of antibiotic use in sepsis patients at ward of
internal medicine Dr. Sardjito Hospital, Yogyakarta September-November
2008. M.Sc Thesis, Faculty of Pharmacy, Universitas Gadjah Mada,
Indonesia. 2009
10. Machado RL, Bak R, Bicudo A, David CMN, Luiz RR, et al. Fifth
international symposium on intensive care and emergency medicine for
Latin America: Factors related to the mortality of patients with severe
sepsis and septic shock. Crit. Care Med [internet]. 2009 [cited 2013 Dec
10]; 13(3):P18. Available from : Springerlink
11. Prayogo BW. Hubungan antara faktor risiko sepsis dengan kejadian sepsis
berat dan septik syok di dept/ SMF obstetri dan ginekologi [Internet]. 2010
[updated 2012 Apr 17; cited 2013 Dec 10]. Available from:
http://rsudrsoetomo.jatimprov.go.id/id/index.php?option=com_content&vi
ew=article&id=554:hubungan-antara-faktor-risiko-sepsis-dengan-
kejadian-sepsis-berat-dan-syok-sepsis-di-deptsmf-obstetri-dan-ginekologi&catid=57:abstrak-penelitian&Itemid=76
12. Yang H, Duling IT, Brown JS, Simonson SG. Respiratory organ
dysfunction: a leading risk factor for hospital mortality in patients with
severe sepsis or septic shock. 28
thInternational Symposium on Intensive
Care and Emergency Medicine; 2008 Mar 18-21; Brussels (Belgium). Crit.
Care Med [internet]. 2008 [cited 2013 Dec 30]; 12(2):P485. Available
from: Springerlink
13. Runge MS, Greganti MA. Netter’s Internal Medicine. 2
nded. Philadelphia
USA: Saunders Elsevier; 2009. p. 644-9
14. Fauci AS, Kasper DL, Longo DL, Loscalzo J, et al. Harrison Manual
Kedokteran. Indonesia:Karisma Publising Group; 2009. p. 99-104
15. Caterino JM, Kahan S. Master Plan Kedaruratan Medik. Indonesia:
Binarupa Aksara Publisher; 2012
16. Melamed A, Sorvillo FJ. The burden of sepsis-associated mortality in the
United States from 1999 to 2005: an analysis of multiple-cause-of-death
data. Crit Care 2009
,
13:R28
17. National health service United Kingdom. Sepsis [Internet]. [cited 2014 feb
7]. Available from:
http://www.nhs.uk/Conditions/Blood-poisoning/Pages/Causes.aspx
18. LaRosa SP. Cleveland Clinic disease management project: Sepsis.
[internet]. [updated 2013; cited 2014 Feb 7]. Available from:
http://www.clevelandclinicmeded.com/medicalpubs/diseasemanagement/i
nfectious-disease/sepsis/
19. Burdette SD. Systemic inflammatory response syndrome [Internet].
[updated 2014; cited 2014 Feb 7]. Available from: Medscape
20. Esper AM, Moss M, Lewish CA, Nisbet R, Mannino DM, Martin GS. The
role of infection and comorbidity: Factors that influence disparities in
sepsis.
Crit Care Med
2006, 34
:
2576-82
21. James MT. Sepsis risk increased in chronic kidney disease without dialysis
and treatment.
Arch Intern Med
. 2008;168:2333-39. Available from:
http://www.medscape.org/viewarticle/584134
22. Hubacek JA, Strüber F, Fröhlich D, Book M, Wetegrove S, Ritter M,
Rothe G, Schmitz G. Gene variants of the bactericidal/permeability
increasing protein and lipopolysacchraride binding protein in sepsis
patients: gender-specific genetic predisposition to sepsis.
Crit Care Med
2001, 29
:
557-61
23. Klein NC, Go CH, Cunha BA. Infections associated with steroid use.
Infect Dis Clin North Am. 2001 Jun;15(2):423-32
24. Poll TVD. Immunotherapy of sepsis. The Lancet Infectious Diseases. 2001
Oct;1(3):165-74
25. National health service United Kingdom. Chemotherapy [Internet]. [cited
2014 feb 18]. Available from:
26. Centers for Disease Control and Prevention. Preventing infections in
cancer patients [internet]. [cited 2014 Feb 18]. Available from:
http://www.cdc.gov/cancer/preventinfections/
27. Penack O, Buchheidt D, Christopeit M, et al. Management of sepsis in
neutropenic patients: guidelines from the infectious diseases working party
of the German Society of Hematology and Oncology. Ann Oncol. 2010.
Available from : Oxford Journals
28. Henry W, Russell G, Suzanne J, et al. Obesity and risk of sepsis. Society
of Critical Care Medicine and Lippincott Williams & Wilkins. 2012.
Available from:
http://journals.lww.com/ccmjournal/Abstract/2012/12001/735___Obesity_
and_Risk_of_Sepsis.697.aspx
29. Kuperman EF, Showalter JW, Lehman EB, et al. The impact of obesity on
sepsis mortality: a retrospective review. BMC Infectious Diseases. 2013.
13:377. Available from: http://www.biomedcentral.com/1471-2334/13/377
30. Prayogo et al. : Hubungan antara Faktor Risiko Sepsis Obstetri dengan
Kejadian Sepsis Berat dan Syok Sepsis. Journal Unair [internet]. 2011
[cited 2014 Feb]; 19(3). Available from:
http://journal.unair.ac.id/filerPDF/1109%20Budhy%20%28P%29%20-%20Format%20MOG.pdf
31. Garna HH. Buku ajar divisi infeksi dan penyakit tropis Universitas
Padjajaran. Jakarta: Sagung Seto. 2012
32. Leksana E. SIRS, sepsis, keseimbangan asam-basa, shock, dan terapi
cairan. Semarang: SMF/Bagian Anestesi dan Terapi Intensif RSUP Dr.
Kariadi/Fak. Kedokteran Universitas Diponegoro. 2006
33. Girard TD, Opal SM, Ely EW. Oxford Journals: Insights into Severe
Sepsis in Older Patients: From Epidemiology to Evidence-Based
Management. Clin Infect Dis. (2005) 40 (5): 719-727. doi:
10.1086/427876
34. Angele MK, Frantz MC, Chaudry IH. Gender and sex hormones influence
the response to trauma and sepsis – potential therapeutic approaches.
Clinics vol.61 no.5 São Paulo Oct. 2006. Available from:
http://www.scielo.br/scielo.php?pid=s1807-59322006000500017&script=sci_arttext&tlng=en
35. Koh GCKW, Peacock SJ, Poll TVD, Wiersinga WJ. The impact of
diabetes on the pathogenesis of sepsis. Eur J Clin Microbiol Infect Dis.
Apr 2012; 31(4): 379–388. Available from:
http://www.ncbi.nlm.nih.gov/pmc/articles/PMC3303037/
36. Annane D. Corticosteroids for severe sepsis: an evidence-based guide for
physicians. Ann Intensive Care. 2011; 1: 7. Available from:
http://www.ncbi.nlm.nih.gov/pmc/articles/PMC3224490/
37. Nicholson JP, Wolmarans MR, Park GR. The role of albumin in critical
illness. Br. J. Anaesth.
(2000) 85 (4): 599-610. Available from:
38. A Train Education. Sepsis: Immune System Meltdown. [internet]. [cited
2014 July 11]. Available from:
https://www.atrainceu.com/course-module/1884979-107_sepsis-module-05
39. Marik PE. Surviving sepsis: going beyond the guidelines. Annals of
Intensive Care
2011, 1:17. Available from:
Lampiran 4. Data penelitian pasien sepsis No No CM Umur Tinggi badan Berat Badan jenis kelamin ICU/ Bangsal Riw. PGK Riw DM Riw HIV Riw alkoh ol Riw kortiko steroid Riw kemote rapi tanggal masuk Tanggal
keluar Albumin Hemoglobin 1 C173722 33 (-) (-) P ICU (-) (-) (-) (-) (-) (-) 15-08-09 21-08-09 1,9 10,8 2 C190642 45 (-) (-) L ICU (-) (-) (-) (-) (-) (-) 30-11-09 07-12-09 2,2 9,5 3 B442959 77 (-) 60 L ICU Ya (-) (-) (-) (-) (-) 14-06-09 18-06-09 1,6 9 4 C181409 32 (-) (-) L ICU (-) Ya (-) (-) (-) (-) 06-10-09 06-10-09 2,9 17,10 5 C173517 31 (-) (-) P ICU (-) (-) (-) (-) (-) (-) 14-08-09 18-08-09 1,7 6,10 6 C158526 54 160 60 L ICU (-) Ya (-) (-) (-) (-) 19-05-09 12-06-09 1,3 4,4 7 B400422 56 (-) (-) P ICU (-) Ya (-) (-) (-) (-) 15-08-09 18-08-09 2,9 11,6 8 C115573 69 (-) (-) L bangsal (-) (-) (-) (-) (-) (-) 31-12-09 08-01-09 2,2 11,7 9 C167593 61 (-) (-) L bangsal Ya (-) (-) (-) (-) (-) 12-07-09 22-07-09 2,4 9,10 10 C143661 67 (-) (-) P bangsal (-) (-) (-) (-) Ya (-) 23-02-09 18-03-09 2,2 8,2 11 C161168 24 (-) (-) P bangsal (-) (-) (-) (-) (-) (-) 04-06-09 05-06-09 1,3 5,8 12 B291065 38 (-) (-) L bangsal (-) (-) (-) (-) (-) (-) 04-01-09 11-01-09 1,9 10 13 C141020 60 167 65 L bangsal Ya (-) (-) (-) (-) (-) 07-02-09 14-02-09 2,4 10,8 14 C220154 22 (-) (-) L ICU (-) (-) (-) (-) (-) (-) 09-05-10 24-05-10 1,9 7,9 15 C206947 45 (-) (-) L ICU (-) (-) (-) Ya (-) (-) 02-03-10 03-03-10 3,1 12,8 16 B089007 58 (-) (-) L ICU (-) Ya (-) (-) (-) (-) 04-04-10 04-05-10 2,7 8,8 17 C195880 62 (-) (-) L ICU Ya Ya (-) (-) (-) (-) 09-01-10 20-01-10 2,4 12,6 18 C224809 22 (-) (-) L ICU (-) (-) (-) (-) (-) (-) 03-08-10 03-08-10 2 9,2 19 C198033 35 (-) (-) L bangsal (-) (-) (-) (-) Ya (-) 11-01-10 14-01-10 1,8 10,8 20 C204355 44 (-) (-) P bangsal Ya (-) (-) (-) (-) (-) 15-02-10 21-02-10 2,5 12,1 21 C241942 81 (-) (-) L bangsal (-) (-) (-) (-) (-) (-) 17-09-10 21-09-10 2 11,3 22 C232647 64 (-) (-) L bangsal (-) (-) (-) (-) (-) (-) 12-07-10 16-08-10 1,7 9 23 C250622 77 (-) (-) L bangsal (-) (-) (-) (-) (-) (-) 14-10-10 19-10-10 2,2 7,4 24 C259107 50 (-) (-) P bangsal (-) (-) (-) (-) (-) (-) 26-11-10 28-11-10 2,5 11,4 25 B319267 75 140 35 P bangsal (-) (-) (-) (-) (-) (-) 08-07-10 11-07-10 2,6 12,3 26 C322007 54 (-) (-) L ICU (-) (-) (-) (-) (-) (-) 09-11-11 20-11-11 3,3 13 27 C317066 42 (-) (-) L ICU Ya (-) (-) (-) (-) (-) 12-10-11 12-10-11 3 15,7 28 C318646 47 165 60 L ICU (-) Ya (-) (-) (-) (-) 20-10-11 23-10-11 3,2 11
29 C313416 17 (-) (-) P ICU (-) Ya (-) (-) (-) (-) 21-09-11 24-09-11 4,5 12 30 C286291 61 (-) (-) L ICU (-) (-) (-) (-) (-) (-) 10-04-11 18-04-11 3 11,9 31 C316811 58 (-) (-) L bangsal (-) Ya (-) (-) (-) (-) 11-10-11 13-10-11 1,9 13,5 32 C303360 43 (-) (-) L bangsal (-) (-) (-) (-) (-) (-) 18-07-11 19-07-11 2 12,3 33 C319259 44 (-) (-) L bangsal (-) (-) (-) (-) (-) (-) 24-10-11 28-10-11 1,5 5,90 34 C306547 26 (-) (-) P bangsal (-) (-) (-) (-) (-) (-) 06-08-11 08-08-11 2,4 8 35 C311522 36 (-) (-) L bangsal (-) Ya (-) (-) (-) (-) 10-09-11 11-09-11 2,3 5,8 36 C311385 67 (-) (-) P bangsal (-) (-) (-) (-) (-) (-) 09-09-11 10-09-11 2 11,4 37 C229213 17 (-) (-) P bangsal (-) (-) (-) (-) (-) (-) 04-02-11 11-02-11 1,9 6,9 38 C332116 24 (-) (-) L ICU (-) (-) (-) (-) (-) (-) 11-01-12 24-01-12 2,8 9,1 39 C341649 56 168 70 L ICU Ya (-) (-) (-) (-) (-) 29-02-12 02-03-12 1,6 11,53 40 C201649 53 (-) (-) L ICU (-) Ya (-) (-) (-) (-) 20-06-12 22-06-12 2,8 16,33 41 C204505 63 (-) (-) L ICU (-) Ya (-) (-) (-) (-) 22-01-12 23-01-12 2 10,6 42 C359354 68 (-) (-) P ICU Ya (-) (-) (-) (-) (-) 10-06-12 05-07-12 2,5 11,1 43 C378562 30 (-) (-) L ICU Ya (-) (-) (-) (-) (-) 01-10-12 04-10-12 3,4 9,3 44 C371506 62 170 50 L bangsal (-) (-) (-) (-) (-) (-) 21-08-12 03-09-12 3,1 10,8 45 C354079 69 (-) (-) P bangsal (-) (-) (-) (-) (-) (-) 03-07-12 18-07-12 1,6 11,1 46 C349515 57 (-) (-) L bangsal (-) Ya (-) (-) (-) (-) 14-04-12 14-04-12 2,5 13,79 47 C349284 26 (-) (-) L bangsal Ya (-) (-) (-) (-) (-) 12-04-12 17-04-12 3,1 11,2 48 C319461 63 (-) (-) L bangsal (-) (-) (-) (-) (-) (-) 16-10-12 18-10-12 3,4 11,8 49 C383490 50 (-) (-) P bangsal Ya (-) (-) (-) (-) (-) 31-10-12 01-11-12 1,8 11,31
Lampiran 4.Data penelitian pasien infeksi No No CM Umur Tinggi badan Berat Badan jenis kelamin ICU/ Bangsal Riw. PGK Riw. DM Riw. HIV Riw. alkoh ol Riw. Kortik ostero id Riw. kemot erapi tanggal masuk Tanggal keluar Albumin Hemog lobin 1 A562849 81 (-) (-) L ICU (-) (-) (-) (-) (-) (-) 23-09-09 01-10-09 2,9 13,6 2 B406637 81 (-) (-) P ICU (-) Ya (-) (-) (-) (-) 12-10-09 28-10-09 2,9 11,3 3 B013144 51 (-) (-) L ICU (-) (-) (-) (-) (-) (-) 29-07-09 02-08-09 3,6 11,9 4 C143194 74 (-) (-) P ICU (-) (-) (-) (-) (-) (-) 20-02-09 21-02-09 2,3 14,2 5 C091611 79 (-) (-) L ICU (-) (-) (-) (-) (-) (-) 24-08-09 29-08-09 2,3 10,1 6 B294823 54 (-) (-) L ICU (-) Ya (-) (-) (-) (-) 14-06-09 29-06-09 3,3 13,3 7 C172204 25 (-) (-) L bangsal (-) (-) (-) (-) (-) (-) 06-08-09 15-08-09 4,2 15,8 8 C194758 37 157 52 P bangsal (-) (-) Ya (-) (-) (-) 23-12-09 31-12-09 1,7 10,7 9 C189039 17 160 50 P bangsal (-) (-) (-) (-) (-) (-) 18-11-09 26-11-09 2,7 10,6 10 C185305 42 167 55 L bangsal (-) (-) (-) (-) (-) (-) 28-10-09 04-11-09 3,5 14,7 11 C191830 17 (-) (-) L bangsal (-) (-) (-) (-) (-) (-) 06-12-09 12-12-09 3,5 12,5 12 C193870 16 (-) (-) P bangsal (-) (-) (-) (-) (-) (-) 19-12-09 28-12-09 3,4 11,5 13 C258627 35 (-) (-) L bangsal (-) (-) (-) (-) (-) (-) 23-11-10 29-11-10 2,8 14 14 C206671 17 (-) (-) P bangsal (-) (-) (-) (-) (-) (-) 28-02-10 05-03-10 2,5 15,7 15 C224032 60 165 45 L bangsal (-) (-) (-) (-) (-) (-) 28-05-10 07-06-10 2,7 9,4 16 C201701 43 (-) (-) P bangsal (-) (-) (-) (-) (-) (-) 01-02-10 04-02-10 3,2 10,5 17 C212370 77 (-) (-) L bangsal (-) (-) (-) (-) (-) (-) 30-03-10 09-04-10 2,7 14,6 18 C212576 45 145 37 P bangsal (-) (-) (-) (-) (-) (-) 31-03-10 06-04-10 2,8 10,7 19 C228515 50 (-) (-) P bangsal (-) Ya (-) (-) (-) (-) 21-06-10 28-06-10 4 12,10 20 C242303 15 155 60 P bangsal (-) (-) (-) (-) (-) (-) 01-09-10 04-09-10 2,7 10,5 21 C362420 58 (-) (-) L bangsal (-) Ya (-) (-) (-) (-) 21-04-10 30-04-10 2,7 7,9 22 C224512 74 160 60 L bangsal (-) (-) (-) (-) (-) (-) 31-05-10 05-06-10 2,3 12,6 23 C243659 40 160 87 P bangsal (-) (-) (-) (-) (-) (-) 12-09-10 17-09-10 2,9 13 24 C205452 36 150 60 P bangsal (-) (-) (-) (-) (-) (-) 20-02-10 25-02-10 3,3 13,2 25 C203845 23 150 45 P bangsal (-) (-) (-) (-) (-) (-) 12-02-10 16-02-10 3,8 11,4 26 C286036 75 (-) (-) P bangsal (-) (-) (-) (-) (-) (-) 08-04-11 12-05-11 1,8 11 27 C327923 52 (-) (-) L bangsal (-) (-) (-) (-) (-) (-) 12-12-11 20-12-11 1,8 11,9 28 C309753 49 (-) (-) P bangsal (-) Ya (-) (-) (-) (-) 30-08-11 12-09-11 3 12
29 C290354 55 (-) (-) P bangsal (-) (-) (-) (-) (-) (-) 02-05-11 04-05-11 3,1 9,8 30 C317601 51 (-) (-) L bangsal (-) (-) (-) (-) (-) (-) 14-10-11 18-10-11 2,1 11,6 31 B327067 72 (-) (-) L bangsal (-) (-) (-) (-) (-) (-) 26-11-11 30-11-11 3,7 14 32 C286355 40 (-) (-) P bangsal (-) (-) (-) (-) (-) (-) 11-04-11 25-04-11 2 7,40 33 C291331 71 (-) (-) P bangsal (-) (-) (-) (-) (-) (-) 06-05-11 11-05-11 2,7 12,9 34 B314238 45 (-) (-) P bangsal (-) (-) (-) (-) (-) (-) 27-01-11 07-02-11 3,3 11,8 35 C292003 21 155 50 P bangsal (-) (-) (-) (-) (-) (-) 10-05-11 18-05-11 3,6 12,5 36 C285568 65 (-) (-) P bangsal (-) (-) (-) (-) (-) (-) 06-04-11 14-04-11 2,3 10,7 37 C288246 29 (-) (-) L bangsal (-) Ya (-) (-) (-) (-) 19-04-11 25-04-11 3,5 13,6 38 C382459 33 (-) (-) P bangsal (-) (-) (-) (-) Ya (-) 10-11-12 27-11-12 2,4 12,6 39 C391905 18 (-) (-) P bangsal (-) (-) (-) (-) (-) (-) 19-12-12 28-12-12 4,1 13,2 40 C376031 47 (-) (-) L bangsal (-) (-) (-) (-) (-) (-) 17-09-12 06-10-12 2,9 10,9 41 C347373 18 (-) (-) L bangsal (-) (-) (-) (-) (-) (-) 09-12-12 14-12-12 3,9 17,10 42 C371406 28 (-) (-) P bangsal (-) (-) (-) (-) (-) (-) 20-08-12 25-08-12 2,6 9,76 43 C371377 32 (-) (-) P bangsal (-) (-) (-) (-) (-) (-) 20-08-12 25-08-12 3,2 13,6 44 C381427 15 (-) (-) L bangsal (-) (-) (-) (-) (-) (-) 17-10-12 24-10-12 3,1 13,4 45 C273358 66 (-) (-) L bangsal (-) (-) (-) (-) (-) (-) 11-04-12 17-04-12 2,8 9,4 46 C368848 41 170 60 L bangsal (-) (-) (-) (-) (-) (-) 02-08-12 07-08-12 3,3 12,6 47 C380429 31 (-) (-) P bangsal (-) (-) (-) (-) (-) (-) 12-10-12 19-10-12 4 13,1 48 C382010 50 (-) (-) L bangsal (-) (-) (-) (-) (-) (-) 21-10-12 27-10-12 3,2 13,6 49 C348286 22 (-) (-) L bangsal (-) (-) (-) (-) (-) (-) 09-04-12 11-04-12 4,2 13,84
Lampiran 5. Hasil analisis SPSS
Umur
Descriptives 49,29 2,486 44,29 54,28 49,40 53,00 302,708 17,399 17 81 64 29 -,215 ,340 -,960 ,668 44,35 2,928 38,46 50,23 43,95 43,00 420,065 20,495 15 81 66 33 ,245 ,340 -1,041 ,668 Mean Lower Bound Upper Bound 95% Conf idence Interv al f or Mean 5% Trimmed Mean Median Variance Std. Dev iat ion Minimum Maximum RangeInterquart ile Range Skewness Kurt osis Mean Lower Bound Upper Bound 95% Conf idence Interv al f or Mean 5% Trimmed Mean Median Variance Std. Dev iat ion Minimum Maximum Range
Interquart ile Range Skewness Kurt osis Kelompok Sepsis Inf eksi Umur
Stat istic Std. Error
Tests of Normality ,099 49 ,200* ,962 49 ,117 ,087 49 ,200* ,942 49 ,018 Kelompok Sepsis Inf eksi Umur
St at ist ic df Sig. St at ist ic df Sig.
Kolmogorov -Smirnova Shapiro-Wilk
This is a lower bound of the true signif icance. *.
Lillief ors Signif icance Correction a.
NPar Tests
Mann-Whitney Test
Ranks 49 53,55 2624,00 49 45,45 2227,00 98 Kelompok Sepsis Inf eksi Total UmurN Mean Rank Sum of Ranks
Test Statisticsa 1002,000 2227,000 -1,411 ,158 Mann-Whitney U Wilcoxon W Z
Asy mp. Sig. (2-tailed)
Umur
Grouping Variable: Kelompok a.
Jenis kelamin * Kelompok
Crosstab 34 23 57 28,5 28,5 57,0 69,4% 46,9% 58,2% 34,7% 23,5% 58,2% 15 26 41 20,5 20,5 41,0 30,6% 53,1% 41,8% 15,3% 26,5% 41,8% 49 49 98 49,0 49,0 98,0 100,0% 100,0% 100,0% 50,0% 50,0% 100,0% Count Expected Count % wit hin Kelompok % of TotalCount
Expected Count % wit hin Kelompok % of Total
Count
Expected Count % wit hin Kelompok % of Total
Laki-laki
Perempuan Jenis kelamin
Total
Sepsis Inf eksi Kelompok Total Chi-Square Tests 5,074b 1 ,024 4,193 1 ,041 5,124 1 ,024 ,040 ,020 5,022 1 ,025 98 Pearson Chi-Square Continuity Correctiona Likelihood Ratio Fisher's Exact Test Linear-by -Linear Association N of Valid Cases Value df Asy mp. Sig. (2-sided) Exact Sig. (2-sided) Exact Sig. (1-sided)
Computed only f or a 2x2 table a.
0 cells (,0%) hav e expected count less than 5. The minimum expected count is 20,50.
b.
Risk Esti mate
2,562 1,121 5,858
1,630 1,033 2,573
,636 ,430 ,942
98 Odds Rat io f or Jenis
kelamin (Laki-laki / Perempuan)
For cohort Kelompok = Sepsis
For cohort Kelompok = Inf eksi
N of Valid Cases
Value Lower Upper
95% Conf idence Interv al
ICU/Bangsal * Kelompok
Crosstab 23 6 29 14,5 14,5 29,0 46,9% 12,2% 29,6% 23,5% 6,1% 29,6% 26 43 69 34,5 34,5 69,0 53,1% 87,8% 70,4% 26,5% 43,9% 70,4% 49 49 98 49,0 49,0 98,0 100,0% 100,0% 100,0% 50,0% 50,0% 100,0% Count Expected Count % wit hin Kelompok % of TotalCount
Expected Count % wit hin Kelompok % of Total
Count
Expected Count % wit hin Kelompok % of Total
ICU
Bangsal ICU/Bangsal
Total
Sepsis Inf eksi Kelompok Total Chi-Square Tests 14,154b 1 ,000 12,538 1 ,000 14,865 1 ,000 ,000 ,000 14,009 1 ,000 98 Pearson Chi-Square Continuity Correctiona Likelihood Ratio Fisher's Exact Test Linear-by -Linear Association N of Valid Cases Value df Asy mp. Sig. (2-sided) Exact Sig. (2-sided) Exact Sig. (1-sided)
Computed only f or a 2x2 table a.
0 cells (,0%) hav e expected count less than 5. The minimum expected count is 14,50. b. Risk Estimate 6,340 2,282 17,615 2,105 1,475 3,004 ,332 ,159 ,693 98 Odds Ratio f or ICU/Bangsal (ICU / Bangsal) For cohort Kelompok = Sepsis For cohort
Kelompok = Inf eksi N of Valid Cases
Value Lower Upper
95% Conf idence Interv al
GGK * Kelompok
Crosstab 11 0 11 5,5 5,5 11,0 22,4% ,0% 11,2% 11,2% ,0% 11,2% 38 49 87 43,5 43,5 87,0 77,6% 100,0% 88,8% 38,8% 50,0% 88,8% 49 49 98 49,0 49,0 98,0 100,0% 100,0% 100,0% 50,0% 50,0% 100,0% Count Expected Count % wit hin Kelompok % of TotalCount
Expected Count % wit hin Kelompok % of Total
Count
Expected Count % wit hin Kelompok % of Total
Y a
Tidak GGK
Total
Sepsis Inf eksi Kelompok Total Chi-Square Tests 12,391b 1 ,000 10,240 1 ,001 16,644 1 ,000 ,001 ,000 12,264 1 ,000 98 Pearson Chi-Square Continuity Correctiona Likelihood Ratio Fisher's Exact Test Linear-by -Linear Association N of Valid Cases Value df Asy mp. Sig. (2-sided) Exact Sig. (2-sided) Exact Sig. (1-sided)
Computed only f or a 2x2 table a.
0 cells (,0%) hav e expected count less than 5. The minimum expected count is 5,50. b. Risk Estimate 2,289 1,803 2,906 98 For cohort Kelompok = Sepsis N of Valid Cases
Value Lower Upper 95% Conf idence
DM * Kelompok
Crosstab 12 6 18 9,0 9,0 18,0 24,5% 12,2% 18,4% 12,2% 6,1% 18,4% 37 43 80 40,0 40,0 80,0 75,5% 87,8% 81,6% 37,8% 43,9% 81,6% 49 49 98 49,0 49,0 98,0 100,0% 100,0% 100,0% 50,0% 50,0% 100,0% Count Expected Count % wit hin Kelompok % of TotalCount
Expected Count % wit hin Kelompok % of Total
Count
Expected Count % wit hin Kelompok % of Total
Y a
Tidak DM
Total
Sepsis Inf eksi Kelompok Total Chi-Square Tests 2,450b 1 ,118 1,701 1 ,192 2,489 1 ,115 ,191 ,096 2,425 1 ,119 98 Pearson Chi-Square Continuity Correctiona Likelihood Ratio Fisher's Exact Test Linear-by -Linear Association N of Valid Cases Value df Asy mp. Sig. (2-sided) Exact Sig. (2-sided) Exact Sig. (1-sided)
Computed only f or a 2x2 table a.
0 cells (,0%) hav e expected count less than 5. The minimum expected count is 9,00. b. Risk Estimate 2,324 ,794 6,804 1,441 ,963 2,157 ,620 ,313 1,229 98 Odds Ratio f or DM (Y a / Tidak) For cohort Kelompok = Sepsis For cohort
Kelompok = Inf eksi N of Valid Cases
Value Lower Upper 95% Conf idence
HIV * Kelompok
Crosstab 0 1 1 ,5 ,5 1,0 ,0% 2,0% 1,0% ,0% 1,0% 1,0% 49 48 97 48,5 48,5 97,0 100,0% 98,0% 99,0% 50,0% 49,0% 99,0% 49 49 98 49,0 49,0 98,0 100,0% 100,0% 100,0% 50,0% 50,0% 100,0% Count Expected Count % wit hin Kelompok % of TotalCount
Expected Count % wit hin Kelompok % of Total
Count
Expected Count % wit hin Kelompok % of Total
Y a
Tidak HIV
Total
Sepsis Inf eksi Kelompok Total Chi-Square Tests 1,010b 1 ,315 ,000 1 1,000 1,397 1 ,237 1,000 ,500 1,000 1 ,317 98 Pearson Chi-Square Continuity Correctiona Likelihood Ratio Fisher's Exact Test Linear-by -Linear Association N of Valid Cases Value df Asy mp. Sig. (2-sided) Exact Sig. (2-sided) Exact Sig. (1-sided)
Computed only f or a 2x2 table a.
2 cells (50,0%) hav e expect ed count less than 5. The minimum expected count is ,50.
b.
Risk Esti mate
2,021 1,653 2,471
98 For cohort
Kelompok = Inf eksi N of Valid Cases
Value Lower Upper 95% Conf idence
Alkohol * Kelompok
Crosstab 1 0 1 ,5 ,5 1,0 2,0% ,0% 1,0% 1,0% ,0% 1,0% 48 49 97 48,5 48,5 97,0 98,0% 100,0% 99,0% 49,0% 50,0% 99,0% 49 49 98 49,0 49,0 98,0 100,0% 100,0% 100,0% 50,0% 50,0% 100,0% Count Expected Count % wit hin Kelompok % of TotalCount
Expected Count % wit hin Kelompok % of Total
Count
Expected Count % wit hin Kelompok % of Total
Y a
Tidak Alkohol
Total
Sepsis Inf eksi Kelompok Total Chi-Square Tests 1,010b 1 ,315 ,000 1 1,000 1,397 1 ,237 1,000 ,500 1,000 1 ,317 98 Pearson Chi-Square Continuity Correctiona Likelihood Ratio Fisher's Exact Test Linear-by -Linear Association N of Valid Cases Value df Asy mp. Sig. (2-sided) Exact Sig. (2-sided) Exact Sig. (1-sided)
Computed only f or a 2x2 table a.
2 cells (50,0%) hav e expect ed count less than 5. The minimum expected count is ,50. b. Risk Estimate 2,021 1,653 2,471 98 For cohort Kelompok = Sepsis N of Valid Cases
Value Lower Upper 95% Conf idence
Kortikosteroid * Kelompok
Crosstab 2 1 3 1,5 1,5 3,0 4,1% 2,0% 3,1% 2,0% 1,0% 3,1% 47 48 95 47,5 47,5 95,0 95,9% 98,0% 96,9% 48,0% 49,0% 96,9% 49 49 98 49,0 49,0 98,0 100,0% 100,0% 100,0% 50,0% 50,0% 100,0% Count Expected Count % wit hin Kelompok % of TotalCount
Expected Count % wit hin Kelompok % of Total
Count
Expected Count % wit hin Kelompok % of Total
Y a
Tidak Kort ikosteroid
Total
Sepsis Inf eksi Kelompok Total Chi-Square Tests ,344b 1 ,558 ,000 1 1,000 ,350 1 ,554 1,000 ,500 ,340 1 ,560 98 Pearson Chi-Square Continuity Correctiona Likelihood Ratio Fisher's Exact Test Linear-by -Linear Association N of Valid Cases Value df Asy mp. Sig. (2-sided) Exact Sig. (2-sided) Exact Sig. (1-sided)
Computed only f or a 2x2 table a.
2 cells (50,0%) hav e expect ed count less than 5. The minimum expected count is 1,50.
b.
Risk Esti mate
2,043 ,179 23,292
1,348 ,590 3,077
,660 ,132 3,309
98 Odds Rat io f or
Kort ikosteroid (Ya / Tidak) For cohort Kelompok = Sepsis
For cohort Kelompok = Inf eksi
N of Valid Cases
Value Lower Upper 95% Conf idence
Kemoterapi * Kelompok
Crosstab 49 49 98 49,0 49,0 98,0 100,0% 100,0% 100,0% 50,0% 50,0% 100,0% 49 49 98 49,0 49,0 98,0 100,0% 100,0% 100,0% 50,0% 50,0% 100,0% Count Expected Count % wit hin Kelompok % of TotalCount
Expected Count % wit hin Kelompok % of Total
Tidak Kemoterapi
Total
Sepsis Inf eksi Kelompok Total Chi-Square Tests .a 98 Pearson Chi-Square N of Valid Cases Value
No statistics are computed because Kemoterapi is a constant . a.
Risk Esti mate
.a Odds Rat io f or
Kemot erapi (Tidak / .)
Value
No statistics are computed because Kemoterapi is a constant . a.
Albumin * Kelompok
Crosstab 45 35 80 40,0 40,0 80,0 91,8% 71,4% 81,6% 45,9% 35,7% 81,6% 4 14 18 9,0 9,0 18,0 8,2% 28,6% 18,4% 4,1% 14,3% 18,4% 49 49 98 49,0 49,0 98,0 100,0% 100,0% 100,0% 50,0% 50,0% 100,0% Count Expected Count % wit hin Kelompok % of TotalCount
Expected Count % wit hin Kelompok % of Total
Count
Expected Count % wit hin Kelompok % of Total
Tidak normal
Normal Albumin
Total
Sepsis Inf eksi Kelompok Total Chi-Square Tests 6,806b 1 ,009 5,513 1 ,019 7,137 1 ,008 ,017 ,009 6,736 1 ,009 98 Pearson Chi-Square Continuity Correctiona Likelihood Ratio Fisher's Exact Test Linear-by -Linear Association N of Valid Cases Value df Asy mp. Sig. (2-sided) Exact Sig. (2-sided) Exact Sig. (1-sided)
Computed only f or a 2x2 table a.
0 cells (,0%) hav e expected count less than 5. The minimum expected count is 9,00.
b.
Risk Esti mate
4,500 1,361 14,878
2,531 1,044 6,137
,563 ,396 ,798
98 Odds Rat io f or Albumin
(Tidak normal / Normal) For cohort Kelompok = Sepsis
For cohort Kelompok = Inf eksi
N of Valid Cases
Value Lower Upper 95% Conf idence
Hemoglobin * Kelompok
Crosstab 40 25 65 32,5 32,5 65,0 81,6% 51,0% 66,3% 40,8% 25,5% 66,3% 9 24 33 16,5 16,5 33,0 18,4% 49,0% 33,7% 9,2% 24,5% 33,7% 49 49 98 49,0 49,0 98,0 100,0% 100,0% 100,0% 50,0% 50,0% 100,0% Count Expected Count % wit hin Kelompok % of TotalCount
Expected Count % wit hin Kelompok % of Total
Count
Expected Count % wit hin Kelompok % of Total
Tidak normal
Normal Hemoglobin
Total
Sepsis Inf eksi Kelompok Total Chi-Square Tests 10,280b 1 ,001 8,955 1 ,003 10,568 1 ,001 ,002 ,001 10,175 1 ,001 98 Pearson Chi-Square Continuity Correctiona Likelihood Ratio Fisher's Exact Test Linear-by -Linear Association N of Valid Cases Value df Asy mp. Sig. (2-sided) Exact Sig. (2-sided) Exact Sig. (1-sided)
Computed only f or a 2x2 table a.
0 cells (,0%) hav e expected count less than 5. The minimum expected count is 16,50. b. Risk Estimate 4,267 1,709 10,649 2,256 1,252 4,068 ,529 ,365 ,767 98 Odds Ratio f or Hemoglobin (Tidak normal / Normal) For cohort Kelompok = Sepsis For cohort
Kelompok = Inf eksi N of Valid Cases
Value Lower Upper
95% Conf idence Interv al
Logistic Regression
Block 0: Beginning Block
Dependent Vari able Encoding
0 1 Original Value Sepsis Inf eksi Internal Value
Classificati on Tablea,b
0 49 ,0 0 49 100,0 50,0 Observ ed Sepsis Inf eksi Kelompok Ov erall Percentage St ep 0
Sepsis Inf eksi
Kelompok Percent age
Correct Predicted
Constant is included in the model. a.
The cut v alue is , 500 b.
Variables in the Equation
,000 ,202 ,000 1 1,000 1,000
Constant St ep 0
B S. E. Wald df Sig. Exp(B)
Variabl es not in the Equation
5,074 1 ,024 14,154 1 ,000 2,450 1 ,118 6,806 1 ,009 10,280 1 ,001 27,004 5 ,000 sex ICU_Bangsal DM Albumin Hemoglobin Variables
Ov erall Stat istics St ep
0
Block 1: Method = Backward Stepwise (Likelihood Ratio)
Omnibus Tests of Model Coefficients
30,836 5 ,000 30,836 5 ,000 30,836 5 ,000 -1,095 1 ,295 29,741 4 ,000 29,741 4 ,000 -2,104 1 ,147 27,636 3 ,000 27,636 3 ,000 -2,678 1 ,102 24,958 2 ,000 24,958 2 ,000 St ep Block Model St ep Block Model St ep Block Model St ep Block Model St ep 1 St ep 2a St ep 3a St ep 4a Chi-square df Sig.
A negat iv e Chi-squares v alue indicates that the Chi-squares v alue has decreased f rom the prev ious step.
a. Model Summary 105,021a ,270 ,360 106,116a ,262 ,349 108,221a ,246 ,328 110,899a ,225 ,300 St ep 1 2 3 4 -2 Log likelihood
Cox & Snell R Square
Nagelkerke R Square
Estimation terminat ed at iteration number 5 because parameter est imat es changed by less than ,001. a.
Classificati on Tablea 35 14 71,4 13 36 73,5 72,4 35 14 71,4 14 35 71,4 71,4 42 7 85,7 25 24 49,0 67,3 23 26 46,9 6 43 87,8 67,3 Observ ed Sepsis Inf eksi Kelompok Ov erall Percentage Sepsis Inf eksi Kelompok Ov erall Percentage Sepsis Inf eksi Kelompok Ov erall Percentage Sepsis Inf eksi Kelompok Ov erall Percentage St ep 1 St ep 2 St ep 3 St ep 4
Sepsis Inf eksi
Kelompok Percent age
Correct Predicted
The cut v alue is , 500 a.
Variables in the Equation
,654 ,489 1,788 1 ,181 1,923 ,737 5,016 1,562 ,588 7,057 1 ,008 4,771 1,506 15,109 ,764 ,741 1,061 1 ,303 2,146 ,502 9,172 1,077 ,699 2,373 1 ,123 2,936 ,746 11,556 1,536 ,573 7,181 1 ,007 4,644 1,511 14,277 -8,303 2,109 15,501 1 ,000 ,000 ,701 ,485 2,089 1 ,148 2,016 ,779 5,215 1,719 ,573 9,015 1 ,003 5,581 1,817 17,146 1,091 ,705 2,392 1 ,122 2,977 ,747 11,866 1,377 ,539 6,521 1 ,011 3,963 1,377 11,400 -7,047 1,602 19,351 1 ,000 ,001 1,875 ,562 11,143 1 ,001 6,519 2,168 19,600 1,095 ,696 2,477 1 ,116 2,988 ,764 11,683 1,387 ,531 6,809 1 ,009 4,001 1,412 11,337 -6,337 1,503 17,780 1 ,000 ,002 1,935 ,559 11,969 1 ,001 6,922 2,313 20,714 1,549 ,516 8,993 1 ,003 4,705 1,710 12,948 -5,392 1,316 16,790 1 ,000 ,005 sex ICU_Bangsal DM Albumin Hemoglobin Constant St ep 1a sex ICU_Bangsal Albumin Hemoglobin Constant St ep 2a ICU_Bangsal Albumin Hemoglobin Constant St ep 3a ICU_Bangsal Hemoglobin Constant St ep 4 a
B S. E. Wald df Sig. Exp(B) Lower Upper
95,0% C.I. f or EXP(B)
Variable(s) entered on step 1: sex, I CU_Bangsal, DM, Albumin, Hemoglobin. a.
Model if Term Removed -53,409 1,797 1 ,180 -56,437 7,853 1 ,005 -53,058 1,095 1 ,295 -53,787 2,554 1 ,110 -56,512 8,002 1 ,005 -54,110 2,104 1 ,147 -58,240 10,365 1 ,001 -54,351 2,585 1 ,108 -56,576 7,036 1 ,008 -60,734 13,247 1 ,000 -55,450 2,678 1 ,102 -57,803 7,385 1 ,007 -62,645 14,390 1 ,000 -60,496 10,093 1 ,001 Variable sex ICU_Bangsal DM Albumin Hemoglobin St ep 1 sex ICU_Bangsal Albumin Hemoglobin St ep 2 ICU_Bangsal Albumin Hemoglobin St ep 3 ICU_Bangsal Hemoglobin St ep 4 Model Log Likelihood Change in -2 Log Likelihood df Sig. of the Change
Variables not in the Equation
1,082 1 ,298 1,082 1 ,298 2,119 1 ,145 1,393 1 ,238 3,188 2 ,203 2,207 1 ,137 1,412 1 ,235 2,604 1 ,107 5,744 3 ,125 DM Variables Ov erall Statistics St ep 2a sex DM Variables Ov erall Statistics St ep 3b sex DM Albumin Variables Ov erall Statistics St ep 4c Score df Sig.
Variable(s) remov ed on step 2: DM. a.
Variable(s) remov ed on step 3: sex. b.
Variable(s) remov ed on step 4: Albumin. c.
Tabel Sebaran Umur berdasarkan Sepsis dan Infeksi
Kelompok Mean SD Median (min – max) p‡
Sepsis 49,29 17,399 53 (17 – 81) 0,158 Infeksi 44,35 20,495 43 (15 – 81)
Keterangan :
‡Mann Whitney
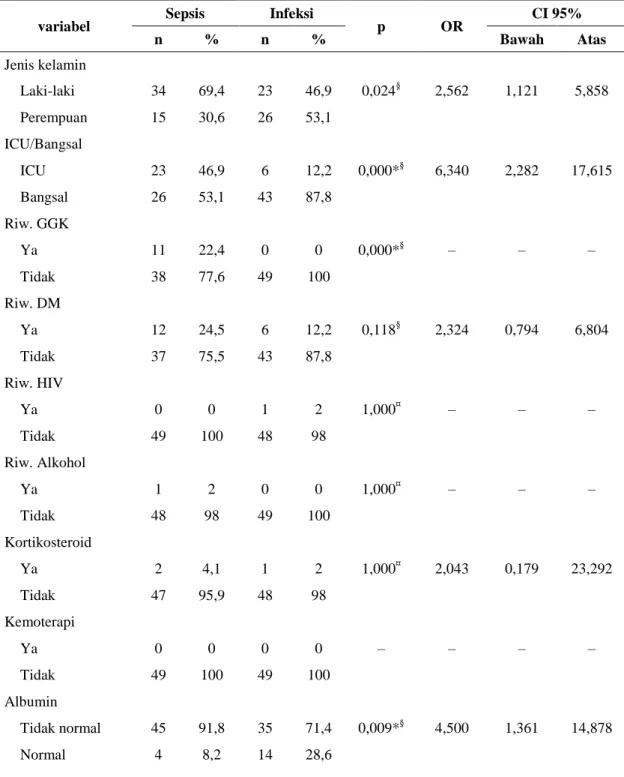
Tabel Uji Chi Square berdasarkan Sepsi dan Infeksi
variabel Sepsis Infeksi p OR CI 95%
n % n % Bawah Atas Jenis kelamin Laki-laki 34 69,4 23 46,9 0,024§ 2,562 1,121 5,858 Perempuan 15 30,6 26 53,1 ICU/Bangsal ICU 23 46,9 6 12,2 0,000*§ 6,340 2,282 17,615 Bangsal 26 53,1 43 87,8 Riw. GGK Ya 11 22,4 0 0 0,000*§ – – – Tidak 38 77,6 49 100 Riw. DM Ya 12 24,5 6 12,2 0,118§ 2,324 0,794 6,804 Tidak 37 75,5 43 87,8 Riw. HIV Ya 0 0 1 2 1,000¤ – – – Tidak 49 100 48 98 Riw. Alkohol Ya 1 2 0 0 1,000¤ – – – Tidak 48 98 49 100 Kortikosteroid Ya 2 4,1 1 2 1,000¤ 2,043 0,179 23,292 Tidak 47 95,9 48 98 Kemoterapi Ya 0 0 0 0 – – – – Tidak 49 100 49 100 Albumin Tidak normal 45 91,8 35 71,4 0,009*§ 4,500 1,361 14,878 Normal 4 8,2 14 28,6
Hemoglobin Tidak normal 40 81,6 25 51 0,001*§ 4,267 1,709 10,649 Normal 9 18,4 24 49
Keterangan :
* Signifikan p < 0,05
§Pearson Chi-Square
¤Fisher’s Exact
Tabel Regresi Logistik
Langkah Variabel p OR CI 95% Bawah Atas 4 ICU/Bangsal 0,001* 6,922 2,313 20,714 Hemoglobin 0,003* 4,705 1,710 12,948