117
CHAPTER 6 ELECTRONIC BEHAVIOR OF SrCo0.9Nb0.1O3-δ
6.1 Summary
This chapter studies the electronic behavior of SrCo0.9Nb0.1O3-‐δ (SCN) using several x-‐ray techniques. Section 6.2 motivates the sample preparation and experimental techniques used. Section 6.3 provides experimental details. Section 6.4 discusses the findings. It is shown that thermogravimetric quenching enables preparation and simultaneous characterization of SCN pellet samples with a wide range of oxygen stoichiometries. Then, x-‐ray absorption near-‐edge spectroscopy (XANES), x-‐ray diffraction (XRD), and x-‐ray photoelectron spectroscopy (XPS) are used to characterize these quenched pellets. The results confirm that strontium and niobium in SCN are fixed-‐valent, and that the average valence of cobalt decreases monotonically with decreasing oxygen content. Finally, in situ non-‐resonant inelastic x-‐ray scattering (NRIXS) is used to probe the bulk electronic structure in equilibrium at high temperatures. The resulting oxygen K edge structures provide strong evidence that at high temperatures SCN has substantial covalency between the oxygen 2p and cobalt 3d states. The implications of this covalency are discussed.
6.2 Background
Solid state chemists have theorized for decades that the metallic conductivity of stoichiometric SrCoO3.00 is due to covalent character in the bonding, and a number
of experimental and computational studies have reported evidence for this theory at or below room temperature. However, these results are obtained from quenched (thermodynamically unstable but kinetically stable) samples of SrCoO3.00. It is not obvious that such covalency will persist at high temperatures for highly non-‐stoichiometric oxides in equilibrium. Ideally, a study could probe a non-‐
stoichiometric oxide with varying oxygen contents under both quenched and equilibrium conditions.
Such a study is the subject of this chapter. Samples of SrCo0.9Nb0.1O3-‐δ were examined in two forms: ex situ in a quenched state at room temperature, and in situ in equilibrium at high temperature. First, traditional x-‐ray photoelectron spectroscopy (XPS) was used ex situ to acquire cobalt L23 edges. These edge structures exhibited no significant differences between different oxygen contents, however, so in subsequent measurements, x-‐ray absorption methods were pursued. For the cations, x-‐ray absorption fine structure (XAFS) edges are measured in the conventional way. For the oxygen ions, the situation is more challenging. Since oxygen 1s electrons have a binding energy of ~ 532 eV, conventional techniques for probing the structure of oxygen edges (EELS, XPS, and soft x-‐ray absorption) must use lower energy electrons or x-‐rays that require near-‐
vacuum conditions and that do not penetrate deeply into samples. These limitations are severe, because it becomes impossible to measure edge changes under the atmospheres that are of greatest interest to applications. Moreover, the results are surface sensitive and thus the assignment of edge changes to bulk
119
chemical effects is clouded. Furthermore, as a result of the vacuum requirement, the samples would need to be "quenched", i.e., metastable and out of equilibrium, when the goal is to probe the equilibrium state.
For these reasons, the oxygen K edges were acquired using a somewhat unconventional technique, non-‐resonant inelastic x-‐ray scattering (NRIXS). This technique is described in more detail in the literature.79 In brief, NRIXS measures the cross section for inelastic scattering of hard x-‐rays such that the energy lost by the incident x-‐ray is equivalent to the excitation energy of the electronic transition of interest. Thus low-‐energy excitations (like the oxygen K edge) can be probed using high-‐energy (penetrating) x-‐rays. This tremendous advantage makes NRIXS compatible with in situ controlled atmosphere experiments, and a penetration depth > 10 μm makes NRIXS truly bulk-‐sensitive.
The disadvantage of NRIXS is that the cross section is extremely small. Acquiring sufficient signal to have meaningful results typically requires an insertion device at a third-‐generation synchrotron source, an array of detectors, and long acquisition times on the order of 1 h -‐ 8 h per edge.
6.3 Experimental details 6.3.1 Synthesis
SCN powder was synthesized by solid state reaction as described in Chapter 5, except the powder was fired in two stages: first at 1150˚C for 15 h, then (a small impurity-‐phase reflection attributed to incomplete calcination was observed at ~
31˚ by x-‐ray diffraction (XRD, Philips X'Pert Pro, Cu Ka)) the powder was attritor milled for another 45 min, dried at 115˚C, fired at 1200˚C for 10 h, and gently ground with a mortar and pestle. Single phase cubic perovskite SCN was obtained.
La0.6Sr0.4FeO3-‐δ
powder was obtained from a commercial supplier (Praxair, 99.9%
pure, 0.4 µm-‐ 10 µm particle sizes).
Compacts for the quenched pellet studies described below were prepared by adding 13 mg polyvinylpyrrolidone (dissolved in isopropanol) to 1.3 g of the above SCN powder to serve as binder. The powder was then pressed uniaxially in a 19 mm diameter die at 2.5 tons for 10 min, removed from the press, covered with an upside-‐down beaker, and left in stagnant air overnight. The compact was heated slowly to 500˚C to remove the binder, then sintered at 1200˚C for 10 h. An identical powder compact was placed underneath the sample to prevent contamination from the alumina support during sintering. The resulting pellet was polished to a 600 grit level and cut using a Buehler Isomet low-‐speed saw into six smaller pellets. These pellets were then sonicated sequentially in acetone, distilled water, and isopropanol to remove any residual sandpaper particles or cutting fluid, and dried at 120˚C.
6.3.2 Quenching
Pellet quenching and simultaneous thermogravimetry were carried out in a Netszch STA 449C thermal analyzer using a platinum crucible. The desired gas atmospheres were obtained by flowing premixed gases with various amounts of O2 and N2. The first pellet was weighed at 25˚C using the thermal analyzer, heated to high temperature, allowed to equilibrate in a certain gas atmosphere, and then cooled at 50˚C/min to room temperature. A baseline run with an empty crucible and identical heating and gas profile was carried out immediately prior to the quenching, and this run was subsequently subtracted from the quenching run to correct for mass changes due to buoyancy effects. Two mass differences were extracted from this profile: between the equilibrated high temperature state and the initial unquenched 25˚C state, and between the equilibrated high temperature state and the final quenched 25˚C state. These mass differences were attributed entirely to changes in oxygen content. The absolute oxygen stoichiometry 3-‐δ at the equilibrated high temperature state was presumed to be that given by the oxygen content profiles in Figure 5.2, and the mass differences were then used to determine the absolute oxygen stoichiometry 3-‐δof the unquenched and quenched states. The entire sequence above was repeated for each of the six pellets. Different oxygen stoichiometries were obtained for each pellet by using different temperatures and oxygen partial pressures for the high temperature equilibration step, and a slower cooling rate of 1˚C/min was used for one pellet. After 25 days, one of the pellets (labeled as pellet #1 below) was subject to the same quenching sequence, to verify that the quenching process is repeatable and to verify that the pellets were indeed quenched, i.e., not exchanging noticeable amounts of O2 with
121
the ambient air at 25˚C. Full details of the quenching conditions are provided below along with the results.
6.3.3 Initial characterization
After the above steps, XRD patterns were measured from each pellet. The six pellets were then embedded together in epoxy with graphite filler (Buehler 20-‐
8128-‐032 resin, 20-‐8128-‐008 hardener, 20-‐8500 conductive filler) to ensure they were processed identically in subsequent steps. The pellet surfaces were kept exposed, and the pellets were not warmed to any noticeable extent by the epoxy hardening reaction. The epoxy-‐embedded pellets (hereafter referred to as just 'the pellets') were polished down to 0.3 µm grit using alumina powders (Allied High Tech Products), and cleaned in an ultrasonic bath.
Electron microprobe analysis (EPMA, JEOL JXA-‐8200) was employed for chemical analysis using SrTiO3, Co, and Nb standards. A carbon coater (Cressington 108) was used to coat the pellets with ~ 30 nm carbon before the EPMA measurement.
The relative cation amounts measured were converted into a chemical formula by assuming no Sr interstitials or Sr vacancies were present. The measured formula (applicable for all 6 pellets) was SrCo0.91±0.01Nb0.09±0.01O3-‐δ, matching the nominal composition within the error of the measurement. Micrographs taken using the same instrument suggested that the compacts were ~ 50% porous. The carbon coating was polished off after the measurements (again with wet sandpaper and then successive alumina grit sizes down to 0.3 um), and the pellets were again sonicated in isopropanol.
X-‐ray photoelectron spectroscopy (XPS, Surface Science Instruments, model M-‐
Probe) was used to acquire niobium 3d3/2-‐5/2 and cobalt 2p1/2-‐3/2 spectra from several pellets. The analyzed area of the samples was 250 µm x 1000 µm. Due to offgassing from the epoxy, the vacuum chamber took unusually long to pump down (many hours), reaching a pressure in the analysis chamber of 3e-‐8 torr and leading to somewhat reduced count rates. The binding energy scale was calibrated from the carbon contamination using the C 1s peak at 285.0 eV. The pellets were briefly polished shortly before the spectra were taken.
Three months later, none of the pellets had changed color, but nevertheless the pellets were again polished from 240 grit down to 0.3 um in preparation for the x-‐
ray absorption measurements described below, which took place a few days later.
The color of the pellets did not change as a result of this polishing. XRD patterns were retaken to verify that the pellets retained their original lattice parameter (and by correlation, their original oxygen content).
6.3.4 X-ray absorption spectroscopy
X-‐ray absorption edges were acquired from each of the six pellets by Tim Fister at the Advanced Photon Source on beamline 20BM with a 400 µm x 400 µm toroidally focused beam. For each pellet, scans of the Sr, Co, and Nb K-‐edges were recorded in fluorescence mode. SrO2, Co, and Nb standards were measured in transmission mode to provide an energy reference. The background was subtracted and the data normalized. No correction was made for self-‐absorption.
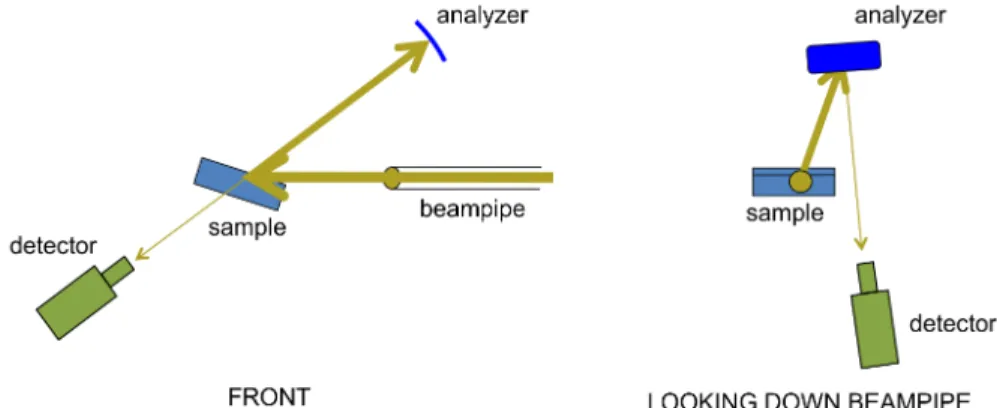
6.3.5 Non-resonant inelastic x-ray scattering
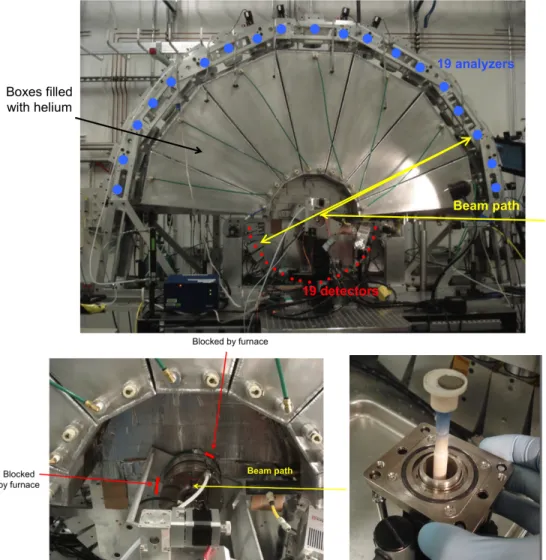
Non-‐resonant inelastic x-‐ray scattering (NRIXS) experiments were performed by the author using the LERIX end-‐station79 at the PNC/XOR insertion device, beamline 20-‐ID, at the Advanced Photon Source. The experimental setup is shown in Figure 6.1 and Figure 6.2. Guidance in acquiring and analyzing the data was provided by Tim Fister, Kee-‐Chul Chang, and the staff at beamline 20, especially Mali Balasubramanian. Toroidal focusing of the x-‐ray beam from the silicon (111) double-‐crystal monochromator was performed, giving ~ 1013 photons/s incident on the samples over a ~ 1 mm spot size. The LERIX instrument was configured to have a full array of 19 spherically-‐bent silicon (555) crystal analyzers able to independently measure scattered photon intensities with momentum transfers ranging from 0.8 Å-‐1 to 10.1 Å-‐1. Lead tape was applied to portions of the detector slits to reduce the background noise to 10-‐50 counts/s on all detectors. The oxygen K edge shape was observed to be independent of momentum, similar to what has been found for other oxides, enabling integration over all detectors. The spectra at higher momentum had reduced count rates, however, so the signal-‐to-‐
noise ratio was improved by integrating only over detectors 4 through 11 (3.1 Å -‐
7.7 Å). The measurements had an energy resolution of ~1.3 eV.
Figure 6.1. Schematic of the beampath in the NRIXS experiment.
123
Figure 6.2. The LERIX spectrometer used in the NRIXS measurements and located at Beamline 20-‐ID at the Advanced Photon Source. Top: Overall configuration. Left:
Mounting of the high-‐temperature chamber during the NRIXS measurement. Right:
SCN powder compact used in the measurement, before installation into the high-‐
temperature chamber.
The sample consisted of an unfired powder compact prepared from the SCN powder described above. The powder was pressed uniaxially at 8 tons for 10 min in a 13 mm diameter steel die with no binder or lubricant. The die faces were covered with Kapton tape to avoid contaminating the compact surface during pressing. The resulting compact had no cracks and was ~ 0.5 mm thick. The penetration depth of 10 keV x-‐rays in dense SCN was calculated to be much less, 25 µm, so the measurement achieved truly bulk-‐sensitive measurements of SCN with no signal contamination from material underneath the sample.
During the NRIXS measurements, the SCN compact was supported by a shallow alumina cup inside a chamber designed for in situ x-‐ray measurements up to 1200˚C (Anton-‐Paar HTK 1200N) that includes radiative sample heating, high-‐
vacuum-‐compatible sealing, and x-‐ray-‐transparent Kapton-‐graphite windows. The total pressure in the furnace was 1 atm, and the desired oxygen partial pressures were obtained by flowing pre-‐mixed gases with the appropriate amounts of O2 and N2 through the sample chamber and then, for verification, past a zirconia-‐based oxygen sensor (Setnag) mounted in a quartz tube in a separate furnace. The in situ chamber was mounted such that the x-‐ray incident angle was 15˚ relative to the sample surface. This mounting configuration blocked analyzers 1, 2, 3, and 13.
For each condition, the sample was allowed to equilibrate for 1 h -‐ 4 h. These equilibration times were long enough to allow the oxygen content of the metastable cubic phase to stabilize, and short enough such that the very minor extent of phase decomposition could be neglected. The stabilization was verified during the experiment by repeated cobalt K edge scans using a fluorescence detector, as well as prior to the experiment by measurements on analogous samples by TGA, and separately by in situ XRD using the same in situ chamber.
Stabilization was judged to have been reached when enough time had elapsed such that the K edge structure, the mass change, and the diffraction pattern were all constant on a time scale of hours.
After equilibration at each condition, oxygen K, cobalt M1, and cobalt M2,3 scans were acquired for durations of 6 h, 1.5 h, and 1.5 h, along with a survey scan from 9900 eV -‐ 10720 eV to look for anomalous edges (none were observed). To verify repeatability and improve the data quality, the oxygen K edge measurements at 1000˚C 1e-‐4 atm O2 and 500˚C 1 atm O2 were repeated for another 6 h.
For comparison, additional NRIXS measurements were taken on an unfired powder compact of a second material, La0.6Sr0.4FeO3-‐δ (LSF 640). The same experimental parameters were used, except for the following: the thickness of the measured compact was ~ 1 mm (as compared to an absorption length of 13 µm), the x-‐ray incident angle was 10˚-‐12˚, and the energy resolution was ~1.7 eV.
6.4 Results and discussion 6.4.1 Quenching
A typical profile from the thermogravimetric pellet quenching is shown in Figure 6.3. Stable mass values (drift < 20 µg/h) were reached for all pellets, both during the high temperature equilibration step and after the low temperature quenching.
125
Figure 6.3. Typical mass profile of an SCN pellet equilibrated in the TGA at high temperature and then quenched. See pellet #5 in Table 6.1 for processing parameters.
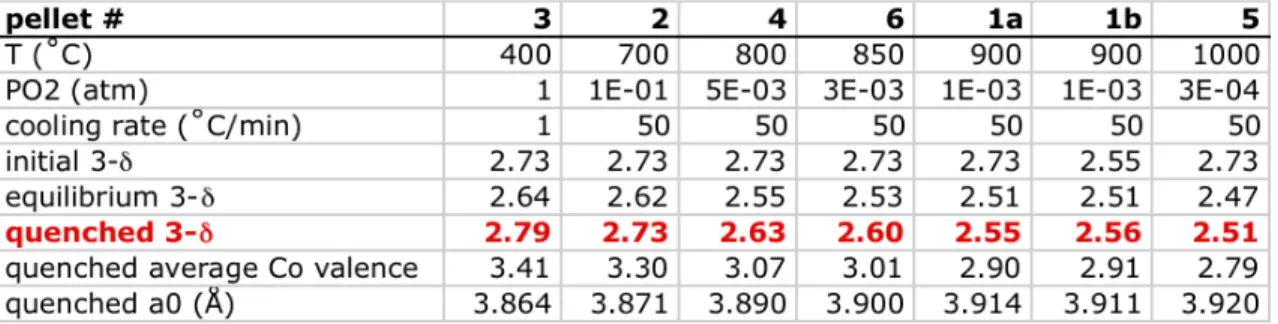
The equilibration temperatures, oxygen partial pressures, and cooling rates that were used are summarized in Table 6.1, along with the calculated values for the initial, equilibrium, and final oxygen stoichiometries of the quenched pellet. The precision of the measurements is supported by the fact that the measured initial 3-‐
δ values were identical for all six pellets, which is expected since the pellets were all cut from same larger pellet. Pellet 1 was quenched twice; column 1a corresponds to the first quenching, column 1b to the second quenching performed 21 days later. For this pellet, the final 3-‐δ measured in the first quenching run precisely matched the initial 3-‐δ measured in the second run, providing further evidence that the measurements are repeatable and precise, and that the pellet oxygen exchange kinetics are truly quenched.
Table 6.1. Summary of parameters from the pellet quenching runs.
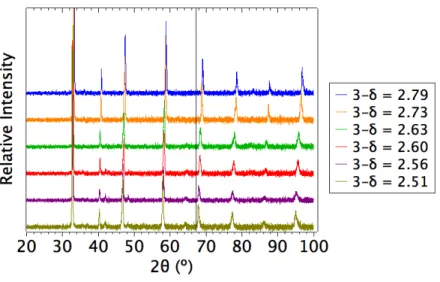
X-‐ray diffraction patterns taken from the pellets shortly after quenching are shown in Figure 6.4. They show several reflections indexable to the cubic perovskite phase, and these reflections exhibit a small but noticeable peak shift to lower angles for lower oxygen contents, as expected. Additional low-‐intensity reflections around 42˚, 48.5˚, and 64˚ are increasingly apparent at lower oxygen contents and are not indexable to the cubic perovskite. To check the possibility that these reflections are caused by segregation of a second phase within the host SCN phase, these reflections were compared with XRD patterns found in the Inorganic Crystal Structure Database (ICSD) for several other plausible phases, including SrO, CoO, Co3O4, SrCO3, and all Sr-‐Co-‐O compounds listed in the ICSD. No correspondence was observed. Furthermore, these three low-‐intensity reflections also appear to exhibit a peak shift to lower angles for lower oxygen contents, suggesting that they do not arise from an impurity phase with fixed lattice parameter. Quasi-‐cubic lattice parameters were extracted from the indexed peaks by the Nelson-‐Riley method and are included in Table 6.1.
127
Figure 6.4. XRD patterns taken from the six pellets shortly after quenching. A vertical black line was added at 67˚ to make the peak shifts between spectra easier to see.
6.4.2 X-ray photoelectron spectra
While the focus in the current study is on the bulk valence behavior, as a brief aside, surface-‐sensitive x-‐ray photoelectron spectra (XPS) of the niobium 3d and cobalt 2p edges acquired from the quenched pellets are shown in Figure 6.5.
Niobium spectra were only acquired from the lowest and highest oxygen content pellets; cobalt spectra were acquired from all pellets. The cobalt spectrum corresponding to 3-‐δ = 2.63 appeared anomalous and was discarded. No significant change in binding energy, relative intensity, or width is observed between the peaks at different oxygen stoichiometries.
Figure 6.5. X-‐ray photoelectron spectra measured from SCN quenched pellets with various oxygen stoichiometries 3-‐δ, showing the niobium 3d3/2-‐5/2 peaks (left) and cobalt 2p1/2-‐3/2 peaks (right).
A similar XPS study was conducted on LixCoO2 samples with the lithium content x varied from 1.0 to 0.0 by electrochemical delithiation.80 The cobalt 2p peaks measured in that study were seen to peak at nearly identical binding energies as in the current study, but were somewhat sharper. The authors claimed that "the binding energy and the relative area of the satellite peak [at 790 eV] are a more efficient tool to access the oxidation state of cobalt than the binding energy of the main peak itself". However, the satellite peak seen at 790 eV in the LixCoO2 study is not observed here for SCN. These data indicate that the cobalt 2p XPS spectra are not a sensitive probe of valence in SCN, and may not be for cobalt perovskites in general.
6.4.3 X-ray absorption fine structure
Turning to the x-‐ray absorption fine structure (XAFS) measurements, since the penetration depth in SCN of x-‐rays at the energies used is 20 µm -‐ 90 µm, the
129
measurements are expected to be bulk-‐sensitive. The K edges of strontium, cobalt, and niobium are shown in Figure 6.6. A key result here is that the niobium and strontium edges show little change over the range of oxygen stoichiometries studied, indicating that those ions are well-‐approximated as fixed-‐valent.
On the other hand, the features of the cobalt K edge vary significantly with oxygen content. Specifically, the threshold energy of the cobalt K edges (defined as the energy at which the absorption intensity reaches half its peak value) exhibits a monotonic shift to lower energies upon reduction of SCN. The most reduced pellet has a 2 eV lower threshold energy than the most oxidized pellet.
Decreases in formal oxidation state have long been correlated with edge shifts to lower energy.81 The correlation may originate from a direct screening effect: an added valence electron screens the final (continuum) state from the positive nucleus more than it does the initial (core) state from the positive nucleus; thus an added valence electron could directly decrease the energy difference between the initial and final states. The correlation may also originate indirectly from bond length changes; an added valence electron increases the average bond length to an ion's nearest neighbors, which increases the electron wavelength (and decreases the energy) at which constructive interference is maximized between the outgoing electron wave and the backscattered wave from the neighbor, and the result is a decrease in the absorption edge energy. As Bunker notes, "it is difficult to experimentally distinguish between the direct correlation (formal-‐charge -‐-‐> edge-‐
shift) and the indirect one (formal-‐charge -‐-‐> bond distance -‐-‐> edge shift)."81 Thus the shift in threshold energy of the cobalt K edges is a strong indicator of increased electron density in the cobalt-‐oxygen bond, but the shift cannot tell us whether the electron density is being added to the cobalt, to the oxygen, or to both.
Figure 6.6. Strontium (upper left), niobium (upper right), and cobalt (lower left and right) K edges for SCN pellets quenched with various oxygen stoichiometries.
Inset plots show an enlarged view of the edges at threshold.
131
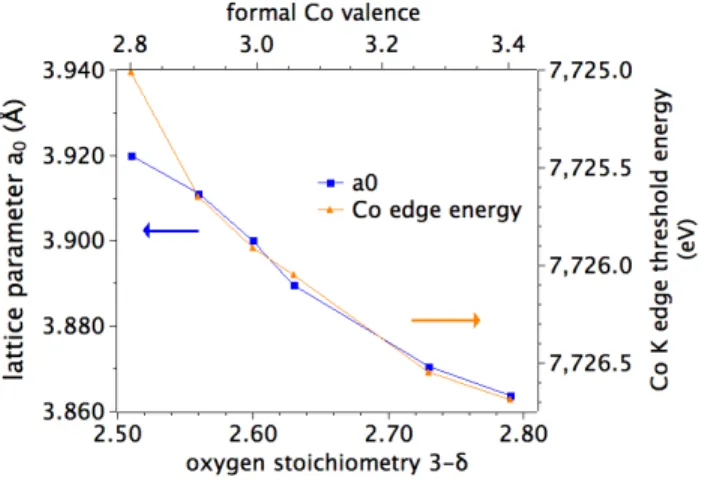
Although we have not yet been able to extract reliable information from the extended (EXAFS) structure, we measured the quasi-‐cubic lattice parameter in the quenched pellets to test whether the cobalt edge shifts are associated with bond length changes. The results are shown in Figure 6.7 below. An excellent correlation is observed for all pellets, except for the pellet with the lowest oxygen content.
However, a few days after the XANES measurement that pellet was observed to have changed to a darker color, so, on this evidence, we tentatively attribute the high cobalt edge energy in this most highly quenched pellet to a phase instability.
Figure 6.7. Quasi-‐cubic lattice parameter a0 and cobalt K edge threshold energy as a function of oxygen stoichiometry.
Note that the cobalt K pre-‐edge centroid also exhibits a monotonic shift to lower energies upon reduction, by a total of 0.6 eV over the valence range studied here.
In iron compounds, the pre-‐edge centroid energy has been shown to be a clear indicator of valence; essentially, over a wide range of compounds and coordination numbers, the Fe2+ centroid energy was found to be consistently 1.4 eV ± 0.1 eV
lower than the Fe3+ centroid energy.82 An analogous study of Co compounds has not been reported, so here we merely observe that the pre-‐edge shifts observed for cobalt in SCN are slightly smaller, e.g., 0.6 eV per 0.6 change in formal oxidation state of cobalt in SCN, versus 1.4 eV per 1.0 change in formal oxidation state of iron.
6.4.4 Non-resonant inelastic x-ray scattering
We turn now to the oxygen K edges acquired by NRIXS. In general for a K edge, dipole-‐allowed final bound states have p orbital symmetry.83 In a purely ionic model for oxygen ions, the configuration is 1s22s22p6, the valence shell is fully occupied, there are no unoccupied bound p states, and we would expect to observe no pre-‐edge beyond perhaps a weak quadrupole-‐allowed transition. Conversely, substantial oxygen K pre-‐edge intensity can be related to the extent of covalency, i.e., the extent to which bound states are available owing to a sharing of electron density with neighboring ions.83 For example, in the case that the oxygen 2p states are hybridized with 3d states centered on the neighboring transition metal ions, we expect, in a first approximation, to observe molecular-‐orbital states of t2g and eg symmetry separated by a ligand-‐field splitting. Furthermore, since the t2g orbitals are π-‐bonded to the oxygen 2p states whereas the eg orbitals are σ-‐bonded, if electron density is removed from the covalent bond (e.g., by oxidizing the crystal), it should be removed preferentially from the eg orbitals, and the ratio eg:t2g of the peak intensities should increase upon oxidation.
133
The measured edge structures are shown in Figure 6.8. The pre-‐edge is indeed two-‐peaked, and the ratio of the peak intensities increases as predicted from the ligand field model. Additionally, the magnitude of the eg:t2g peak splitting is seen to be approximately 2.4 eV, a reasonable value that is comparable to peak splittings in transition-‐metal octahedral complexes determined from optical measurements.83 Taken together, these data are strong evidence that in this compound there is significant metal 3d -‐ oxygen 2p hybridization at high temperatures.
Figure 6.8. Oxygen K edges taken by non-‐resonant inelastic x-‐ray scattering (NRIXS) on SCN. Data indicated by circles are a repeat run.
Note that the long penetration length of the hard x-‐rays used (~20 µm for SCN) and the bulk nature of the sample (particle size ~ 1 µm -‐ 20 um) implies this is a bulk chemical effect. Also note the most reducing condition was measured twice,
before and after the most oxidizing condition, to demonstrate repeatability and rule out irreversible effects like hard x-‐ray damage.
In Figure 6.9, we compare the quenched cobalt K edges described above with high temperature cobalt K edges that were acquired in the NRIXS experiment. The data quality in the latter edges was unfortunately suboptimal; the fast scan rate resulted in somewhat increased noise, and the energy calibration scans (performed on Co metal foil) were inadvertently not all saved. Nevertheless, a qualitative visual comparison is possible. The green and red curves are cobalt K edges acquired from quenched samples at 25˚C; the blue and purple scans are the same edges acquired at 1000˚C. In contrast to the large changes in intensity seen in the LSF 640 oxygen K edges shown below, the edge differences evident here are limited to shifting or small changes in intensity of existing features.
135
Figure 6.9. Cobalt K edges for SCN taken using XAFS. Green = quenched pellet at 25˚C with 3-‐δ of 2.55, red = quenched powder at 25˚C with 3-‐δof 2.57, purple/blue
= powder compact equilibrated at 1000˚C with 3-‐δ of 2.45.
6.5 Discussion
Most oxides are insulators, with values of electronic conductivity that are orders of magnitude lower than observed in this work for SCN. The above findings suggest the hypothesis that covalent bonding between the Co and O atoms is responsible for the unusually high electronic conductivity and low enthalpy of migration values measured in Chapter 5. The large degree of covalent characer in the Co-‐O bond may also be responsible for the high surface activity. In other words, if oxygen p-‐
orbital character leads to facile electron hopping between atoms already incorporated into the crystal, it may also lead to facile electron hopping onto neutral oxygen atoms that are dissociatively adsorbed on the surface.
To test this hypothesis in future studies, it would be very useful to have a quantitative metric for the degree of covalency. A recent report suggested the possibility of using the integrated intensity under the oxygen K pre-‐edge as a proxy for the degree of covalency.84 An in situ ambient pressure XAFS study of oxygen K edges, combined with simultaneously measurements of surface activity, could be a nice test of the possible quantitative correlation between activity and covalency.
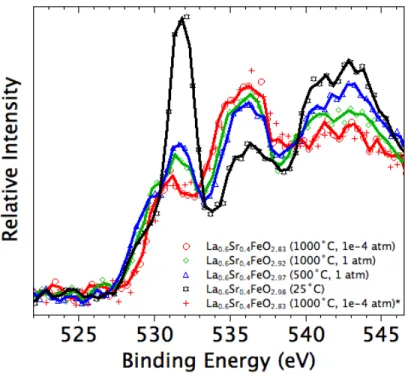
137 6.5.1 Appendix: La0.6Sr0.4FeO3-‐δ
Oxygen K edge spectra acquired by NRIXS from an LSF 640 powder compact are shown in Figure 6.10. Although the signal-‐to-‐noise ratio and energy resolution are not good enough to resolve the pre-‐edge structure in detail, the overall trends are clear. The structure can be separated into three regions: pre-‐edge at 528 eV -‐ 533 eV, a "threshold peak" at 533 eV -‐ 539 eV, and an additional peak at 539 eV -‐ 546 eV. Previous literature85 supports the assignment of these three regions as follows:
pre-‐edge is primarily bound Fe 3d character with some O p character, threshold is primarily La 5d and Sr 4d character with some O p character, and the additional peak is primarily O p character.
Remarkably, the pre-‐edge intensity grows substantially upon cooling from 500˚C to 25˚C, suggesting a significant increase in the degree of covalency. This trend appears to originate purely from thermal contraction of the lattice, since thermogravimetry confirmed that the oxygen stoichiometry was virtually unchanged from the cooling. A Mössbauer spectrum taken on powder cooled in identical manner shows no evidence of magnetic ordering (Figure 6.11). A spin-‐
state transition upon cooling is possible, however. In any case, this substantial change between the equilibrium and quenched conditions underscores the importance of in situ studies of such materials.
Figure 6.10. Oxygen K edges acquired from La0.6Sr0.4FeO3-‐δ by non-‐resonant
inelastic x-‐ray scattering (NRIXS). Oxygen stoichiometries listed in the legend were calculated from literature data86 and in-‐house thermogravimetry.
Figure 6.11. 57Fe Mössbauer spectrum from La0.6Sr0.4FeO2.98
powder at 25˚C.
139
References
1 Singhal, S. C. & Kendall, K. High Temperature Solid Oxide Fuel Cells. Elsevier, 1-‐22 (2003).
2 Fuel Cell Handbook, Seventh Edition. U.S. Department of Energy (2004).
3 Adler, S. Factors governing oxygen reduction in solid oxide fuel cell cathodes. Chemical reviews (2004).
4 Kuklja, M. M., Kotomin, E. A., Merkle, R., Mastrikov, Y. A. & Maier, J.
Combined theoretical and experimental analysis of processes determining cathode performance in solid oxide fuel cells. Physical Chemistry Chemical Physics 15, 5443-‐5471, doi:Doi 10.1039/C3cp44363a (2013).
5 Chueh, W. C. & Haile, S. M. Electrochemistry of Mixed Oxygen Ion and Electron Conducting Electrodes in Solid Electrolyte Cells. Annu Rev Chem Biomol 3, 313-‐341, doi:Doi 10.1146/Annurev-‐Chembioeng-‐073009-‐101000 (2012).
6 Bessler, W. G. et al. Model anodes and anode models for understanding the mechanism of hydrogen oxidation in solid oxide fuel cells. Physical
Chemistry Chemical Physics 12, 13888-‐13903, doi:Doi 10.1039/C0cp00541j (2010).
7 Adler, S. B. Reference Electrode Placement in Thin Solid Electrolytes.
Journal of the Electrochemical Society 149, E166-‐E172 (2002).
8 Sasaki, K. A., Hao, Y. & Haile, S. M. Geometrically asymmetric electrodes for probing electrochemical reaction kinetics: a case study of hydrogen at the Pt-‐CsH2PO4 interface. Physical Chemistry Chemical Physics 11, 8349-‐8357 (2009).
9 Brichzin, V., Fleig, J., Habermeier, H. U. & Maier, J. Geometry dependence of cathode polarization in solid oxide fuel cells investigated by defined Sr-‐
doped LaMnO3 microelectrodes. Electrochem Solid St 3, 403-‐406, doi:Doi 10.1149/1.1391160 (2000).
10 Fleig, J., Kim, H. R., Jamnik, J. & Maier, J. Oxygen Reduction Kinetics of
Lanthanum Manganite (LSM) Model Cathodes: Partial Pressure Dependence and Rate-‐Limiting Steps. Fuel Cells 8, 330-‐337, doi:Doi
10.1002/Fuce.200800025 (2008).
11 la O', G. J. et al. Catalytic Activity Enhancement for Oxygen Reduction on Epitaxial Perovskite Thin Films for Solid-‐Oxide Fuel Cells. Angew Chem Int Edit 49, 5344-‐5347, doi:Doi 10.1002/Anie.201001922 (2010).
12 De Souza, R. A. & Kilner, J. A. Oxygen transport in La1-‐xSrxMn1-‐yCoyO3 +/-‐
delta perovskites part II. Oxygen surface exchange. Solid State Ionics 126, 153-‐161, doi:Doi 10.1016/S0167-‐2738(99)00228-‐3 (1999).
13 Wang, L., Merkle, R. & Maier, J. Surface Kinetics and Mechanism of Oxygen Incorporation Into Ba1-‐xSrxCoyFe1-‐yO3-‐delta SOFC Microelectrodes.
Journal of the Electrochemical Society 157, B1802-‐B1808, doi:Doi 10.1149/1.3494224 (2010).
14 Jung, W. & Tuller, H. L. A New Model Describing Solid Oxide Fuel Cell Cathode Kinetics: Model Thin Film SrTi1-‐xFexO3-‐d Mixed Conducting Oxides-‐a Case Study. Adv. Energy Mater. 1, 1184-‐1191,
doi:10.1002/aenm.201100164 (2011).
15 Wedig, A., Lynch, M. E., Merkle, R., Maier, J. & Liu, M. Sheet Resistance in Thin Film Solid Oxide Fuel Cell Model Cathodes: A Case Study on Circular Bi1-‐xSrxFeO3-‐delta Microelectrodes. Ionic and Mixed Conducting Ceramics 8 45, 213-‐224, doi:Doi 10.1149/1.3701311 (2012).
16 Nagai, T., Ito, W. & Sakon, T. Relationship between cation substitution and stability of perovskite structure in SrCoO3-‐delta-‐based mixed conductors.
Solid State Ionics 177, 3433-‐3444, doi:10.1016/j.ssi.2006.10.022 (2007).
17 Zhou, W., Shao, Z., Ran, R., Jin, W. & Xu, N. A novel efficient oxide electrode for electrocatalytic oxygen reduction at 400–600 °C. Chem. Commun., 5791, doi:10.1039/b813327a (2008).
18 Usiskin, R. E. & Haile, S. M. to be published.
19 Brichzin, V., Fleig, J., Habermeier, H. U., Cristiani, G. & Maier, J. The geometry dependence of the polarization resistance of Sr-‐doped LaMnO3
microelectrodes on yttria-‐stabilized zirconia. Solid State Ionics 152, 499-‐
507, doi:Pii S0167-‐2738(02)00379-‐X Doi 10.1016/S0167-‐2738(02)00379-‐X (2002).
20 Ioroi, T., Hara, T., Uchimoto, Y., Ogumi, Z. & Takehara, Z. Preparation of perovskite-‐type La1-‐xSrxMnO3 films by vapor-‐phase processes and their electrochemical properties. Journal of the Electrochemical Society 144, 1362-‐1370, doi:Doi 10.1149/1.1837597 (1997).
21 Koep, E., Mebane, D. S., Das, R., Compson, C. & Liu, M. L. Characteristic thickness for a dense La0.8Sr0.2MnO3 electrode. Electrochem Solid St 8, A592-‐A595, doi:Doi 10.1149/1.2050607 (2005).
22 la O', G. J. & Shao-‐Horn, Y. Thickness Dependence of Oxygen Reduction Reaction Kinetics on Strontium-‐Substituted Lanthanum Manganese Perovskite Thin-‐Film Microelectrodes. Electrochem Solid St 12, B82-‐B85, doi:Doi 10.1149/1.3095681 (2009).
23 la O', G. J., Yildiz, B., McEuen, S. & Shao-‐Horn, Y. Probing oxygen reduction reaction kinetics of Sr-‐doped LaMnO3 supported on Y2O3-‐stabilized ZrO2.
Journal of the Electrochemical Society 154, B427-‐B438, doi:Doi 10.1149/1.2508887 (2007).
24 Jung, W., Dereux, J. O., Chueh, W. C., Hao, Y. & Haile, S. M. High electrode activity of nanostructured, columnar ceria films for solid oxide fuel cells.
Energy Environ. Sci. 5, 8682-‐8689, doi:Doi 10.1039/C2ee22151a (2012).
25 Ferguson, J. D., Arikan, G., Dale, D. S., Woll, A. R. & Brock, J. D. Measurements of Surface Diffusivity and Coarsening during Pulsed Laser Deposition. Phys Rev Lett 103, doi:Artn 256103
Doi 10.1103/Physrevlett.103.256103 (2009).
26 Lai, W. & Haile, S. M. Impedance Spectroscopy as a Tool for Chemical and Electrochemical Analysis of Mixed Conductors: A Case Study of Ceria. J
141
American Ceramic Society 88, 2979-‐2997, doi:10.1111/j.1551-‐
2916.2005.00740.x (2005).
27 Jamnik, J. & Maier, J. Treatment of the impedance of mixed conductors -‐
Equivalent circuit model and explicit approximate solutions. Journal of the Electrochemical Society 146, 4183-‐4188, doi:Doi 10.1149/1.1392611 (1999).
28 Newman, J. Resistance for Flow of Current to a Disk. Journal of the
Electrochemical Society 113, 501-‐&, doi:Doi 10.1149/1.2424003 (1966).
29 Bak, T., Nowotny, J., Rekas, M., Sorrell, C. C. & Vance, E. R. A manometric method for the determination of chemical diffusion in non-‐stoichiometric oxides: Example of (La,Sr)MnO3. Solid State Ionics 135, 557-‐561, doi:Doi 10.1016/S0167-‐2738(00)00636-‐6 (2000).
30 Mizusaki, J. et al. Oxygen nonstoichiometry and defect equilibrium in the perovskite-‐type oxides La1-‐xSrxMnO3+d. Solid State Ionics 129, 163-‐177, doi:Doi 10.1016/S0167-‐2738(99)00323-‐9 (2000).
31 De Souza, R. A., Kilner, J. A. & Walker, J. F. A SIMS study of oxygen tracer diffusion and surface exchange in La0.8Sr0.2MnO3+delta. Materials Letters 43, 43-‐52, doi:Doi 10.1016/S0167-‐577x(99)00228-‐1 (2000).
32 Jiang, S. P. & Love, J. G. Origin of the initial polarization behavior of Sr-‐doped LaMnO3 for O-‐2 reduction in solid oxide fuel cells. Solid State Ionics 138, 183-‐190, doi:Doi 10.1016/S0167-‐2738(00)00806-‐7 (2001).
33 Cai, Z. H., Kubicek, M., Fleig, J. & Yildiz, B. Chemical Heterogeneities on La0.6Sr0.4CoO3-‐delta Thin Films-‐Correlations to Cathode Surface Activity and Stability. Chemistry of Materials 24, 1116-‐1127, doi:Doi
10.1021/Cm203501u (2012).
34 Chueh, W. C., Hao, Y., Jung, W. & Haile, S. M. High electrochemical activity of the oxide phase in model ceria-‐Pt and ceria-‐Ni composite anodes. Nature Materials 11, 155-‐161, doi:Doi 10.1038/Nmat3184 (2012).
35 Opitz, A. K. & Fleig, J. Investigation of O-‐2 reduction on Pt/YSZ by means of thin film microelectrodes: The geometry dependence of the electrode impedance. Solid State Ionics 181, 684-‐693, doi:Doi
10.1016/J.Ssi.2010.03.017 (2010).
36 Ahlgren, E. O. & Poulsen, F. W. Thermoelectric power of stabilized zirconia.
Solid State Ionics 82, 193-‐201, doi:Doi 10.1016/0167-‐2738(95)00201-‐3 (1995).
37 Shao, Z. & Haile, S. M. A high-‐performance cathode for the next generation of solid-‐oxide fuel cells. Nature 431, 170-‐173 (2004).
38 Lee, J. G., Park, J. H. & Shul, Y. G. Tailoring gadolinium-‐doped ceria-‐based solid oxide fuel cells to achieve 2 W cm−2 at 550 °C. Nat Commun 5, doi:10.1038/ncomms5045 (2014).
39 Yan, J. W., Enoki, M., Matsumoto, H. & Ishihara, T. An intermediate temperature solid oxide fuel cell using a La(Sr)Ga(Mg)O-‐3 thin film prepared by pulsed laser deposition as electrolyte. Electrochemistry 73, 945-‐950 (2005).
40 Han, F. et al. Novel high-‐performance solid oxide fuel cells with bulk ionic conductance dominated thin-‐film electrolytes. Journal of Power Sources 218, 157-‐162, doi:Doi 10.1016/J.Jpowsour.2012.06.087 (2012).
41 Park, S., Choi, S., Shin, J. & Kim, G. A collaborative study of sintering and composite effects for a PrBa0.5Sr0.5Co1.5Fe0.5O5+delta IT-‐SOFC cathode.
Rsc Adv 4, 1775-‐1781, doi:Doi 10.1039/C3ra45296d (2014).
42 Zhu, Y. L. et al. An A-‐Site-‐Deficient Perovskite offers High Activity and Stability for Low-‐Temperature Solid-‐Oxide Fuel Cells. Chemsuschem 6, 2249-‐2254, doi:Doi 10.1002/Cssc.201300694 (2013).
43 Ahn, J. S. et al. High-‐performance bilayered electrolyte intermediate temperature solid oxide fuel cells. Electrochemistry Communications 11, 1504-‐1507, doi:Doi 10.1016/J.Elecom.2009.05.041 (2009).
44 Baumann, F. S. et al. Quantitative comparison of mixed conducting SOFC cathode materials by means of thin film model electrodes. Journal of the Electrochemical Society 154, B931-‐B941, doi:10.1149/1.2752974 (2007).
45 Baumann, F., Fleig, J., Habermeier, H. & Maier, J. Impedance spectroscopic study on well-‐defined (La, Sr)(Co, Fe) O3− δ model electrodes. Solid State Ionics 177, 1071-‐1081 (2006).
46 Baumann, F., Fleig, J., Habermeier, H. & Maier, J. Ba0. 5Sr0. 5Co0. 8Fe0. 2O3−
δ thin film microelectrodes investigated by impedance spectroscopy. Solid State Ionics 177, 3187-‐3191 (2006).
47 Crumlin, E. J. et al. Oxygen Reduction Kinetics Enhancement on a
Heterostructured Oxide Surface for Solid Oxide Fuel Cells. J Phys Chem Lett 1, 3149-‐3155, doi:Doi 10.1021/Jz101217d (2010).
48 Mutoro, E., Crumlin, E. J., Biegalski, M. D., Christen, H. M. & Shao-‐Horn, Y.
Enhanced oxygen reduction activity on surface-‐decorated perovskite thin films for solid oxide fuel cells. Energy Environ. Sci. 4, 3689-‐3696, doi:Doi 10.1039/C1ee01245b (2011).
49 Wang, L., Merkle, R., Maier, J., Acarturk, T. & Starke, U. Oxygen tracer diffusion in dense Ba0.5Sr0.5Co0.8Fe0.2O3-‐delta films. Applied Physics Letters 94, doi:Artn 071908
Doi 10.1063/1.3085969 (2009).
50 Kawada, T. et al. Determination of oxygen vacancy concentration in a thin film of La0.6Sr0.4CoO3-‐delta by an electrochemical method. Journal of the Electrochemical Society 149, E252-‐E259, doi:Doi 10.1149/1.1479728 (2002).
51 Jacobson, A. J. Materials for Solid Oxide Fuel Cells. Chemistry of Materials 22, 660-‐674, doi:Doi 10.1021/Cm902640j (2010).
52 Sun, C. W., Hui, R. & Roller, J. Cathode materials for solid oxide fuel cells: a review. Journal of Solid State Electrochemistry 14, 1125-‐1144, doi:Doi 10.1007/S10008-‐009-‐0932-‐0 (2010).
53 Verkerk, M. J., Hammink, M. W. J. & Burggraaf, A. J. Oxygen-‐Transfer on Substituted Zro2, Bi2o3, and Ceo2 Electrolytes with Platinum-‐Electrodes .1.
Electrode Resistance by Dc Polarization. Journal of the Electrochemical Society 130, 70-‐78, doi:Doi 10.1149/1.2119686 (1983).
143
54 Dumélié, M., Nowogrocki, G. & Boivin, J. C. Ionic conductor membrane for oxygen separation. Solid State Ionics 28–30, Part 1, 524-‐528,
doi:http://dx.doi.org/10.1016/S0167-‐2738(88)80095-‐X (1988).
55 Takahashi, T., Iwahara, H. & Esaka, T. High Oxide Ion Conduction in Sintered Oxide of System Bi2o3-‐M2o5. Journal of the Electrochemical Society 124, 1563-‐1569, doi:Doi 10.1149/1.2133111 (1977).
56 Takahashi, T., Iwahara, H. & Arao, T. High Oxide Ion Conduction in Sintered Oxides of System Bi2o3-‐Y2o3. J Appl Electrochem 5, 187-‐195, doi:Doi 10.1007/Bf01637268 (1975).
57 Boivin, J. C. & Mairesse, G. Recent material developments in fast oxide ion conductors. Chemistry of Materials 10, 2870-‐2888, doi:Doi
10.1021/Cm980236q (1998).
58 Fister, T. T. et al. In situ characterization of strontium surface segregation in epitaxial La[sub 0.7]Sr[sub 0.3]MnO[sub 3] thin films as a function of
oxygen partial pressure. Appl. Phys. Lett. 93, 151904, doi:10.1063/1.2987731 (2008).
59 Mizusaki, J., Mima, Y., Yamauchi, S., Fueki, K. & Tagawa, H. Nonstoichiometry of the perovskite-‐type oxides La1-‐xSrxCoO3-‐[delta]. Journal of Solid State Chemistry 80, 102-‐111 (1989).
60 Koinuma, H. & Takeuchi, I. Combinatorial solid-‐state chemistry of inorganic materials. Nature Materials 3, 429-‐438, doi:Doi 10.1038/Nmat1157 (2004).
61 Švarcová, S., Wiik, K., Tolchard, J., Bouwmeester, H. & Grande, T. Structural instability of cubic perovskite BaxSr1− xCo1− yFeyO3− δ. Solid State Ionics 178, 1787-‐1791 (2008).
62 Mueller, D. N. et al. A kinetic study of the decomposition of the cubic
perovskite-‐type oxide BaxSr1-‐xCo0.8Fe0.2O3-‐delta (BSCF) (x=0.1 and 0.5).
Phys Chem Chem Phys 12, 10320-‐10328, doi:10.1039/c0cp00004c (2010).
63 Kriegel, R., Kircheisen, R. & Töpfer, J. Oxygen stoichiometry and expansion behavior of Ba0.5Sr0.5Co0.8Fe0.2O3−δ. Solid State Ionics 181, 64-‐70, doi:10.1016/j.ssi.2009.11.012 (2010).
64 Arnold, M., Gesing, T. & Martynczuk, J. Correlation of the Formation and the Decomposition Process of the BSCF Perovskite at …. Chemistry of Materials (2008).
65 Nelson, J. B. & Riley, D. P. AN EXPERIMENTAL INVESTIGATION OF EXTRAPOLATION METHODS IN THE DERIVATION OF ACCURATE UNIT-‐
CELL DIMENSIONS OF CRYSTALS. Proceedings of the Physical Society of London 57, 160-‐177, doi:10.1088/0959-‐5309/57/3/302 (1945).
66 Harrison, W. T. A., Hegwood, S. L. & Jacobson, A. J. A Powder Neutron-‐
Diffraction Determination of the Structure of Sr6co5o15, Formerly
Described as the Low-‐Temperature Hexagonal Form of Srcoo3-‐X. J Chem Soc Chem Comm, 1953-‐1954, doi:Doi 10.1039/C39950001953 (1995).
67 Bucher, E., Egger, A., Ried, P., Sitte, W. & Holtappels, P. Oxygen
nonstoichiometry and exchange kinetics of Ba0. 5Sr0. 5Co0. 8Fe0. 2O3− δ.
Solid State Ionics 179, 1032-‐1035 (2008).