Variations of Fagan's measure of the number of errors found have been used in many subsequent studies of inspection efficiency [Votta 1993; Knight and Myers 1993]. The frequency of inspections is high for all projects and depends on the size of the project.
Participation
CTR frequency has a fairly strong correlation with the number of commits, indicating that reviewers are likely keeping up with changes to the system. However, the top reviewers, that is, those in the 95th percentile, participate in between 13 (Apache CTR) and 36 (Linux RTC) reviews per month. The consistently small number of reviews a developer participates in is likely due to inherent human limits and developer expertise.
Developers interviewed stated that they specialize in a particular aspect of a large system, which in turn limits the number of reviews they can participate in [Rigby and Storey 2011]. Most developers do few reviews per month and only the best reviewers participate in a large number of reviews per month. However, there is a very large number of developers who participate in only one review in a given month, indicating that a proportionally large number of developers see each review.

Experience and Expertise
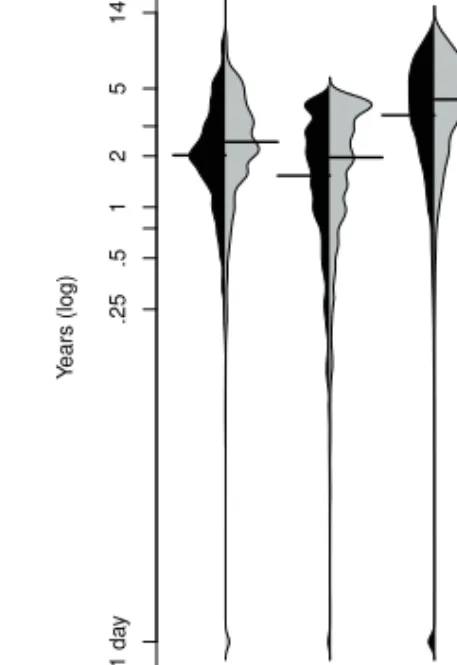
It is also clear that the authors and reviewers for the RTC have been with the project for a shorter time and are likely to be less experienced than the reviewers and authors involved in the CTR. This result is not surprising because CTR requires the author to have publishing privileges, and experienced core developers often need to monitor the publishing mailing list, making experienced developers more likely to be involved in CTR than RTC. The amount of "work" done by an author or reviewer is calculated monthly as the number of review messages, reviewed commits, and unreviewed commits made by the developer prior to the current review, regardless of area or files changed.7.
Let the function work(m,i) be the number of times an individual i made a commit or participated in a review in month m. Because of this high correlation, we use the maximum reviewer in the rest of this work. From Figures 12 and 13 we can see that reviewers have more active work expertise than authors.
Churn and Change Complexity
In summary, we find that authors have less work experience and expertise than reviewers and that RTC includes less experienced individuals with less work expertise than CTR. Change size is measured by summing the number of lines added and deleted in a software change or patch. OSS projects have a policy that requires contributions to be small, independent, and complete, so it's not surprising that change sizes are smaller than those in industrial development.
This policy allows developers to periodically and quickly review a large number of contributions [Lussier 2004; Rigby and Storey 2011]. The change complexity measures he considered were the following: the number of changed lines (churn), the number of changed files in a change, the number of distinct differences per revision, the distance between contiguous change blocks within an equator, the depth of indentation in ' a change [Hindle et al. Similarly, Rigby found high correlations between each change complexity measure and the size of the change.
Review Interval
Other works have found a high correlation between complexity measures, such as McCabe's cyclomatic complexity, and file size. Since attrition is the most parsimonious measure of change complexity and has been used in previous inspection experiments, we use it as a rough measure of change complexity. For RTC, on the right side of Figure 16, we see that the median interval is between 23 and 46 hours, while 75% of contributions are reviewed within 3 to 7 days.
CTR. Since the contribution is committed before it is reviewed, we need to know not only the time between the commit and the last response, the entire CTR review interval (right in Figure 17), but also the time between the commit and the first response. The discussion or the entire review interval lasts longer, with a median value between 5.6 and 19.4 hours. In 75% of cases, the review takes less than between 19.8 hours and 2.7 days depending on the project.

Issues and Defects
For RTC, Figure 18 shows that the number of issues discussed in a review is one or two in the median case and between two and four in the 75th percentile. For the CTR, Figure 19 shows that the number of problems is one in the median case and between one and two in the 75th percentile. Because each patch contribution must receive at least one comment to be considered a review, the minimum number of issues per review is one.
In short, we do not have the traditional measure of the number of defects found per assessment. However, interviews with OSS developers have shown that they are less interested in counting defects and more interested in discussing solutions to problems found in the code. Because the size of the contributions is small (between 11 and 32 modified lines, see section 5.4), we do not expect a large number of problems to be found per review.
Summary of Quantitative Results
Frequency Q1. Although regular assessments were carried out on all projects, the number of assessments varies depending on the size of the project. Ratings increase with the number of commits (CTR), but not necessarily with the number of patch submissions (RTC). Participation in the second quarter. There are hundreds of stakeholders subscribed to the mailing lists containing the submissions for review; however, there is a small number of reviewers and posts per review.
Q3 Experience and expertise. Authors typically have less experience and expertise than reviewers, and individuals involved in CTR have more experience and expertise than those in RTC. Developers involved in reviews typically have at least one year of experience, and in the case of core reviews, usually several years. Q4 Churn and complexity of changes. The changes in patches are minor, which will likely make providing feedback faster.

MODELS OF EFFICIENCY AND EFFECTIVENESS
Efficiency: Review Interval
For example, a 10% increase in the number of modified rows (i.e. churn) results in a 1.2% increase in the review interval. A developer who has been on a project for an additional 60 days extends the review interval by two minutes. For example, doubling the number of reviewers leads to a 140% increase in the review interval.
Reviewer experience has shown that an increase of 1/4 (or 95 days) with the project increases the review interval by 15 minutes. Doubling the number of rows changed from 17 to 34 increases the scan interval by 1.8 hours. Summary. The effectiveness of a review or review interval is most influenced by the level of community participation.
Effectiveness: Issues Discovered
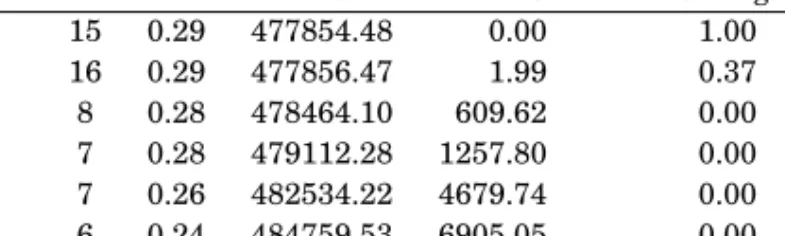
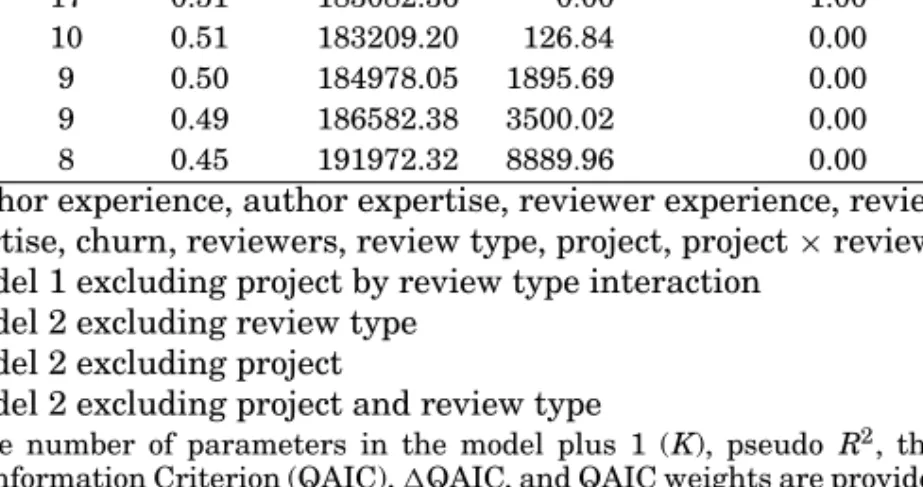
Note: The number of parameters in the model plus 1 (K), pseudo R2, the Quasi Akaike Information Criterion (QAIC), QAIC and QAIC weights are provided. For example, doubling the number of reviewers leads to a 45.6% increase in the number of topics discussed. Churn. Doubling the number of lines from 17 to 34 increases the number of issues discussed by 12%.
The level of review participation has the greatest impact on the number of topics discussed. Note: The percentage difference in the number of topics discussed is calculated for each project and review type with respect to Apache RTC. Within all projects, the number of topics discussed during CTR is less than during RTC.
DISCUSSION
Comparison with Inspection
Much of the work on inspection processes has made minor changes to Fagan's process (e.g., [Martin and Tsai 1990; Knight and Myers 1993]), but kept much of the formality, measurability, and rigor intact. [Kollanus and Koskinen 2009; Laitenberger and DeBaud 2000; Wiegers 2001]. Not only were some additional defects found during synchronous meetings, but the scheduling of these meetings accounted for 20% of the inspection interval. This mindset has the effect of limiting the group's ability to collectively problem solve and mentor the author of an artifact [Sauer et al.
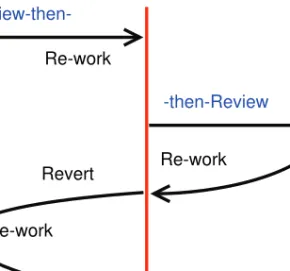
In an OSS review, the author, reviewers, and other interested parties freely discuss the best solution, but not the existence of bugs—there are cases where the reviewer rewrites the code, and the author now learns from the new code and becomes a reviewer of the new code. However, depending on the broadcast mechanism used to disseminate papers and review discussions, there is the possibility of involving a larger number of reviewers if the complexity of the paper warrants it. While OSS review practices have evolved organically to meet the needs of the development team, they reflect the finding of Porter et al.—OSS review has a minimal process but relies heavily on self-selected experts.
Limitations and Validity
Parnas and Weiss suggested active assessments that increased the quality of inspections by involving inspectors more in the assessment. Third, many systems and subsystems involve multiple co-developers who already understand the system and only need to "learn" the change to the artifact being assessed. Furthermore, many of the review discussions quickly became abstract discussions rather than focusing on code [Rigby and Storey 2011].
Internal validity. The descriptive statistics we collected clearly show that the OSS review is drastically different from traditional inspection processes. Our efficiency model explained 29% of the variance, which is consistent with other inspection efficiency models [Porter et al. Due to the extremely large number of revisions, it is difficult to eliminate the large number of possible changes.
Concluding Remarks
Peer review practices that are conducted asynchronously, empower experts, provide timely feedback on small changes, and allow developers to focus on their area of expertise are more efficient than formal peer review techniques and still able to detect problems . These changes may result in industry developers viewing peer review more favorably. We are working with the Canadian Department of Defense to develop peer review practices that are lightweight while still maintaining a high degree of traceability and quality assurance.
From an enterprise-based to a community-based model of knowledge creation: the case of Linux kernel development.Org.