6 the situation review (Part 1)
The strategic marketing planning process for services
1. Mission
2. Corporate objectives 3. Marketing audit
4. SWOT analyses 5. Key assumptions
6. Marketing objectives and strategies 7. Estimate expected results
8. Identify alternative plans and mixes 9. Budget
10. 1st-year detailed implementation programme Phase One
Goal setting
Phase Two Situation review
Phase Three Strategy formulation
Phase Four
Resource allocation and monitoring Measurement
and review The Strategic Plan (Output of the planning process) Mission statement
Financial summary Market overview SWOT analyses Portfolio summary Assumptions
Marketing objectives and strategies Three-year forecasts and budgets
Once again, we should like to emphasize the difference between theprocessof strategic marketing planning described here and the output of this process, the strategic marketing plan. What should appear in the written output of the strate- gic marketing planning process was shown in Figure 4.5 in Chapter 4. In the figure above, we have added a box in the top right-hand corner to emphasize the difference between the process and the output, i.e. the strategic marketing plan.
In this chapter, we will consider in some detail the component steps of Phase Two of the marketing planning process – the situation review. We will look at ways of tackling each of these process steps. In particular, this chapter focuses on market seg- mentation while Chapter 7 (Part 2) focuses on other tools such as positioning, lifecycle analysis and portfolio management that service companies can use in their situation review.
Once again, we must stress that, for the purposes of clarity, we deal with each of the steps in Phase Two in a linear sequence. In reality, they are highly interactive and far less obvious as ‘stand-alone’ activities.
While the purpose of the previous chapter, the corporate strategic context, was to provide marketing planning with a sense of strategic direction, the situation review is concerned with evaluating the future prospects of the service enterprise. Depending upon the outcome, the company may be well placed to face the future, or, alternatively, it might be found to be lacking in certain areas. Another possibility is that, because of the current circumstances facing the organization, the original corporate objectives of the plan may have to be modified considerably.
The first step of the situation review phase, the marketing audit, provides the information which shapes the subsequent elements of the planning process.
Step 3 The marketing audit
A marketing audit provides the means to enable the service organiza- tion to understand how it relates to the environment in which it oper- ates. It also enables internal strengths and weaknesses to be identified in terms of how they match external opportunities and threats. The audit should be a systematic, critical and unbiased review and appraisal of the company’s marketing operations. Thus, it provides management with the information to select a position in its particular environment based on known facts. In short, it provides the answer to the question: ‘Where is the company now?’
It needs to be stressed here that the marketing audit is an essential part of the strategic marketing planning process and that the results of the marketing audit constitute a separate document.
The marketing audit itself is not a marketing plan and only some of the details contained in it should appear in the plan itself. We recommend Service
organizations need to evaluate their future prospects
The marketing audit should be kept separate from the marketing plan
their area of responsibility and that this should be a required activity.
By carrying out an audit on a regular basis, e.g. once a year (rather than just at those times when things go wrong), management is more likely to recognize trends and spot underlying problems of a fundamental nature.
This means that, instead of responding to symptoms, managers, in fact, address the root causes of organizational and marketing problems.
Such is the complexity of operating in rapidly changing market conditions that it makes good sense to carry out a thorough situation analysis at least once a year at the beginning of the planning cycle.
Indeed, in many leading organizations, a marketing audit is arequired activity, which has an equivalent status to a financial audit.
Who should do it?
Sometimes, outside consultants are hired to undertake this task. Experi- enced though they may be, the cost of using them can be high. Also, it must be asked if they will really have access to all the information which is ‘stored’ in an informal way by managers within the organization. It is a formidable task for an outsider to win the confidence of all the staff and uncover much of the anecdotal evidence well known to insiders.
Generally speaking, a better solution to the question of who does the audit is to get managers themselves to undertake the analysis within their own areas of responsibility. Where necessary this can be supple- mented by the selective use of consultants. This approach has several benefits to commend it:
The company’s own expertise can be tapped and exploited. Managers become involved and, therefore, more commit- ted to marketing planning. The discipline brought by the analytical process helps to avoid tunnel vision by forcing managers to focus on their total environment on a regular basis. Developing a critical appraisal faculty in managers helps them in their personal growth and development. Consultants’ fees are minimized.Often, however, the organization’s response to the suggestion that their own managers conduct the audit centres on problems of finding
the time and not being sufficiently objective. Naturally, time commit- ment will always be a critical issue.
Nevertheless, managers ought to find time to stop and ana- lyse the broader issues surrounding their sphere of activity.
Not only does this help the organization, but having this wider vision aids personal performance.
The objection about lack of objectivity can be helped by providing training for the managers, and providing them with easy-to-under- stand documentation which augments the formal planning approach.
What needs to be covered?
It would be impossible in a book of this length to be able to explain all the possible areas of the marketing audit in specific terms because, undoubtedly, there will be some activities of concern to only a few specialized service companies. However, regardless of their size, or the nature of their business, most companies find that there are certain key determinants to their business. It is on these that we shall focus.
(We shall provide some references later in this chapter for those want- ing to explore this area in further detail.)
Figure 6.1
The constituent parts of the marketing audit
Internal
Marketing audit Sub-audit 5
Sub-audit 4 Services/
products
Sub-audit 2
Competition
Business environment
Sub-audit 3 External
Sub-audit 1 Customers and markets
(market segmentation)
Internal External
Organization
interrelating sub-audits, which focus on different aspects of the busi- ness, as shown in Figure 6.1. This figure also shows that the marketing audit draws information from outside the company, via the customer, competition and environmental audits, and from inside the company, by auditing the organization and the services it offers.
Let us now consider each of these sub-audit areas in turn.
Sub-audit 1 Customers and markets
Since the whole purpose of marketing planning is to alert and gear the service organization to market opportunities, the customer and market audit is concerned essentially with analysing trends in these areas, both favourable and unfavourable.
By understanding in depth what is happening to its customers and markets, the company can select those opportunities which offer the best prospects for long-term success.
As the risk of failure is too high to rely on subjective opinion and intui- tion, the company must be led by accurate, fact-based information.
Market segmentation
In this chapter, a number of diagnostic tools will be introduced. One of the key diagnostic tools of marketing ismarket segmentation; this is a particularly relevant tool to use during the audit process when analy- sing customers and markets.
The audit process enables the existing methods of segmentation to be reappraised. Sometimes, it can be found that there are more advanta- geous ways to consider customers when seeking to establish a compet- itive advantage.
The segmentation process is concerned with dividing a heter- ogeneous market into specific homogeneous groups. Theseg- ments thus identified can then be targeted with specific services and a distinctive marketing mix. The output of this process is a number of segments.
The market segmentation process
Introduction (For readers who want a detailed step-by-step process for doing segmentation, see McDonald and Dunbar (2010)1.)
Definition:
A market segment consists of a group of customers within a market who share a similar level of interest in the same, or comparable, set of needs.
It has become clear after at least 70 years of formalized marketing that market definition and segmentation are the very core of the discipline.
Even the famous PIMS database2 recognizes that the term ‘market share’ has to be carefully defined.
How to measure market share has always been at the centre of contro- versy in discussions of success or failure. Defining a market too broadly or too narrowly can both lead to meaningless statistics.
The remainder of this chapter deals in detail with these problems.
While this is not the place to spell out the academic history of market segmentation, it is so crucial to the success of marketing planning that at least a brief commentary is called for. One of the authors of this chapter did a catholic review of scholarly research into the history of market segmentation (Jenkins and McDonald, 1997)3in which 36 refer- ences were cited. However, due to scale constraints here is a very brief summary of this research.
The father of market segmentation is widely considered to be Wendell Smith (1956)4who prepared market segmentation as an alternative to product differentiation. Yet it wasn’t until Wind’s (1978)5review of the state of market segmentation that the topic went to the top of the agenda of researchers and practitioners. His plea was for new segmen- tation bases, data analysis techniques and for generally putting market segmentation at the heart of strategic decision-making.
In 2009, a whole issue of the Journal of Marketing Management was devoted to market segmentation and for those readers wanting an updated literature review, see Bailey (2009)6in that issue. They confirm that most of the work over the intervening years has been primarily around what segmentation bases to use, such as size of purchase, customer characteristics, product attributes, benefits sought, service quality, buying behaviour and, more recently, propensity to switch suppliers, with much of this work being biased towards fast moving consumer goods rather than to business to business and services.
In 2002 Coviello7and a host of others, with the advent of relationship marketing and customer relationship management, proposed one-to- one as a successor to market segmentation, although Wilson (2002)8 found that most CRM projects fail because of poor segmentation.
Rigby (2002)9 summed this up succinctly by saying that trying to implement CRM without segmentation is like ‘trying to build a house without engineering measures or an architecture plan’.
Given the amount of academic scholarships and attempts at imple- mentation in the world of practice over the 54 years since Wendell Smith first raised the consciousness of the community to the impor- tance of market segmentation, it is surprising that so little progress has been made. In 2006, Christensen10, in the Harvard Business Review found that of 30,000 new products launched in the USA, 85% failed
also reported the widespread failure of segmentation initiatives. This matches the author’s own research over a 35-year period. His analysis of 3,000 marketing plans revealed that only 300 contained proper needs-based segmentation – i.e. 90% didn’t.
One of the authors of this chapter, having been marketing director of a major fast moving consumer goods company and having worked on practical segmentation with senior teams from leading global multina- tionals down to SMEs for 35 years, finds much of the academic debate referred to above somewhat arrogant and inward-looking.
The justification for saying this is that anyone who says ‘we segment markets by . . .’ is totally missing the point. Any market, once correctly defined in terms of needs rather than products, consists of 100% of what is bought, how it is used and why it is bought and used in these ways. The role of any supplier is to understand these behavioural pat- terns and to discover their rationale, rather than trying to impose some predetermined segmentation methodology onto the market.
Readers who wish to are referred to theJournal of Marketing Manage- ment, Volume 25, nos 3–4, 2010, which is devoted to bridging the seg- mentation theory/practice divide.
The purpose here is to spell out proven methodologies for market defi- nition and market segmentation developed over a 20-year period of research at Cranfield School of Management. During this period, a link between shareholder value creation and excellent marketing is shown in the left-hand column of Table 6.1.
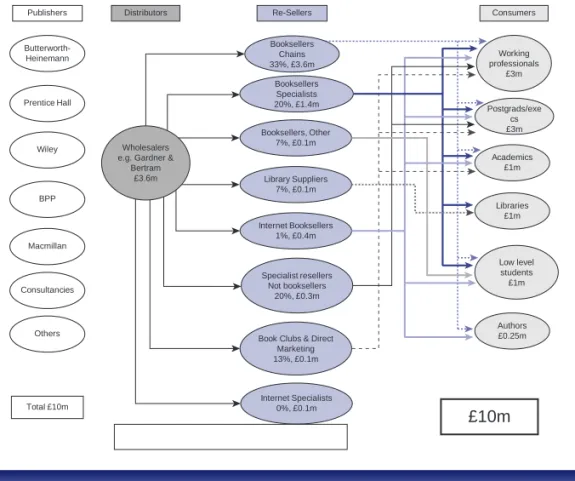
Market definition Companies frequently confuse target markets with products – pensions or mainframe computers, for example – this, coupled with a lack of knowledge about the sources of differential advantage against each segment, signals trouble. Figure 6.2 shows the first attempt at a market map by a publisher of marketing books.
Figure 6.3 shows their second attempt when, instead of defining their market as ‘books’, they defined their market as the promulgation of marketing knowledge. This led to a whole new corporate strategy.
Excellent strategies Weak strategies
Target needs-based segments Target product categories Make a specific offer to each
segment
Make similar offers to all segments
Leverage their strengths and minimize their weaknesses
Have little understanding of their strengths and weaknesses Anticipate the future Plan using historical data
Table 6.1
The link between excellent and weak strategies
Definition:
A market is the aggregation of all the products or services which customers regard as being capable of satisfying the same need. (Malcolm McDonald and Ian Dunbar.
Market Segmentation.
Goodfellow Publishing, Oxford, 2010.)
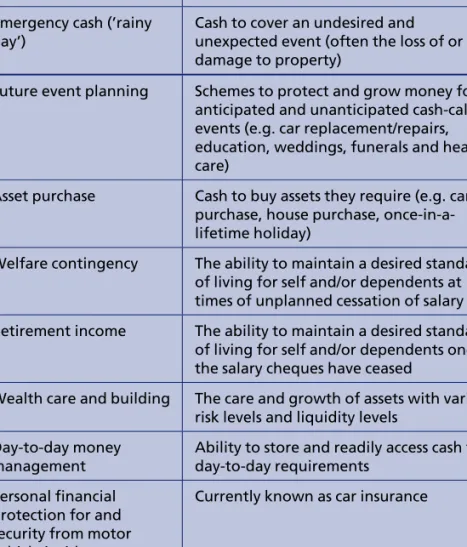
Table 6.2 is an example from financial services.
Having established changes/developments in products and channels by defining markets in terms of needs, it is still necessary to draw a market map for your major products and services. A method for doing this is now explained.
Many companies pride themselves on their market segmentation even though these so-called ‘segments’ are in factsectors, which is a com- mon misconception. Everyone with a marketing qualification knows that a segment is a group of customers with the same or similar needs and that there are many different purchase combinations within and across sectors.
But the gravest mistake of all is a priori segmentation. Most books incorrectly state that there are several bases for segmentation, such as socio-economics, demographics, geo-demographics and the like. But this misses the point totally. For example, Boy George and the Arch- bishop of Canterbury are both As, but they don’t behave the same! Nor do all 18- to 24-year-old women behave the same (demographics)!
Nor does everyone in my street (geo-demographics) behave the same!
Publishers
Butterworth- Heinemann
Others BPP Wiley Prentice Hall
Macmillan
Consultancies
Wholesalers e.g. Gardner &
Bertram
£3.6m
Total £10m
Distributors Re-Sellers Consumers
Booksellers Chains 33%, £3.6m
Booksellers, Other 7%, £0.1m Booksellers Specialists 20%, £1.4m
Library Suppliers 7%, £0.1m
Internet Booksellers 1%, £0.4m
Specialist resellers Not booksellers
20%, £0.3m
Book Clubs & Direct Marketing 13%, £0.1m
Internet Specialists 0%, £0.1m
Working professionals
£3m
Academics
£1m Postgrads/exe
cs
£3m
Libraries
£1m
Low level students
£1m
Authors
£0.25m
£10m
Figure 6.2 Original market map for marketing books market
All goods and services are made, distributed and used and the pur- chase combinations that result make up anactualmarket, so the task is to understand market structure, how the market works and what these different purchase combinations (segments) are.
Market mapping A useful way of identifying where decisions are made about competing products and services and, therefore, those who then proceed to the next stages of segmentation is to start by drawing a‘market map’.
An example of a generic market map is given in Figure 6.4.
It is useful to start your market map by plotting the various stages that occur along the distribution and value added chain between the final users and all the suppliers of products or services competing with each other in the defined market. At the same time, indicate the particular routes to market the products are sourced through, as not all of them will necessarily involve all of these stages.
Note at each junction on your market map, if applicable, all the differ- ent types of companies/customers that are found there.
Knowledge Creation/
Authoring
Selection Packaging Distribution Consumers Needs
Business Schools
Research Institutes
Journalists
Consultants
Professionals
Book publishers
S/W package houses
e.g. MPC
Journal/Magazine Publishers eg HBR
Conference/report specialists e.g. SI
FT knowledge
Portals General business
Direct purchase
online Online bookstore
Online content databases e.g. FT profile
E-colleges
Working professionals
Postgrads/
execs
Academics
Libraries
Low level students
Authors
Corporate Trainers
Basic Business Education Job skills development
e.g. MBA Small skills e.g. short
cases Up-to-date
books
Publicity Recognition
Basic Business Education
Small skills e.g.
presentation
Figure 6.3 Market map of the marketing knowledge promulgation market
Definition:
Amarket mapdefines the distribution and value added chain between final users and suppliers of the products or services included within the scope of your segmenta- tion project. This should take into account the various buy- ing mechanisms found in your market, including the part played by ‘influencers’.
A couple of examples are given as Figures 6.4 and 6.5. The airline map is then broken down into more detail in Figure 6.6. The point of this is to understand the leverage (decision) points in the market, for it is here that market segmentation will take place. These leverage points are where most of the major decisions are made about what is bought.
What causes markets to segment? Here, let us introduce the key con- cept of market segmentation and why it happens. Clearly, in the early days, markets will tend to be homogeneous. But, as demand grows rap- idly with the entry of the early majority, it is common for new entrants to offer variations on the early models, as we have just explained, and consumers now have a choice. In order to explain this more clearly, let us illustrate the approximate shape of markets. If we were to plot the car market in terms of speed and price, we would see very small, inexpensive cars in the bottom left-hand corner (see Figure 6.7). In the top right, we would see very fast, expensive cars. Most cars, however, would cluster in the middle, what we might call: ‘The Mr and Mrs aver- age market.’
Table 6.2 Some market
definitions (personal market)
Market Need (online)
Emergency cash (’rainy day’)
Cash to cover an undesired and unexpected event (often the loss of or damage to property)
Future event planning Schemes to protect and grow money for anticipated and unanticipated cash-calling events (e.g. car replacement/repairs, education, weddings, funerals and health care)
Asset purchase Cash to buy assets they require (e.g. car purchase, house purchase, once-in-a- lifetime holiday)
Welfare contingency The ability to maintain a desired standard of living for self and/or dependents at times of unplanned cessation of salary Retirement income The ability to maintain a desired standard
of living for self and/or dependents once the salary cheques have ceased
Wealth care and building The care and growth of assets with various risk levels and liquidity levels
Day-to-day money management
Ability to store and readily access cash for day-to-day requirements
Personal financial protection for and security from motor vehicle incidents
Currently known as car insurance
Likewise, the lawn mower market would look very similar (see Figure 6.8). With lawn size on the vertical axis and price on the horizon- tal axis, at the bottom left would be small, inexpensive, hand-pushed mowers, with expensive sit-on machines for large estates in the right- hand corner. That leaves the mass of the market with average size lawns, and average-sized lawn mowers, which is where the mass market is.
N National Builders N Local
Builders N Private
Companies
N Local Government Users
N Domestic Users N
Contractors N Local
Distributors N Regional
Distributors N National
Distributors
N Other Retailers
N Spcist.
Retailers
N Detp.
Retailers
N Sheds UK Sales
vol/
val %
vol/
val % vol/val %
vol/val
%
vol/val
% vol/val
%
vol/val % vol/val %
vol/val % vol/val %
vol/val % vol/val % vol/val %
vol/val
% vol/
val % vol/
val % vol/
val % vol/val %
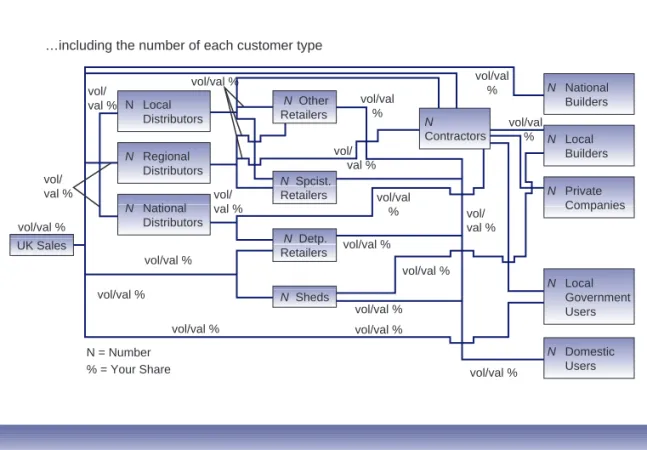
vol/val % N = Number
% = Your Share
…including the number of each customer type
Figure 6.4 Market mapping
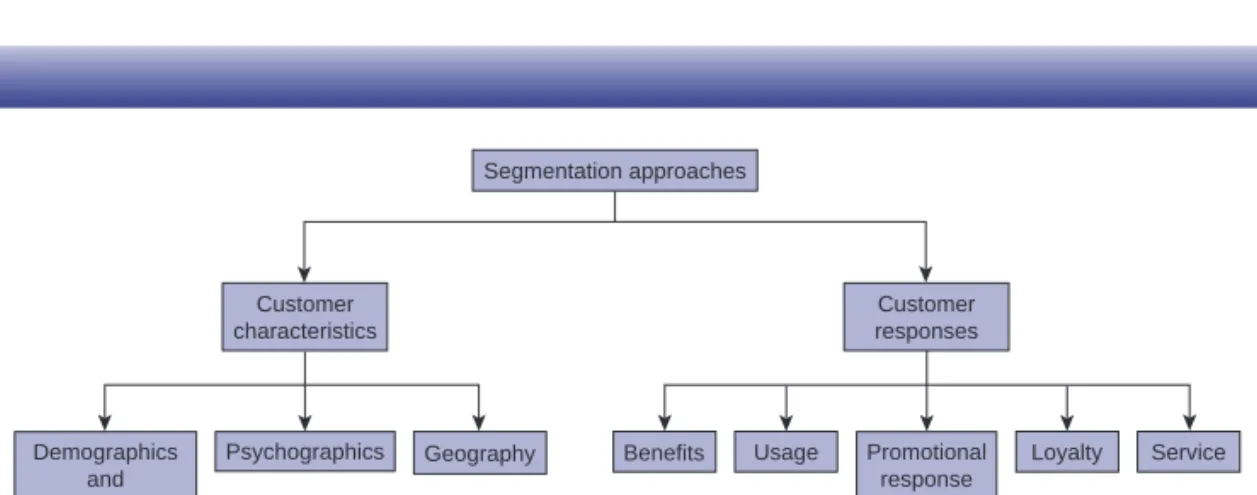
Segmentation approaches
Customer characteristics
Demographics and socioeconomics
Psychographics Promotional
response Benefits
Geography Usage Loyalty Service
Customer responses
Figure 6.5 Major approaches to services market segmentation
We can now redraw this to represent the shape of any market, particu- larly at the early growth stage (the shape on the left in Figure 6.9). But when rapid growth begins, new entrants join the market and offer variations on standard products in order to attract sales, and it is at
Mass marketing
Vendor
Key focus:
Market segment: One segment – homogeneous market
Segments based on demographics, etc.
Segments based on psychographics, lifestyles, etc.
Offerings modified to segment
Integrated offerings to segment needs
Integrated offerings to micro-segment needs Narrowly defined, high value segments
Tailored messages
Tailored messages
Highly tailored messages Segment share Segment share Segment
share One standard
offering
Broadcast marketing Market share Product /service
offering:
Communication:
Measure of success:
Product Segment Segment Micro-segment Customer
Segment of one
Dialogue marketing Share of customer Mass- customization Relationship with customer Partner Traditional
segmentation
Needs-based segmentation
Micro- segmentation
One-to-one marketing
Figure 6.6 Levels of segmentation emphasis
Figure 6.7
Illustration of the shape of the car market
low high
low high
Price
Speed
this stage that markets begin to break into smaller groups, while still growing overall (this is represented by the shape in the middle). Even- tually, when markets mature, and there is more supply than demand, any market growth tends to come in the lower price end of the market, while the top end of the market tends to be immune (this is repre- sented by the shape on the right). It is usually the middle market that suffers at this stage, with many competitors vying with each other on price. This, however, is the whole point of market segmentation, for competing only on price is to assume that this is the main requirement of customers, whereas the truth is that this is rarely the case. It is just that a general lack of understanding about market segmentation on the part of suppliers about the real needs of customers in mature markets forces them to trade on price, so encouraging the market to become a commodity market.
Middle Middle
Middle
low low low
high
high
high
Figure 6.9
The shape of markets from birth to maturity
low high
low high
Price
Lawn Size
Figure 6.8
Illustration of the shape of the lawn mower market
It is not widely known that price is rarely the decisive factor in most buying situations. It is certainly the experience of the authors over many years of working on every continent of the world that price accounts for less than 10% of all decisions. The following is a quote from an IPA report (Advertising in a downturn, March 2008, page 5):
‘The average proportion of consumers who were motivated by price was around ten per cent and even if this increased during a downturn, the proportion would remain small.’
Let us summarize all of this by showing a product lifecycle representa- tion with some generalizations about how marketing strategies change over time. See Figure 6.10 (product lifecycles are explained in more detail in the next chapter). From this, which we suggest you study carefully, you will see at least four major changes that occur over the lifecycle. At the top of the far right-hand column, you will see the word ‘commodity’, but the point we want to make is that this is by no means inevitable, and only occurs in markets where the sup- pliers do not understand the power of market segmentation, as in the case histories provided at the end of this chapter. There are other options, of course, including the option to get out of mature markets.
Another is to move the goalposts as it were, somewhat in the manner of First Direct, Direct Line, Michael Dell, Virgin, Amazon.com, and
Key Characteristics
Marketing Message Sales Distribution
Price Competitive
Intensity Costs Profit Management
Style
Unique Explain Pioneering Direct Selling
Very High None Very High Medium/High
Visionary
Service Differentiation Brand Values
Relationship Based Mass Distribution
Medium Many Medium/Low Medium/High Operational Product
Differentiation Competitive Relative Benefits Distribution Support
Exclusive Distribution
High Few Medium
High Strategic
‘Commodity’
Corporate Availability
Based 80 : 20 Low (Consumer
Controlled) Fewer, bigger
International Very low Medium/low
Cost Management
Figure 6.10 The product/market lifecycle and market characteristics
ever, is market segmentation, which in our view should be the very first consideration as markets begin to mature.
Market segmentation – how to do it We can now begin to concen- trate on a methodology for making market segmentation a reality, market segmentation being the means by which any company seeks to gain a differential advantage over its competitors.
Markets usually fall into natural groups, or segments, which contain customers who exhibit a similar level of interest in the same broad requirements.
These segments form separate markets in themselves and can often be of considerable size. Taken to its extreme, each individual consumer is a unique market segment, for all people are different in their require- ments. While CRM systems have made it possible to engage in one-to- one communications, this is not viable in most organizations unless the appropriate organizational economies of scale have been obtained at a higher level of aggregation such as at segment level. Consequently, products are made to appeal to groups of customers who share approx- imately the same needs.
It is not surprising, then, to hear that there are certain universally accepted criteria concerning what constitutes a viable market segment:
Segments should be of an adequate size to provide the company with the desired return for its effort. Members of each segment should have a high degree of similarity in their requirements, yet be distinct from the rest of the market. Criteria for describing segments must enable the company to com- municate effectively with them.While many of these criteria are obvious when we consider them, in practice market segmentation is one of the most difficult of marketing concepts to turn into a reality. Yet we must succeed, otherwise we become just another company selling what are called ‘me-too’ prod- ucts. In other words, what we offer the potential customer is very much the same as what any other company offers and, in such circum- stances, it is likely to be the lowest priced article that is bought. This can be ruinous to our profits, unless we happen to have lower costs, hence higher margins, than our competitors.
There are basically three stages to market segmentation, all of which have to be completed (see Figure 6.11).
We have already explained about market definition and market map- ping (Step 1).
This first stage should have established the scope of the project by spec- ifying the geographic area to be covered and defining the ‘market’
which is to be segmented, followed by taking a detailed look at the way this market operates and identifying where decisions are made about the competing products or services. Successful segmentation is based on a detailed understanding of decision-makers and their requirements.
The second stage is essentially a manifestation of the way customers actually behave in the market place and consists of answering the question: ‘Who is specifying what?’
The third stage looks at the reasons behind the behaviour of customers in the market place and answers the question ‘Why?’ and then searches for market segments based on this analysis of needs.
The following sections provide an overview of the steps required to complete stages 2 and 3. We can now turn to the process again, and move to steps 3, 4 and 5, although it must be pointed out that segmenta- tion can and should be carried out at all major junctions on the market map, not just at the final user junction.
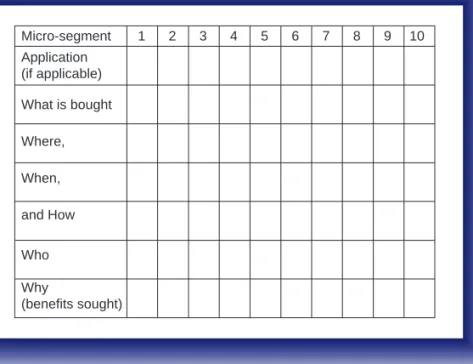
Essentially, these time-consuming steps involve listing all purchase combinations that take place in the market, including different appli- cations for the product or service. See Figure 6.12, principal forms such as size, colour, branded, unbranded, etc., the principal channels used, when – such as once a year, weekly, etc. – how – such as cash or credit. Next it is important to describe who behaves in each particular way using relevant descriptors such as demographics. For business-to- business purchases this might be standard industrial classifications, size of firm, etc., whereas for consumer purchases this might be socio- economic groups such as A, B, C1, C2, D and E or stage in the lifecycle, or age, sex, geography, lifestyles or psychographics. Finally, and most difficult of all, each purchase combination has to have a brief explana- tion of the reason for this particular type of behaviour. In other words, we need to list the benefits sought, and it is often at this stage that an organization needs to pause and either commission market research or Figure 6.11
The three stages of market segmentation
1. Defining the market 2. Market mapping
3. Who specifies what 4. Why
5. Forming segments Stage One
Your market and how it works
Stage Three
Segmenting the market Stage Two
Decision-makers and transactions
refer to its extant database of previous market research studies.
Although in the figure shown there are only 10 micro-segments, it is normal in most markets for companies to identify between 30 and 50 micro-segments. Remember, these micro-segments are actual pur- chase combinations that take place in a market.
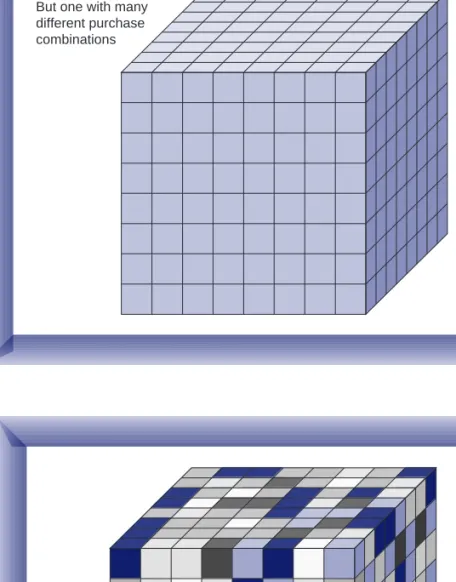
To summarize, it is clear that no market is totally homogeneous (see Figure 6.13).
The reality is that actual markets consist of a large number of different purchase combinations (see Figure 6.14).
However, as it is impracticable to deal with more than between 7 and 10 market segments, a process has to be found to bring together or cluster all those micro-segments that share similar or approximately similar needs (see Figure 6.15).
Once the basic work has been done, in describing micro-segments, that is steps 2, 3, 4 and 5, any good statistical computer program can carry out cluster analysis to arrive at a smaller number of segments.
The final step consists of checking whether the resulting segments are big enough to justify separate treatment, are indeed sufficiently differ- ent from other segments, and whether they have been described suffi- ciently well to enable the customers in them to be reached by means of the organization’s communication methods. In addition, the company has to be prepared to make the necessary changes to meet the needs of the identified segments.
Micro-segment 1 2 3 4 5 6 7 8 9 10
Application (if applicable) What is bought Where, When, and How Who Why
(benefits sought)
Figure 6.12 Micro-segments
Table 6.3 is a summary of what we have discussed so far. It is obvious that there will be very few markets in the world where all customers have the same needs. Also, once market segmentation has been carried out, positioning products and services to meet the different needs of the different segments is comparatively easy. The difficult bit is Figure 6.13
An undifferentiated market
But one with many different purchase combinations
Figure 6.14
Different needs in a market
segmenting markets. The third point is that it is vital to focus on serving the needs of the identified segments, while it is dangerous to straddle different segments with the same offer. This point is made clear in the case histories at the end of this chapter.
The process of market segmentation itself consists of five steps: One, understand how your market works. This involves defining the market and drawing a market map. Two, list what is bought, including where, when, how, and the different applications of the product or service.
Three, list who buys using descriptors such as demographics and
Figure 6.15
Segments in a market
Not all customers in a broadly-defined market have the same needs Positioning is easy. Market segmentation is difficult. Positioning problems stem from poor segmentation. Select a segment and serve it. Do not straddle segments and sit between them.1. Define the market to be segmented and size it (market scope) 2. Determine how the market works and identify who makes the
decisions (market mapping)
3. Develop a representative sample of decision-makers based on differences they see as key (including what, where, when and how), note who they are (demographics) and size them
4. Understand their real needs (why they buy, the benefits sought) 5. Search for groups with similar needs
Table 6.3
Understand market segmentation
psychographics. Four, list why they buy, especially the benefits sought.
Five, finally, search for groups with similar needs. These will be the final market segments.
Market structure and market segmentation are the heart and soul of marketing. (See Figure 6.16.) Unless an organization spends time on it, driven from the board downwards, it is virtually impossible for it to be market driven, and in any organization that isn’t market driven, the marketing function will be ineffective, or at best will spend its time trying to promote and sell product or services that are inappropriate for the market. We will leave you with this figure for you to study. It describes in more detail each of the important steps in the market segmentation process.
There follows a quick segmentation exercise (thanks to Dr Brian Smith12 of Pragmedic and a Visiting Fellow at the Open University Business School). This will quickly produce a very rough segmentation of your market, but it is no substitute for the proper, more detailed and accurate process described above, as the results will only ever be approximate.
Quick market segmentation solution
Write downthe mainbenefits sought by customers. Hygiene factors are benefits that any product or service must have to be acceptable in the market. Try to ignore these. Motivators are those benefits that contribute towards the customer’s decision about which product to buy. Take the ‘motivators’ and choose the two main ones. Draw two straight horizontal lines and make an estimate of the per- centage of customers at each end. So, for example, if service level is a key motivator of what is bought. See below.40% 60%
Low service High service
Likewise, if the breadth of the product range is a key motivator of what is bought, see below:
40% 60%
low product range high product range
Take the left hand point of the first horizontal line and drag it over the second horizontal line to make cross as shown.
Starting at the top, and moving in a clockwise direction, multiply 60% by 60% to give 36% (see first circle). Then multiply 60% by 40% to give 24% (see second circle). Then multiply 40% (the bottom of the vertical axis) by 40% to give 16% (see third circle).Market mappingWho buys 1. 2.
Who buys what* 1. 2. 3.
What* is bought 1. 2.
1. 2. 3.
Market definition - ‘A customer need that can be satisfied by the products or services seen as alternatives’. It is based around what the customers perceive as distinct activities or needs they have which different customers could be satisfying by using alternative products or services. The distribution and value added chain that exists for the defined market. The decision makers in that market and the amount of product or service they are responsible for in their decision making.
Recording information about the decision makers in terms of who they are - Customer Profiling. Demographics, geographics etc. Testing a current segmentation hypothesis to see if it stacks up - Preliminary Segments.
Building a customer ‘model’ of the market - based on either the different combinations of KDFs customers are known to put together, or derived from the random sample in a research project. Can be constructed by Preliminary Segment. Each customer in the model(sample) is called a micro-segment. Each micro-segment is profiled using information from the data listed in ‘Who buys’. Each micro-segment is sized to reflect the value or volume they represent in the market.
Listing the features customers look for in their purchase - what, where, when and how. Focusing in onto those features customers use to select between the alternative offers available - Key Discriminating Features KDFs. Segment checklist 1. 2. 3. 4.
Is each cluster big enough to justify a distinct marketing strategy? Is the offer required by each cluster sufficiently different? Is it clear which customers appear in each cluster? If all ‘yes’, clusters = segments. Will the company change and adopt a segment focus?
Forming segments 1. 2. 3.
By attributing a ‘score’ to all the CPIs for each micro-segment, the similarity between micro-segments can be determined. Micro-segments with similar requirements are brought together to form clusters Clusters are sized by adding the volumes or values represented by each micro-segment.
Why 1. 2. 3.
As customers only seek out features regarded as key because of the benefit(s) these features are seen to offer them, the benefits delivered by each KDF should be listed. For some customers it is only by combining certain KDFs that they attain the benefit(s) they seek - benefits should also be looked at from this perspective. These benefits are Critical Purchase Influences CPIs. For thoroughness, benefits can be looked at from the perspective of each Preliminary Segment. Once the CPIs for the market have been developed their relative importance to each micro-segment is addressed (by distributing 100 points between the CPIs). Figure6.16Themarketsegmentationprocess–summary
Interpretation
The first segment (36%), the biggest segment, requires both high service and a large product range. The second segment (24%) prefers a large product range and is less interested in service. The third segment (16%) doesn’t care much about either a large product range or service. The fourth segment (24%) prefers good service and is less interested in a large product range. Although not essential, you might consider giving each segment a name.Action Ensure your ‘offer’ including the product, price, service and promotion reflects the differing needs of each segment.
Example An example of segmentation of the A4 copier paper market follows. Please note that, if as in the case of the A4 paper market, there is one very large segment I (in this case 56%), the exercise can be repeated for just this large segment, resulting in seven segments in total.
24 36
16 24
40% 60%
Small product range
Large product range 60% high
Service
40% low service
bility of products; service levels.
Product fit for purpose– High-quality print finish for colour copiers;consistency of quality; paper that doesn’t screw up in the machine;
print definition, no waste.
Environmental factors– Recyclable. Level of support– Delivered in small lots; consignment stock; easy ordering (online); delivered to difficult locations.Level of support (less demanding)
% 0 8
% 0 2
High (want lots of support) Low
Breadth of product range
(buy a narrow range but big quantities)
% 0 3
% 0 7
High (buy a broad range)
Low 80% (high support
requirements)
Prima donnas (expect to have their every whim catered for)
30% (broad product range required)
20% (low support requirement) 56%
(narrow product range required)
Easily satisfied (paper is not key to their business – just want reliable supply)
6%
24%
Drag Queens
Dictators
(know their power as large volume users) 14%
70%
Looking to the future One final, but crucial, step remains in this part of the marketing audit.
The essence of this stage is to revisit the market map, and consider in what ways it might be affected by e-commerce. Reconfiguring the mar- ket map involves examining the current market map, and redrawing it to take account of various anticipated effects of e-commerce. The resulting vision of how the industry could change as a result of e-com- merce presents the organization with choices as to how to position itself in the future industry structure and how to manage the transition period. Here is a list of options based on our research of how the mar- ket map might be reconfigured.
1. Disintermediation– As with other IT-enabled channels such as call centres, e-commerce can enable a link to be removed from the mar- ket map, by removing intermediaries whose primary function of
information transfer can be more effectively performed using the internet. An example is the direct sales of greetings cards to the pub- lic being trialled by a card publisher, thereby bypassing the retailer.
2. Partial channel substitution – This forms a halfway house towards disintermediation, in which an intermediary’s role is reduced but not eliminated, through some of its value being provided remotely by the supplier to the intermediary’s customer. This is the model adopted by a card manufacturer in its relationship with retailers, where its website is supplementing its agent network rather than replacing it. Similarly, a drinks manufacturer is using data gleaned from its information exchange with distributors to promote directly to retailers, providing ‘pull-through’ demand which the distribu- tors perceive as of mutual benefit.
3. Reintermediation – In some cases, a previous intermediary is replaced by a new online intermediary, rather than bypassed, or an intermediary appears between two types of organization which previously dealt with each other directly. At the time of writing, a groceries’ manufacturer is having to define its strategy with respect to the various business-to- business exchanges, or e-hubs, which are appearing in its industry to link retailers to manufacturers. Simi- larly, the health portals such as Healtheon are forming influential intermediaries between manufacturers of drinks products with a health claim and the consumer.
Why market segmentation is vital in marketing planning In today’s highly competitive world, few companies can afford to compete only on price, for the product has not yet been sold that someone, some- where, cannot sell cheaper – apart from which, in many markets it is rarely the cheapest product that succeeds anyway. What this means is that we have to find some way of differentiating ourselves from the competition, and the answer lies in market segmentation.
The truth is that very few companies can afford to be ‘all things to all people’. The main aim of market segmentation as part of the planning process is to enable a firm to target its effort on the most promising opportunities. But what is an opportunity for firm A is not necessarily an opportunity for firm B, depending on its strengths and weaknesses.
The whole point of segmentation is that a company must either:
Define its markets broadly enough to ensure that its costs for key activities are competitive; or define its markets in such a way that it can develop specialized skills in serving them to overcome a relative cost disadvantage.
Both have to be related to a firm’sdistinctive competenceand to that of its competitors.
All of this should come to the fore as a result of the marketing audit referred to previously and should be summarized in SWOT analyses.
In particular, the differential benefits of a firm’s product or service should be beyond doubt to all key members of the company.
planning and all that follows in this book.
Case examples of market segmentation in the services sector
Two cases are provided. One is an excellent case history of a service organization. It demonstrates clearly how a company losing market share through lack of focus recovered to high levels of profitability, principally through excellent market segmentation. We have included a considerable amount of detail in this case so that the process of seg- mentation may be fully understood. The second is an example of an insurance company’s segmentation for annuity products.
Case study – GlobalTech
yThis case study describes the use of market segmentation to assist in the development of a service product. Customer requirements were captured via qualitative research and the seg- mentation was completed through the use of quantitative research. The result was a set of segments that enabled the development of a new approach to delivering service while improving customer satisfaction.
GlobalTechis the fictitious name of a real company marketing hi-tech and service products globally. Customers are counted in hundreds of thousands. The markets are mainly business to business with a very few large customers buying thousands of items. Service is a major revenue stream measured in billions of dollars. The lessons learnt from this case study could be of interest to any organization having to care for large numbers of customers.
Background
A failed segmentation
An internal GlobalTech team tried to complete a marketing audit in 2000. This included market definition, market segmentation and quantification. Each product division conducted their audit separately. They used mainly brainstorming techniques to define their markets and to produce the data required.
Company insight 1
Markets transcend your internally-defined product divisions. Therefore, it is best to understand the markets and monitor your overall performance in those markets. To reshape market information to meet the needs of internal reporting will lead to misinformation.
On completion, the results were compared across the divisions. It rapidly became apparent that each division addressed almost all the markets. However, the market definitions they
yTaken fromMarket Segmentation: How to do it, how to profit from it, by M. McDonald and I. Dunbar, Goodfellow Publishers, Oxford, 2010.
produced were different with significant bias to just the products they offered. Similarly, the segments each division identified were in conflict with the outputs from the other divisions.
On reflection it was agreed that the results were unreliable. They could not be used to help shape future strategies or marketing investments.
GlobalTech was now in the uncomfortable situation of being in a market information vacuum. Any confidence they had in their understanding of the market had been destroyed.
Consequently, the decision was taken that all future market analysis and understanding tasks would be supported by appropriate investments in market research.
Company insight 2
Do not rely on internally gathered opinions of your sales and marketing staffs to define markets and identify customer requirements and attitudes. Do invest in the necessary market research to provide a reliable segmentation and support for strategy and product development.
First market segmentation
The following year the segmentation was redone, supported by extensive qualitative and quantitative market research. The objective was to understand and group into segments the product buyers in the overall market.
The qualitative study produced a very clear picture and definition of the markets addressed by GlobalTech. It also provided the customers’ view of the benefits they sought from the products and the differences in their attitudes towards their suppliers. The questionnaire for the quantitative study was based on the results of the qualitative study. The result was seven clearly defined segments.
This enhanced understanding of the market, assisted the marketing of hardware and soft- ware products but did not address service products or customer satisfaction and loyalty issues.
The internal need
At the dawn of the twenty-first century the market cycle had matured. All but the more sophisticated products were perceived as ‘commodities’. Consequently, the opportunities for effective product differentiation had diminished. GlobalTech, in common with its competi- tors, was finding that customers were becoming increasingly disloyal.
For many years, product churns and upgrades from existing customers had accounted for some 70% of GlobalTech’s product revenues. Service and exhaust revenueszalmost equalled total product revenues. Service was perceived to be a key influencer of loyalty. But the costs of delivering service were becoming unacceptable to customers. Concurrently, service pric- ing was coming under increasing competitive pressures.
zExhaust revenues are those revenues that follow on, almost automatically, from an initial product sale. These would normally include service plus training, consultancy, consumables, supplies, add-ons and so on.
The challenge was to increase loyalty while achieving a step function improvement in mar- gins. Thus, it was decided to invest in a better understanding of the service market as an enabler to delivering cost-effective differentiation and loyalty.
This case history covers the project from inception to implementation.
The segmentation project Buy-in
The GlobalTech main board director responsible for customer service sponsored the project.
This was a critical prerequisite, as the outcome would have a significant impact on the orga- nization, its processes and behaviours.
Similarly, the project team included key members of service, marketing and finance to ensure buy-in. However, at that time it was deemed inappropriate to include representatives from all but two of the countries due to travel implications, costs and resource impacts. In retro- spect this was not a good decision.
Company insight 3
Try to anticipate the scale of organizational change that may result from a major segmentation project.
Then ensure the buy-in planned from the start of the project embraces all those who will eventually have a say in the final implementation.
Business objectives
The project team agreed the overall business objectives as:
1. To develop strategies for profitable increase in market share and sustainable competitive advantage in the service markets for GlobalTech’s products.
2. To identify opportunities for new service products and for improving customer satisfac- tion within the context of a robust customer needs segmentation, which can be readily applied in the market place.
3. To identify the key drivers of loyalty so that GlobalTech may take actions to increase cus- tomer loyalty significantly.
4. To provide the information required to help develop a new and innovative set of service products designed and tailored to meet differing customer requirements while signifi- cantly reducing internal business process costs.
Results from the qualitative study
The output from the qualitative study was a thorough report documenting the results, in line with the desired research objectives. Some of the more surprising aspects were supported by verbatims. A key output was the polarization of very different attitudes towards service requirements that some buyers had in comparison with others. For example:
Some wanted a response within a few hours, whereas many others would be equally happy with next day.Results from the quantitative study
The output from the quantitative study was extensive. Much of the output was detailed demographic data, opportunities information and competitive positioning comparisons.
However, the focus was on a fairly extensive executive summary for internal communica- tions within GlobalTech. What follows are summarized extracts from those outputs.
The segments
Six market segments were identified as a result of iterative computer clustering. Initially, the clustering routines had identified more segments but by careful analysis these were reduced to what was decided to be the most manageable level. Some previously very small segments were merged with very similar larger segments. A summary of the six concluding segments appears in Figure 6.10.
Polarizations in attitude
The computer clustering generated the segments by grouping customers with similar atti- tudes and requirements. This resulted in some marked differences in attitude between seg- ments. As illustrated in Figure 6.11, the Koalas really did not want to know about being trained and having a go, but the Teddies, Polars and Yogis had an almost opposite attitude.
Satisfaction and loyalty
GlobalTech was measuring customer satisfaction for use both locally, as a business process diagnostic tool, and globally, as a management performance metric. These satisfaction met- rics were averaged across all customers, both by geographic business unit and by product division to meet internal management reporting requirements.
However, the outputs from the quantitative study clearly showed that these traditionally well-accepted metrics were, in fact, almost meaningless. What delighted customers in one market segment would annoy customers in another, and vice versa. To make the metrics meaningful, they had to be split by key criteria and the market segments.
Loyalty was obviously highest where GlobalTech’s ‘one-size-fits-all’ service deliverable coin- cidentally best matched a segment’s requirements, as illustrated in Figure 6.12.
Correlation between loyalty and customer satisfaction
The lifecycle for many of GlobalTech’s products in the market was moving into the ‘commod- ity’ phase. Therefore, not surprisingly, customers were becoming less loyal.
Each percentage point increase in loyalty translated into almost the same increase in market share. Each percentage point in market share added many millions of dollars of gross reve- nues. The cost of reselling to a loyal customer was about one-sixth the cost of winning a new customer. Consequently, each percentage point increase in loyalty had a significant impact on the bottom line.
Because of this, the quantitative study included correlating the key drivers of satisfaction and loyalty within each market segment. The qualitative study identified some 28 key customer requirements of their service provider. The quantitative study prioritized these to provide a shorter list of 17 common requirements. The correlation exercise reduced this to only two requirements that drew a significant correlation between satisfaction and loyalty:
Providing service levels that meet your needs. Providing consistent performance over time.Although GlobalTech was achieving the second, it was really only delivering the first in two of the market segments.
Segment attractiveness
As an aid to deciding where best to invest, a chart of segment attractiveness was produced using attractiveness factors determined by GlobalTech. Demographic data from the quantita- tive study was combined with internal GlobalTech financial data. Each factor was weighed to reflect the relative importance to GlobalTech. This highlighted quite a few issues and some opportunities. For instance, the highest margins were coming from some of the least loyal segments. The resulting attractiveness chart appears in Figure 6.13.
Competitive positioning
Fortunately for GlobalTech, its competitors did not appear to have an appreciation of the market segments or the different requirements of their customers. They were also mainly delivering a ‘one-size-fits-all’ service offering. However, there were some noticeable differ- ences in the offerings. These resulted in each major competitor being significantly stronger in just one or two segments where their deliverables best matched the segment’s needs.
The quantitative study provided detailed rankings of the decisive buying criteria (DBCs) and the constituent critical success factors (CSFs) for each market segment. These were to prove invaluable during the phase of designing the service products and developing the strategy to achieve competitive advantage.
Reachability
Key to GlobalTech successfully implementing any strategies or communications that were to be segment-based would be the ability to identify each customer by segment. As part of the quan- titative study, two statistical reachability tasks were conducted. The results were as follows:
1. A sampling of internal GlobalTech databases showed that there was sufficient relevant data to achieve better than 70% accuracy, using computer imputation methods, to code each customer with its market segment. This was considered to be good enough to enhance marketing communications measurably, but might not be sufficiently accurate to ensure that the most appropriate offer was always made.
2. Statistical analysis identified four ‘golden questions’ that would provide acceptable accu- racy in segment identification. These questions could then be used during both inbound and outbound call centre conversations until all customers had been coded.
The recommendation was to use both methods in parallel so that accuracy would improve over time. The coding of larger customers, however, should be given priority.
Company insight 4
Understanding the different market segments helps in designing the required offers. But do not get hung up on reachability. It is not essential to code every customer to the right segment from day one. Where you are not really sure, let them see different offers and so position themselves. Similarly, be willing to accept that within a large organization some buyers may fall into different market segments, though the difference will only be on one or perhaps two buying criteria rather than across all the buying criteria.
Strategy development and implementation Market understanding and strategy development
The challenge now was for the project team to absorb and understand all the findings from the two research studies. The team then had to turn that understanding into realizable strate- gies. To achieve this, a workshop process covering opportunities, threats and issues (OTIs) was used.
Briefly, the process involved an extensive, but controlled, brainstorming session followed by a series of innovative strategy development workshops.
A facilitator took the team systematically through every piece of relevant information available. Using brainstorming, the team tried to identify every conceivable opportunity, threat or internal issue associated with each item of information. The information was also then tested against a predetermined list of business behaviours and processes in an endeavour to entice additional and