A Practitioners’ Report Based on:
‘Shareholder and Stakeholder Approaches to Strategic Performance Measurement Using the Balanced Scorecard’
By Allan Mackay
refraining from acting in reliance on any information contained herein. No reader should rely on this document as it does not purport to be comprehensive or to render advice.
This disclaimer does not purport to exclude any warranties implied by law that may not be lawfully excluded.
Acknowledgements
This guide has its foundations in the research, ‘Shareholder and Stakeholder Approaches to Strategic Performance Measurement Using the Balanced Scorecard’ conducted for The Chartered Institute of Management Accountants Research Foundation* by the
International Institute of Banking and Financial Services (IIBFS) at Leeds University. In preparing this text I have drawn heavily on this research. My role has been that of both editor and author and I hope that in preparing the text I have not detracted from the valuable contribution of the original work.
It has been impossible to compile the Practitioner’s Guide without using significant elements of the original text and full recognition for this important work is rightly due to the original researchers, predominantly Phil Aisthorpe. His scholarly contribution made this guide possible and much of his original work is incorporated into the Guide. He was ably supported and mentored by Professor Kevin Keasey, Dr Helen Short, Robert Hudson, Kevin Littler and Jose Perez Vazquez. They are also owed a debt of gratitude. My work has also benefited from the guidance of Professor Kevin Keasey and the patient proof reading and suggestions from Kevin Littler. Dr Phil Barden of The Centre for Performance Management and Innovation assisted me to enter this field and has provided a valuable overview of emerging developments throughout the project.
Leeds October 2004
* The Chartered Institute of Management Accountants Research Foundation has since been subsumed into the General Charitable Trust of the Chartered Institute of Management Accountants October 2004
Preface. . . 2
Introduction. . . 4
1. The History and Development of the Scorecard. . . 8
2. The Balanced Scorecard Explained. . . 11
3. Scorecard Foundations. . . 20
4. Building a Balanced Scorecard. . . 22
5. Communication, Action, Presentation & Feedback . . . 31
6. Stakeholder Balanced Scorecards: Examples from the Public Sector . . . 34
7. Common Threads and Conclusions. . . 44
Appendices . . . 47
Appendix 1. The Research Process . . . 47
Appendix 2. Case Study 1 – English Nature . . . 49
Appendix 3. Case Study 2 – Mersey Travel . . . 55
References. . . 60
Kaplan and Norton’s Balanced Scorecard is a concept still widely used and respected in today’s business environment.
What follows, provides guidance and advice on the development and implementation of a Balanced Scorecard for those organisations considering the introduction of a Scorecard or those that have adopted the approach with limited success. It is applicable for both public and commercial enterprises.
The Practitioner’s Guide was written as part of a project receiving financial support from the Chartered Institute of Management Accountants Research Foundation. The project involved reviewing the current academic literature, followed by a telephone survey in which 460 major UK organisations, embracing both the public and commercial sectors,
participated.
The telephone survey was the catalyst for a focused postal questionnaire survey of 60 of the organisations developing performance measurement systems. After the telephone survey semi-structured interviews were conducted in 45 of the organisations. Finally, a detailed investigation on a case study basis was carried out at each of ten major respondents.
Historically, the majority of organisations, particularly those in the private sector, have relied on financial and cost accounting measures to assess their performance. Financial measures continue to be of fundamental importance to organisations. However, there is a growing awareness that if an organisation is going to succeed in the contemporary business and political environment, it will have to generate and take account of a wider range of measures, reflecting the requirements of customers, shareholders, employees, and the communities around them.
Traditional financial and cost accounting measures record what has happened in a previous period and are often referred to as ‘lag indicators’. Relying solely on this type of indicator has been likened to ‘steering a ship by its wake’ or
‘driving a car viewing the route through the rear view mirrors’. In the early 1990s there was a growing awareness that organisations needed a wider set of measures, compatible with their increasingly complex operating environments and this was the catalyst that spurred Kaplan and Norton (1991) to develop the Balanced Scorecard.
The original Kaplan and Norton model illustrated leading and lagging indicators in four different perspectives: Financial;
Customer; Internal Processes; and Learning and Growth. As Kaplan and Norton state:
‘The name reflected the balance provided between short and long term objectives, between financial and non- financial measures, between lagging and leading indicators, and between external and internal performance
perspectives’.
One of the major strengths of the Balanced Scorecard is its adaptability. Indeed, the originators make it clear that their four quadrants are only a template. Although the term, Balanced Scorecard, might conjure up an initial impression of a table of measurements or key performance indicators, it is in fact a process comprising of a number of carefully inter- linked steps. The real power of a properly developed Balanced Scorecard is that it links the performance measures to the organisation’s strategy. Organisations implementing a Scorecard process are forced to think clearly about their purpose or mission; their strategy and who the stakeholders in their organisation are and what their requirements might be. They also need to evaluate quite clearly the time scales in which they hope to achieve their strategic objectives.
The Balanced Scorecard process involves bringing together the key members of an organisation to debate and reach a consensus on the purpose of the organisation, the
requirements of its stakeholders and its strategy. By doing so, it moves beyond being a performance measurement tool to also being a useful aid to strategic development.
Many of the early adopters of the system were either large commercial operations in the USA, or organisations with strong American links. Consequently, much of the quite extensive management literature tended to be US-centric and weighted towards commercial organisations.
The research undertaken for The Chartered Institute of Management Accountant Research Foundation (CIMA) by The International Institute of Banking and Financial Services (IIBFS) was therefore specifically designed to provide an insight to management on the application of the Balanced Scorecard process based on the experience of UK
organisations. The research also focused on the very important issue of stakeholder participation. The findings of the research indicated increasing stakeholder participation in the Scorecard process within the public sector. Indeed, the research highlighted how the Scorecard could embrace the UK Government’s policies such as the ‘Best Value Regime’
with its requirements to ‘Challenge, Compare, Consult, Compete and Collaborate’.
●The Introductionto the guidebook describes the research carried out and details Balanced Scorecard utilisation in UK organisations.
●Chapter 1deals with the history and development of the Balanced Scorecard and the contextual setting of the Scorecard relative to other common performance management and measurement systems.
●Chapter 2is particularly aimed at the reader who is encountering the Scorecard for the first time and provides a detailed explanation of the major components of a Balanced Scorecard process.
●Chapter 3describes the foundations to a cohesive and coherent Balanced Scorecard process and highlights the fundamental questions that the organisation must consider.
●Chapter 4reviews various design and implementation issues and draws heavily on the case studies that formed part of the research conducted by IIBFS, to outline a framework for developing a Scorecard in a commercial organisation.
●Chapter 5describes the critical issues of launching and communicating the Balanced Scorecard to the members of the organisation and to external stakeholders. It also
‘completes the circle’ by describing the feedback systems that allow the organisation to make refinements, and adapt to changing environments.
●Chapter 6fills a large gap in the existing literature by focusing on an example of stakeholder inclusion in the Balanced Scorecard. It provides an overview of how a public sector organisation, with a large number of stakeholders, may go about developing a Balanced Scorecard. This chapter overlaps with many of the themes in the preceding chapters but this has been necessary to maintain a cohesive structure useful for practitioner application. If anything, the overlaps reinforce some of the critical requirements for good Scorecard design in private sector organisations. The examples in this chapter are intended to be informative of the Scorecard approach and are not intended to reflect clinical or local authority best practice.
●Chapter 7highlights some of the key findings from the research and links them to more detailed work by Balanced Scorecard experts. The chapter draws conclusions from the research findings and identifies common threads between the private and public sectors.
What is a Balanced Scorecard?
Although in recent years few managers will have managed to avoid a discussion of the Balanced Scorecard, many will not have a full understanding of the Balanced Scorecard process, how it works, what resources are required and whether it really is a new approach to performance measurement. The following paragraphs attempt to clarify some of these issues.
Perhaps the most obvious role of the Balanced Scorecard is the ‘Scorecard’ element i.e. to record and clearly illustrate the small number of key measurements (20-25) that allow busy executives to quickly evaluate what is going on in critical areas of their organisation. However, if the Balanced Scorecard is to merit its description as an innovative approach to performance measurement, it has to be much more than a scoring or results recording mechanism.
The use of the word ‘Balanced’ reflects the roots of the Balanced Scorecard in concerns that organisations were giving too much emphasis to short term financial and
budgetary issues. Many business leaders, academics and consultants recognised that a short term financial or budgetary focus could lead to other important, but perhaps longer term issues, such as customer development, changing markets, standards of service and organisational learning, being given insufficient attention or possibly neglected altogether.
In response to those concerns, Kaplan and Norton (1991) formulated an organisation model comprising of four quadrants to represent and focus attention on what they saw as the key components, timescales and perspectives of an organisation’s strategy.
The Kaplan and Norton template, illustrated in Figure 1, suggests that a Balanced Scorecard will comprise of quadrants giving equal consideration to both long term and short term Financial Performance, Customer Issues, Internal Business Processes and Organisational Learning and Growth.
Financial
Vision & Strategy Internal Business
Processes Customers
Learning and Growth Figure 1: The Balanced Scorecard
These quadrants may not be appropriate for all organisations but one of the strengths of the Balanced Scorecard process, which will be discussed in more detail in later chapters, is that organisations have the freedom to use whatever quadrants or perspectives that best suit their environment and strategy.
Perhaps more importantly, and what starts to differentiate a well-constructed Balanced Scorecard from other
measurement systems, is that the Scorecard translates the strategy into relevant operational terms and reflects the organisation’s detailed understanding of the causal linkages between measures and quadrants. Further, the Scorecard is groundbreaking in the balance provided by the recording of results achieved (lag indicators) and the illustration of expected results (lead indicators).
The research that underpins this guidebook highlights that the presentation of the key performance measures is only the
‘tip of the iceberg’. Balanced Scorecard users are keen to emphasise that the process of designing a Balanced Scorecard with its debates about goals, quadrants, perspectives and critical measurements, is an extremely useful process of testing the strategy and aligning the organisation behind the strategic goals. The research highlights that a properly executed Balanced Scorecard process requires every level of the organisation to have a clear and agreed understanding of:
●Why the organisation exists – its fundamental goal;
●What the organisation values;
●The organisation’s vision for the future;
●The critical measures that will make a real difference to the organisation’s performance;
●Who the stakeholders are and how their views can be collected and reflected in the respective quadrants of a Balanced Scorecard; and
●How the quadrants and measurements link together (causal links) to ensure the organisation moves towards its strategic goals and objectives.
Is the Balanced Scorecard a new process?
Some critics have suggested that there is nothing new in looking beyond financial and accounting measures to evaluate an organisation. There is certainly a considerable body of evidence that leading experts, such as Hopwood, Argyris, Ridgway and Parker, were highlighting the inadequacy of ‘single measures of success’ many years before the development of the Balanced Scorecard.
For example, Lee Parker’s (1979) ‘Divisional Performance Measurement: Beyond an Exclusive Profit Test’, suggests that:
‘Further attention could usefully be paid to the
development of divisional productivity indices, projected monetary benefits of the maintenance of certain market positions, costs versus benefits of product development, division social accounts for social responsibility, and human resource accounting for aspects such as personnel
development, employee turnover, accident frequency etc’.
Hopwood’s (1973) work provides a comprehensive overview of performance measures in an accountancy context and suggests, inter alia:
‘While not denying that management is a multifaceted task, accounting systems do not aim to reflect all of its valued and important variety. Many crucial social behaviours are completely ignored, and although the narrowly economic implications of some others may be reflected, even such a limited representation remains incomplete and invariably occurs with a delay. But more than being partial, behaviours intended to improve the accounting indices can actually conflict with other equally necessary behaviours’.
In a similar vein, Ridgway (1956) also describes how measures need to be weighted in order to:
‘adequately balance the stress on the contradictory objectives or criteria by which performance of a particular organisation is appraised’.
There is no doubt that this body of work by established scholars, reflects the concerns that may eventually have provided the catalyst for the development of the Balanced Scorecard. It may also be argued that a diligent and well-read manager could have pieced all of this work together and developed a balanced performance measurement system.
However, it can equally be argued it took the Balanced Scorecard to make what was previously implicit, explicit, and in a way that captured the imagination of business leaders and managers.
It may also be argued that the Balanced Scorecard goes beyond the earlier work by taking performance measurement further than the boundaries of accountancy alone, and by bringing focus to the causal links between measures. It makes an explicit link between performance measures and strategy and provides a means for strategy to be translated into operational measures that are relevant to the people tasked with implementing strategy and change.
Olve, Roy and Wetter (1999) capture elements of this debate in their comment that:
‘The scorecard often becomes a catalyst for discussions which actually could have been held without it but which become essential when it is used’.
Is it just another management fad?
Since its arrival in the United Kingdom in the 1990s the Balanced Scorecard has achieved significant penetration into a wide spectrum of commercial organisations. The growing popularity of the Scorecard has led to an explosion of interest in the use of this procedure, and Appendix 1 to this report highlights how 30% of the top 100 UK Corporates (by market capitalisation) have adopted the Balanced Scorecard.
It is perhaps fair to say that the UK public sector was slower to adopt the Balanced Scorecard process but at the time of this survey 31% of the 51 organisations contacted were using or intending to use the Balanced Scorecard. The current Labour Government’s initiatives for modernisation of the public sector have led to a significant increase in interest in the Balanced Scorecard. Several Government publications have made reference to a Balanced Scorecard approach. For example, the Audit Commission’s website provides a wealth of useful information, examples and a very helpful ‘toolkit’1. If we accept conference proceedings, books and journal articles as an indicator of interest it would appear that the Balanced Scorecard is gaining an ever-increasing audience and is becoming a familiar tool in the modern manager’s toolkit. With the rapid expansion in the implementation and use of Balanced Scorecards, it has become necessary to determine just how this approach to performance measurement is currently being used in the UK, and to identify and disseminate examples of best practice to aid UK management. This guidebook attempts to fill this gap and provide some of the answers to the above questions.
Does it work?
Although any Internet search will reveal a number of qualitative reports on Balanced Scorecard implementation, there is little quantitative evidence from UK organisations directly linking performance improvements and Balanced Scorecard initiatives. Nevertheless, there are a significant number of qualitative reports from satisfied users in both private and public sector organisations2.
1 http:// www.bvps. audit – commission.gov.uk
2 Wisniewski M, (2001), Rigby DK (2001), Goodman (2002), Brooke (2002) – see bibliography
Frigo (2002) provides an interesting overview of the American Institute of Management Accountants’ 2001 Performance Measurement study which highlighted that Balanced Scorecard users rated their systems as ‘very good’ to
‘excellent’ in supporting management’s objectives, communicating strategy to employees, and supporting innovation. The response to questions about the effectiveness of performance measures saw financial measures receiving high ratings and customer, internal business processes, and learning and growth measures receiving progressively lower ratings. The learning and growth quadrant received the lowest rating and Frigo posits that this is not unexpected and highlights the challenges of measuring intangibles. He reflects that organisations, which relate intangible assets such as human and information capital to the value creation process, are more successful in developing performance measures in those areas. He also notes that many of the Balanced Scorecard users interviewed had ‘significantly improved their customer performance measures by using the Scorecard implementation process as an opportunity to understand customer segments, expectations and value propositions.’
Not all experts support the Balanced Scorecard and some, such as Jensen (2002), contend that it is flawed because it does not actually give managers a score – ‘that is a single- valued measure of how they have performed’. He proposes a process he calls ‘enlightened value maximisation’ and suggests that organisations should ‘define a true (single dimensional) score for measuring performance for the organisation or division (and it must be consistent with the organisation’s strategy). …as long as their score is defined properly, (and for lower levels in the organisation it will generally not be value) this will enhance their contribution to the firm’.
Birchard (1996) suggests that the Balanced Scorecard is believed to be successful because of its ability to define the critical success factors and measures that focus on growth and long term success. However, Birchard also suggests that the Balanced Scorecard may be inappropriate for
organisations with short-term financial problems or undergoing restructuring.
Palmer and Parker (2001) provide an interesting and thought provoking perspective by applying ‘physical science
uncertainty principles’ to performance measurement systems. Their report suggests that a key factor in developing a successful Balanced Scorecard is the identification of
‘aggregate level measures’ and in support of this argument they use Lucas’s (Lucas 1995) study highlighting the difficulties ‘in developing specific worker level measures that match higher level ones’. They highlight the similarity between the Balanced Scorecard’s focus on critical success factors and examples from Activity Based Management (ABM) which suggest that ‘rather than having accurate product costing as the focus’, organisations can make large gains by identifying and focusing on ‘one or two critical input drivers’. These drivers are very similar to the Balanced Scorecard’s critical success factors, and in terms of physical science uncertainty principles can be represented as ‘strange attractors’3‘around which the system can organise itself at a new level of suitability’.
For readers who wish to have more quantitative evidence of the popularity or otherwise of the Balanced Scorecard and other management tools, Bain & Company carry out an annual survey to investigate the experience of companies adopting leading management tools. The results of this survey and other useful information are posted on their web site4.
3 Gleick, James, 1988 ‘Chaos-Making a New Science’, London, Heinemann
4 http:// www.bain.com
The fundamental principles of financial accounting
measurement were first developed centuries ago to support the methods of doing business that were prevalent at that time. The use of financial records has evolved with the development of business structures. Financial measures tend to reflect contemporary organisational thinking and industrialisation and mechanisation have both been strong influences in this regard for most of the 20th century. Since the Industrial Revolution bureaucratisation of the
organisation and the division of labour have been dominant themes. As the German sociologist Max Weber (1947) noted:
‘bureaucracy is a form of organisation that exhibits the mechanistic concepts of precision, regularity, reliability and efficiency achieved through the fixed division of tasks and detailed rules and regulations’.
1.1 The Organisation as a Machine
The industrial era was the era of the machine and this had a strong influence on accounting methodologies. It was relatively easy to use a machine metaphor to aid
understanding of organisations (Morgan, 1997). Such thinking required top-down control, and so classical theorists
developed the concept of organisations as rational systems that should be streamlined to operate in as efficient a manner as possible. The emergence of Scientific
Management, as pioneered by Frederick Taylor, reinforced the concept of the organisation as a machine. Taylor was an American engineer and is best known for his time-and- motion studies, characterised by detailed observation of all aspects of a work process to find the optimum mode of performance.
These dominant schools of thought had a strong influence on the development of financial and cost accounting protocols.
They evolved around issues such as how to deal with the capital cost of tangible assets and with measuring the efficiency of men and machines.
1.2 21st Century Models
As we move into the 21st century, the emphasis has moved from tangible assets to knowledge-based strategies founded on intangible assets, and a movement away from top-down strategic formulation. The new business environment of the so-called ‘Information Age’ has become dependent on control of such issues as employee knowledge (Stewart, 1997), organisational empowerment (Simons, 1995), competitive capabilities (Stalk et al, 1992), intangible resources (Hall, 1992), and core competencies (Prahalad and Hamel, 1990). In this regard, the fundamental accounting principle of placing a monetary value on the productive assets of organisations creates increasing difficulty. As Kaplan and Norton point out,
‘Ideally, this financial accounting model should have been expanded to incorporate the valuation of a company’s intangible and intellectual assets … Realistically, however, difficulties in placing a reliable financial value on such assets as … process capabilities, employee skills, motivation
… [and] customer loyalty… will likely preclude them from ever being recognised in organisational balance sheets’.
(1996a:7)
Additionally, traditional financial accounting methods relate to specified periods of time and accounting systems, even at their most sophisticated, inform management as to how a corporation has performed in accordance with pre- determined standards within a specific period. If management is to lift its vision towards the competitive horizon, it needs to step back from the periodicity of pure accounting measurement. ‘Performance’, in this context, is usually measured in terms of transaction related activity (e.g.
sales, direct costs, amortisation, etc.) conducted in the market place and completed within the period under consideration. Transaction dependent measures tend to emphasise the sequential value chain of business functions as products are supplied into a competitive market (Porter, 1985). By contrast, they may fail to recognise the value creating, cross-functional capacities and multi-period processes inherent to the organisation.
Accounting measures may provide little indication of the importance of change programmes undertaken within the organisation that, although not affecting current transaction activity, will have a significant effect on earnings in multiple future periods. Indeed, basing the criteria for performance success on financial results can lead companies to reward inappropriate behaviour by managers. Management may seek to enhance profitability in the current accounting period by eliminating valuable investment programmes and thereby damaging future competitiveness. Historical cost accounting methods have a limited role in forecasting future competitive success. Historical measures, such as Return on Investment (ROI) and Return on Capital Employed (ROCE), are poor tools for plotting the future direction of a company within its main markets and industry sector.
1.3 Tableau de Bord
The concept of taking account of more than just financial measures is not new, but it is one that has developed at an increasing pace with the advent of the Information Age.
Perhaps the earliest formalised measurement system of this type was the French process of Tableau de Bord that emerged in the early part of the 20th century. Broadly translated from the French, ‘tableau de bord’ means a dashboard, a series of dials giving an overview of a machine’s performance, such as the array of instruments used by car drivers or airline pilots.
The association with machines is not surprising as the system was first evolved by process engineers attempting to evolve their production processes by having a better understanding of the relationships between their actions and process performance; the cause and effect relationship. In an attempt to improve local decision making, the engineers developed separate tableaux for each sub unit that reflected the overall strategic aims of the organisation. As their objective was to study cause and effect relationships, the engineers did not limit their measurements to financial indicators and used a wide range of operational measures to evaluate local actions and impacts.
Figure 2: The EFQM model
Innovation and Learning
Enablers Results
Leadership
People Management
Processes
People Satisfaction
Policy & Strategy Customer
Satisfaction
Resources Impact on Society
Business Results Although the Tableau de Bord has been around for over 50
years, it was only in the last quarter of the 20th century that the movement away from reliance on financial measures gained impetus. One of the main catalysts appears to have been increasing global competition.
1.4 The Performance Pyramid
McNair et al (1990) designed a model that they called the
‘performance pyramid’ based on the concepts of total quality management. The performance pyramid represents an organisation resolved into four interdependent levels. The first level is the traditional corporate management layer and the second; the company’s sub units. The third level is not a structural business unit but rather is a representation of all the processes that are critical to the organisation’s success – such as creating customer satisfaction. It is from this level that operational goals such as quality and delivery time, are derived. In the performance pyramid model, different measurement frequencies are adopted to meet the perceived requirements of different levels of management.
In the lower, customer facing or operational base of the pyramid, measures are relatively frequent, for example, in units of days or weeks. As we advance up the pyramid through the hierarchical levels of management, measurement frequencies reduce, and the emphasis is on financial
measures. One of the strong themes underpinning this model, and one that has a resonance with the Tableau de Bord, is the concept of a strong cause and effect linkage between the lower operational measures and the higher financial measures and the use of the pyramid to illustrate this relationship.
1.5 The EP2M Model
Adams & Roberts (1993) progressed the evolution of measurement systems by promoting their use as a means of fostering an organisational culture in which constant change is seen as normal and which has a fundamental requirement for effective measures that can be promptly reviewed and which provide rapid feedback to decision makers. Their model is encapsulated by the formula EP2M: Effective Progress and Performance Measurement, and stresses the importance of measures in four areas:
●External measures customers, markets, suppliers, partners, etc
●Internal measures efficiency and productivity of internal processes
●Top down measures implementing the strategy
●Bottom up measures empowering employees 1.6 The Malcolm Baldridge and EFQM Models
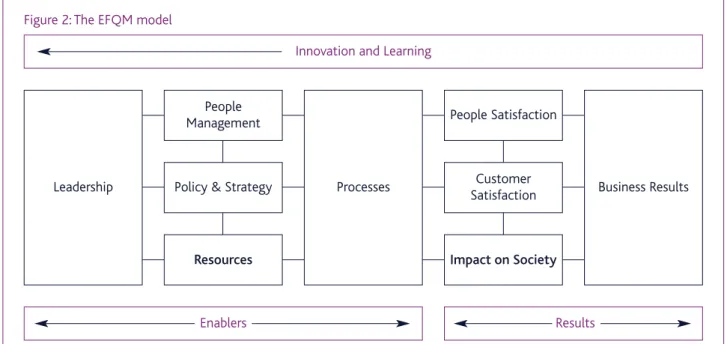
Two very similar, and quite prominent, measurement models were developed as a result of USA and European Government initiatives to counter the threatened Japanese domination of global markets. Both schemes feature awards for various classes of organisations. The American scheme is known as the Malcolm Baldridge National Quality award and its European counterpart is the European Foundation for Quality Management’s Business Excellence (EFQM) model. The familiar structure of the latter model is shown in Figure 2.
The Results section of the model describes what the
organisation has achieved, and is currently achieving, whereas the Enablers show how those results are being achieved. The Business Excellence model is a way of auditing the
performance of the organisation against each of the nine elements shown in Figure 2. Those elements are weighted and the overall score determines how the organisation is performing. The EFQM framework is predominantly used as a means of continuously improving processes, as well as a useful source of benchmarking data.
1.7 Origins of the Balanced Scorecard
In 1990, Dr David P. Norton and Professor Robert S. Kaplan conducted a research study project, sponsored by KPMG Peat Marwick, into the performance measurement systems of 12 companies. The emphasis of their research project, entitled
‘Measuring Performance in the Organisation of the Future’, was to investigate and address the limitations of traditional financial based systems for monitoring performance. Focusing on financial measures, it was argued, led companies to focus on the short term and, potentially, left them ill prepared for future competitive engagement.
Over the course of 1990, participants of the research study began to shape out the structure of the Balanced Scorecard.
The results of the original study were subsequently published in an article in The Harvard Business Review (Kaplan and Norton, 1992). As corporate interest in their approach increased, Kaplan and Norton were able to further develop their ideas on the design and application of the Balanced Scorecard (Kaplan and Norton, 1992; 1996a-e; Norton, 1997).
Of all the models discussed, the EFQM, Business Excellence Model and the Balanced Scorecard have been the most widely adopted by UK organisations. Each model appears to have its own champions specialising in their implementation and promotion.
1.8 The Balanced Scorecard v The EFQM Model
Kaplan and Lamotte (2001) contend that there are five major ways in which the Balanced Scorecard exceeds the Business Excellence model:
●They suggest that the EFQM and Baldridge models verify that a strategy exists and is well followed. However, they contend that the links between the enablers and results are implicit. In contrast, they suggest the process of building tailored Balanced Scorecards gives much more emphasis to cause and effect linkages.
●The EFQM and Baldridge models evaluate internal process performances against benchmarked best practices and, as a result, focus on continuous improvement. In contrast, target setting with the Balanced Scorecard permits aspirations for radical performance allowing Scorecard organisations to become the benchmarks for others.
●Quality Models, such as the EFQM and Baldridge, strive to improve existing organisational practices but applying the Balanced Scorecard often reveals entirely new processes at which an organisation must excel.
●Quality programmes are often referred to as continuous improvement programmes. However, there is a danger with the EFQM and Baldridge models that scarce resources might be expended on incrementally improving inefficient but existing processes. Kaplan and Norton suggest that the Balanced Scorecard is a better tool for prioritising which processes should be allocated resources and which should be dropped.
●The Balanced Scorecard integrates budgeting, resource allocation, target setting, and reporting, and feedback on performance into ongoing management processes.
Historically, the EFQM and Baldridge models evaluated and scored leadership and strategy setting as if they were independent processes. With the Balanced Scorecard they are inextricably linked together.
Nevertheless, Kaplan and Lamotte (2001) do concede ‘that each model adds a useful dimension to the other, and in using the two together a management team leverages the knowledge and insights from each approach. Both approaches foster deep dialogues about performance, supported by management processes that link strategy to operations to process quality’.
Key Points:
●Financial models need to reflect contemporary organisational thinking.
●20th century accounting systems reflected ‘top-down’ control and the influence of tangible assets such as machines.
●21st century systems need to consider more intangible assets such as employee knowledge, core competencies, etc.
●The Business Excellence model and the Balanced Scorecard complement each other and can be used together to capture the knowledge and insights from each approach.
The Scorecard’s guiding concept is to move managers away from focusing purely on financial outcomes and to consider a more balanced portfolio of multiple financial and non- financial measures closely linked to strategic objectives. After all, no single performance indicator can succinctly capture the complexity of how an entire organisation is performing.
The Scorecard encourages managers not to rely solely on historical measures and emphasises the need for ‘lead’
indicators that point to the future direction of the
organisation. The key question under consideration becomes less ‘what have we achieved?’ and more ‘what are we likely to achieve in the future?’ Enabled by this change of perspective, the emphasis of the Scorecard approach is to measure the strategic as well as the operational. Scorecard measures are selected to describe and monitor the organisation’s progress in implementing and achieving its strategy. Monitoring these measures enables management to plot the future
competitive direction of the organisation. This shift in focus, from operational activity to strategic guidance, has become increasingly important as external competitive environments have become more dynamic and internal organisational structures have become more fluid and complex.
2.1 Balanced Scorecard Quadrants
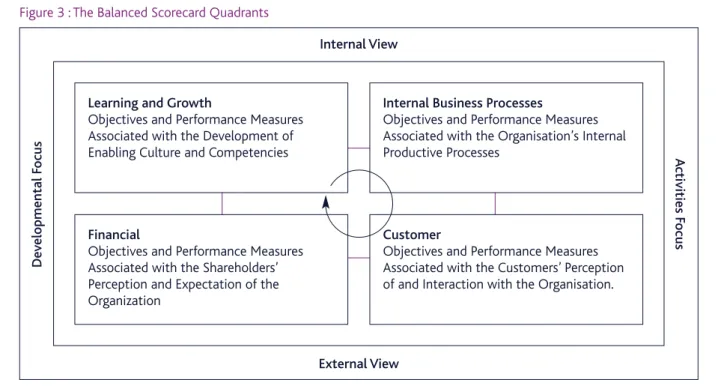
The generic Balanced Scorecard proposed by Kaplan and Norton (1996a) consists of four interrelated quadrants, each containing objectives and measures from a distinct
perspective (see Figure 3). These perspectives are termed:
●Financial
●Customer
●Internal Processes
●Learning and Growth
The scope of these perspectives is designed to cover the whole of the organisation’s activities both internally and externally, both current and for the future.
Figure 3 : The Balanced Scorecard Quadrants
Internal View
Financial
Objectives and Performance Measures Associated with the Shareholders’
Perception and Expectation of the Organization
Internal Business Processes
Objectives and Performance Measures Associated with the Organisation’s Internal Productive Processes
Customer
Objectives and Performance Measures Associated with the Customers’ Perception of and Interaction with the Organisation.
External View
Developmental Focus Activities Focus
Learning and Growth
Objectives and Performance Measures Associated with the Development of Enabling Culture and Competencies
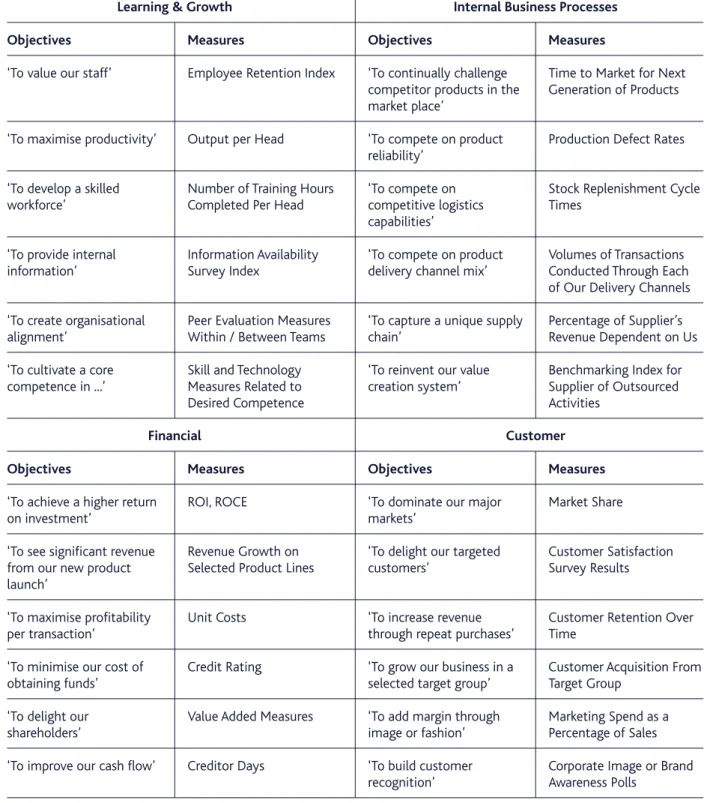
Once it has been formulated, the organisation’s strategy is translated into specific objectives that can be classified within each of these four perspectives. Once these objectives have been identified, appropriate quantitative measures are
devised to report and monitor the success in achieving these objectives. Table 3 lists examples of objectives and measures that may appear in each of the four measurement
perspectives.
Table 3: Examples of Quadrant Objectives and Measures
Learning & Growth Internal Business Processes
Financial Customer
Objectives
‘To value our staff’
‘To maximise productivity’
‘To develop a skilled workforce’
‘To provide internal information’
‘To create organisational alignment’
‘To cultivate a core competence in ...’
Objectives
‘To achieve a higher return on investment’
‘To see significant revenue from our new product launch’
‘To maximise profitability per transaction’
‘To minimise our cost of obtaining funds’
‘To delight our shareholders’
‘To improve our cash flow’
Measures
Employee Retention Index
Output per Head
Number of Training Hours Completed Per Head
Information Availability Survey Index
Peer Evaluation Measures Within / Between Teams Skill and Technology Measures Related to Desired Competence
Measures ROI, ROCE
Revenue Growth on Selected Product Lines
Unit Costs
Credit Rating
Value Added Measures
Creditor Days
Objectives
‘To continually challenge competitor products in the market place’
‘To compete on product reliability’
‘To compete on competitive logistics capabilities’
‘To compete on product delivery channel mix’
‘To capture a unique supply chain’
‘To reinvent our value creation system’
Objectives
‘To dominate our major markets’
‘To delight our targeted customers’
‘To increase revenue through repeat purchases’
‘To grow our business in a selected target group’
‘To add margin through image or fashion’
‘To build customer recognition’
Measures
Time to Market for Next Generation of Products
Production Defect Rates
Stock Replenishment Cycle Times
Volumes of Transactions Conducted Through Each of Our Delivery Channels Percentage of Supplier’s Revenue Dependent on Us Benchmarking Index for Supplier of Outsourced Activities
Measures Market Share
Customer Satisfaction Survey Results
Customer Retention Over Time
Customer Acquisition From Target Group
Marketing Spend as a Percentage of Sales Corporate Image or Brand Awareness Polls
Suggested Measures: Kaplan and Norton (1996a)
2.2 The Financial Quadrant
The concept of using a balanced portfolio of both financial and non-financial measures does not detract from the importance of financial outcomes. Financial results have their own, if incomplete, message to tell and Kaplan and Norton (1996) see the Financial quadrant as acting as the focal point or culmination of all the objectives and measures in the other three Scorecard quadrants.
As previously explained, some experts such as Jensen (2002) eschew the Balanced Scorecard in favour of more
‘shareholder value’ oriented models. However, managers are not forced into an ‘either or’ choice because, as Kaplan and Norton suggest, the Balanced Scorecard is a template not a straight jacket. As can be seen from the many examples in this guidebook the Scorecard can be adapted to reflect any strategy and the Financial quadrant can readily
accommodate both operational and shareholder derived measures.
It may even be argued that designing a Balanced Scorecard may provide the catalyst that spurs organisations to review their financial measurements and to select those that best reflect their strategy and incentivise their managers to achieve it.
2.2.1 The Public Sector
Although experts such as Olve, Roy & Wetter (2001) suggest alternatives to the financial quadrant for public sector bodies, this is not necessarily appropriate. After all, no publicly funded body acts in a financial vacuum and there will be pressure to confirm that ‘value for money’ is being achieved.
This is certainly the case in the current environment with the government appearing to prefer what Moore (1998) describes as:
‘cost effectiveness analysis which find their standard of value not in the way individuals value the consequences of government policy but instead in terms of how well the program or policy meets objectives set by the government itself’.
Unfortunately, although the public sector has well established principles for evaluating public policy in respect of tax choices etc. (Cullis & Jones, 1998), it does not appear to have evolved operational financial measures such as those used by private sector managers and analysts. However, the modern public sector organisation generally has a wealth of data at its disposal that can be converted into financial data and measures that will help to drive the organisation in the direction of its strategy and policy objectives. The research showed that a typical public sector financial quadrant would include measures that indicate:
●Money has been spent as agreed and in accordance with procedures;
●Resources have been used efficiently; and
●Those resources have been used to achieve the intended result.
The Accounts Commission for Scotland has also developed a very useful guide to designing Scorecards for use in the public sector.5
2.2.2 The Commercial Enterprise
The following paragraphs highlight some of the key financial measures that could be used in the financial quadrant of a commercial or ‘for profit’ organisation. The quadrant may include measures that show how well an organisation is being run at the operating level and how well it is being run from the shareholder point of view. Although both perspectives rely on measurements of cash flow and profitability, they will have a different focus. It is likely that operational level analysis would start with operating profit before interest and tax whereas the shareholder analysis is likely to be centred on earnings after all such charges have been included.
There are a plethora of measures and a considerable ongoing debate about the most appropriate financial indicators. The Financial Times’ publication, ‘Financial Performance Measurement and Shareholder Value Explained’ provides a thorough review of the various measures and their respective strengths and weaknesses.6
5 The Measures of Success: Developing a Balanced Scorecard to Measure Performance.(available on Audit Scotland web site: www.audit- scotland.gov.uk)
6 Warner,A., Hennel,A. (1998), Financial Performance Measurement and Shareholder Value Explained,London, Financial Times Management
The preceding table highlights that whilst a number of the measures may be useful performance indicators they are of limited use as drivers of shareholder value. Stakeholder ratios can also be resolved into two main groups; ratios derived from the organisation’s accounts and ratios that link the organisation’s accounts and stock market values. The following table gives a brief overview of these measures. For readers wanting a more detailed explanation the Financial Times guide will again prove very useful.
Operational Measures Ratio
Profit and Return on Sales (ROS)
Operating profit/
Sales income
Return on Capital Employed (ROCE) Capital Employed = Fixed Assets + Stock + Debtors – Creditors
Explanation
Perhaps the simplest and most widespread operational measure in the private sector is profit or return on sales (ROS). It is calculated by expressing the operating profit as a percentage of the sales income. Operating or trading profit is simply the monies left once the costs of producing and selling the product have been deducted from the sales income. As all the numbers come from the profit and loss account it is relatively easy to calculate and it can be used by managers to give a high level indication of progress and competitive position.
Return on capital employed is a more
comprehensive measure than return on sales as it links the operating profit to the capital invested. The ROCE is calculated by expressing the operating profit as a percentage of the capital employed. The term ‘capital employed’ is not tightly defined and this has given rise a wide range of labels and definitions including return on capital (ROC), return on investment (ROI) and return on net assets (RONA). Although different organisations tailor the definition of capital employed to reflect their particular environment, a simple and robust calculation is provided by the formula opposite.
ROCE, ROI, RONA provide a link between the balance sheet and the profit and loss account and the actions of increasing profit and reducing assets required to increase ROCE should also improve cash flows. However, the use of ROCE/ROI/ RONA ratios have a number of weaknesses that can mislead and distort decision making, particularly when linked to manager reward systems. Emmanuel & Otley (1990) highlight the major difficulties with these ratios and offer a number of alternatives.
Weaknesses
●ROS varies from industry to industry and it can be misleading if used to compare organisations.
●It concentrates solely on the profit and loss account and does not highlight cash flow or balance sheet issues.
●It does not give managers an insight into the investment required to generate the sales, interest paid, or tax issues.
●Increasing ROS does not necessarily lead to the creation of shareholder value.
●ROCE can be very misleading if used to compare organisations or divisions operating in different market segments or areas where differing accounting standards are applied.
●The issues of asset valuation and the treatment of acquired goodwill are problematic and unless fully explored may make valid comparisons very difficult.
●It can encourage managers to favour shorter-term strategies that reduce capital investment with a resulting negative impact on the future of the business.
●It is not a useful measure for organisations with low levels of tangible assets e.g. consultancy firms, recruitment agencies etc.
●There is little correlation between ROCE and shareholder value.
Shareholder Ratios
Ratios derived from the Public Accounts Ratio
Return on Equity (ROE) PAIT/
Ordinary share capital + Reserves
Earnings per Share (EPS) Earnings/Shares
Dividend Cover Earnings/Dividend
Explanation
Return on equity is quite similar to ROCE and is calculated by expressing the annual earnings as a percentage of the shareholders’ equity. The annual earnings are defined as the profit after interest, tax and all charges other than ordinary dividends. In this context equity is defined as the amount of cumulative share capital and retained profits that have been invested in the company since its foundation.
This very popular measure is calculated by expressing the annual earnings as a percentage of the average shares in issue during the year. It is a simple calculation and very much a favourite with stock market analysts and the boards of public companies as it gives a robust indicator of the market’s view of the company.
This is an important measure for shareholders who focus on dividends paid as it highlights the proportion of earnings paid out in dividend. It is usually expressed as a multiple.
Weaknesses
●It is only a useful measure for shareholders who have been with the company since its foundation.
●Like ROCE there can be problems with the valuation of fixed assets and variations in the treatment of goodwill.
●ROE does not take account of share value in the stock market.
●The correlation between ROE and shareholder value is relatively low.
●It is not a useful measure for comparing different companies as different companies are likely to have issued very different numbers of shares.
●It can encourage managers to manage stock market perceptions by holding back on the issue of new shares or by share buyback.
Ratios linked to Stock Market Information
Ratios based on stock market information can change every day as prices change to reflect market influences and perceptions. Whilst measures derived from published accounts can be influenced by managers, measures determined by stock market variables are much more difficult to manipulate.
One of the key components of any stock market derived measure is market capitalisation and this can be simply expressed as the product of the total shares issued and the current share price. It is a useful measure as it normally provides the starting point for calculating the sums required for mounting a take-over bid for a public company.
Price to Book Ratio
Market capitalisation/Shareholders’ equity
Price Earnings Ratio
Current share price/Earnings per share
Dividend Yield
Dividend per share/Current share price
The ratio is only useful for comparative purposes in the context of a specific market sector but as a general rule from the shareholder perspective, the higher the multiple, the better.
The price to earnings ratio is usually expressed as a multiple and is probably the most useful comparative measure in the stock market. It provides a useful indicator of future expectations and the higher the multiple the more the market expects of future performance. Price earnings ratios again provide the best comparisons when benchmarked against companies in the same market sector.
The dividend yield is expressed as a percentage. It is important to investors who are more interested in immediate income than capital growth.
Free Cash Flow
Although operational measures take account of operational cash flow, shareholders and analysts are likely to be more interested in full cash flow or, as it is sometimes called, free cash flow. The objective of calculating free cash flows is to assess what is available for shareholders before deciding on the distribution of discretionary profits. According to Hennel and Warner (1998) free cash flow analysis is a useful indicator if a company is generating enough cash to provide future value for its shareholders.
As one might imagine a negative or low cash flow projection may be an indication of trouble ahead. However, capital expenditure and the treatment of goodwill can distort the measure and analysts may attempt to account for any unusual fluctuations and normalise the capital expenditure figure.
A number of financial commentators have attributed the emphasis on cash to concerns and debates about the validity of conventional accounting measures and the issues
surrounding the treatment of goodwill in company accounts.
As a result of these concerns, analysts and business leaders evolved measures that embrace the more traditional profit indicators, cash flows and shareholder value. Perhaps the most prominent of these measures are economic value added (EVA) and market value added (MVA).
Economic Value Added (EVA) A good basic formula is
EVA = Post-tax profit – a charge on capital employed Although economic value added is heralded as a new measure, it is in reality a long established measure given a new acronym. In its original format the measure was called residual income (RI) and was in fairly widespread use in the USA in the early years of the 20th century. EVA and RI are closely linked by their objective of ensuring that the total costs of resources consumed in the period, including the cost of capital, are included in any profit calculation.
As a result of the focus on the cost of capital the EVA measure is very useful for bringing balance sheet issues into the profit and loss account and consequently raising their profile with managers. Unlike some of the more traditional measures which are expressed as multiples or percentages, EVA is expressed in actual monetary values and consequently can be a very meaningful management objective.
EVA can also be a very useful measure for evaluating whether new opportunities, business streams or investments will add value to a business. It can also send out a strong signal to analysts that the company has a strong focus on preserving or growing shareholder value. However, it is worth noting that despite its many benefits EVA is not a simple measure to understand. There can be a wide variation in the factors included in calculating profit and capital employed. Hennel and Warner (1998) report that a leading consultancy has identified 'a possible 164 adjustments which can be applied to the profit or capital employed numbers before arriving at EVA.’
Market Value Added (MVA)
The following formula has been generally accepted:
Current MVA = Present value of future EVAs
MVA is similar to both EVA and the price to book ratio. MVA is expressed as a money surplus rather than as a multiple and is a robust measure of value created. It can give a very clear indication of the link between shareholder value and management actions, and is generally accepted as a better indicator of longer term potential than EVA.
Lehn and Makhija (1996) provide a useful overview of EVA and MVA as well as providing an interesting insight by linking EVA and MVA to the rate of removal of Chief Executive Officers. Fera (1997) also provides a good overview of EVA and MVA and how they can be used as a tool for evaluating strategic choices.
2.3 The Customer Quadrant
In today’s competitive markets, the key emphasis for most executives will be the customer. Many organisations have taken up the challenge of focusing on customer satisfaction, identifying customer needs and re-engineering their business capabilities from the customer interface. Many of the inspiring mission statements formulated by organisations will emphasise a commitment to delighting the customer at every turn. If these goals are to be achieved in a profitable business context, organisations need to monitor and manage their interaction with their chosen customer base. In the public sector there is, at least conceptually, the requirement for a customer focus and this is clearly outlined in
contemporary government policies and their emphasis on stakeholder participation. (Many public sector organisations are uncomfortable with the word ‘customer’ and prefer to think in terms of recipients of their services, citizens, or stakeholders).
The objectives recorded within the Customer quadrant of the Balanced Scorecard may be both contemporary and future orientated. They may relate to both existing and potential customers and markets. Table 3 provides some examples of customer objectives and measures. Measures of customer satisfaction record the success the organisation has achieved to date in pleasing its existing customer base with its products and services. These measures may be collected through appropriate customer surveys. Measures of customer loyalty and retention can provide management with an insight into longer-term trends in its association with these customers. Measures of attitudes towards the organisation and levels of recognition within selected segments of the public can help identify markets for the future.
The key to selecting the most appropriate Customer quadrant objectives and measures is the identification of ‘customer value propositions’ that will meet the needs of chosen customer segments. In his best selling book Competitive Advantage: Creating and Sustaining Superior Performance, management guru Michael Porter states:
‘An organisation’s competitive advantage grows
fundamentally out of the value a firm is able to create for its buyers that exceed the firm’s cost of creating it. Value is what buyers are willing to pay’.
(Porter, 1985)
Porter (1980; 1985) describes how buyer value is created and imparted into goods and services through an organisation’s value chain and how, in a competitive market, that value is made representative within the price paid at the time of purchase. From the customer’s perspective, however, it should be remembered that ‘value’ is experiential. Public sector organisations also have value chains and ‘leading edge’
thinking in public organisations, such as the NHS, is
encouraging health care providers to consider their service as it might be perceived by the patient travelling along the chain. The case study of English Nature in the Appendices, describes how it set about mapping and clarifying its value chain.
A customer’s perception of the value received from the purchase will vary over the consumption lifespan of the product or service in question. The Customer quadrant of the Balanced Scorecard may be used to shed light on the customer’s perception of the ‘value’ they receive from the attributes of the products or services that they purchase or receive.
To achieve sustained competitive success however,
companies need to be focusing on far more than their current products and customers. Companies should strive to
continually surprise their customers with products which meet needs that they never even knew they had (Hamel and Prahalad, 1996:118). In competing for future success, organisations need to be continually developing the value propositions to be made available to their customers for years to come.
2.4 The Internal Business Processes Quadrant
The Internal Business Processes perspective is about ‘doing’.
Objectives and measures in this quadrant of the Scorecard focus on the operational aspects of an organisation’s activity.
Non-financial measures are commonly used for monitoring operational processes; for example, in terms of quality, timeliness and output volumes. Such measures, in conjunction with activity based costing systems, provide a mechanism for control and improvement of an organisation’s processes. It is in this quadrant that public sector
organisations are likely to include measures relating to service delivery.
For the commercial company enhanced operational processes are a necessary but not sufficient condition for competitive success. In his 1996 Harvard Business Review article, ‘What is Strategy?’ Michael Porter draws a clear distinction between the need for operational effectiveness and strategic positioning. He notes that:
‘The quest for productivity, quality, and speed has spawned a remarkable number of management tools and
techniques: total quality management, benchmarking, time-based competition, outsourcing, partnering, re- engineering, and change management. Although the operational improvements have often been dramatic, many companies have been frustrated by their inability to translate those gains into sustainable profitability… A company can outperform rivals only if it can establish a difference that can be preserved’.
In the Balanced Scorecard of a commercial business, the Internal Business Processes objectives and measures should not focus solely on enhancing processes per se but should also focus on those capabilities that deliver competitive advantage. The objectives and measures should cover such areas as bringing new products to the market, production operations, logistics and delivery channels. Corporations in the computer industry for example, seek competitive advantage through the rapid development of new products that effectively make current products obsolete. Other manufacturing organisations may seek to differentiate their products on the basis of longevity and reliability and may need to focus on low-defect production quality measures and objectives. By contrast, Stalk, Evans and Shulman (1992) emphasise the way in which supply chain logistics capabilities can become the heart of competitive strategy in the retail industry. Within the financial services industry, objectives and measures relating to delivery channel usage are playing an increasing role in identifying competitive strategies.
2.5 The Learning and Growth Quadrant
The Learning and Growth quadrant focuses on enabling the organisation. The objectives within this perspective deal with the cultivation of an infrastructure for future development and organisational learning. These objectives deal with the strategic investment in people, processes, information systems and organisational culture. The identification of the key strategic measures to be used in this quadrant represents a challenge for management. Although most businesses would agree with the logic of investing in skills training and efficient information systems, it is not always clear how to identify the strategic significance of ‘soft’ issues such as team motivation, creativity cultures and knowledge management.
Table 3 provides some examples of objectives and measures within the Learning and Growth quadrant.
Kaplan and Norton suggest that Learning and Growth measures should deal with issues of employee skills, motivation, and organisation alignment and information systems capabilities. In their research of US corporations, however, they discovered that the Learning and Growth quadrant was the most under-utilised. In 1996 they concluded that,
‘When it comes to specific measures concerning employee skills, strategic information availability, and organizational alignment, companies have devoted virtually no effort for measuring either the outcomes or the drivers of these capabilities’(1996a: 144).
With issues such as human capital (Stewart, 1997), employee empowerment (Simons, 1995), and the ‘strategizing’
contribution of the individual (Hamel, 1996) increasingly on the management agenda, the Learning and Growth quadrant has an important role to play in the control of modern business. In their best selling book, Competing for the Future, business professors Gary Hamel and C.K. Prahalad (1996) put another slant on this notion of an enabling infrastructure.
They suggest that the key to competitive success over time is to cultivate hard to replicate core competencies that can be leveraged to make a disproportionate contribution to customer-perceived value. Core competencies are defined in terms of bundles of skills and technologies that are resident across an entire organisation (Prahalad and Hamel, 1990). A core competence represents the sum of learning across individual skill sets and individual organisational units’
(Hamel and Prahalad, 1996:223).
The Learning and Growth perspective may therefore be applied to monitor the acquisition, cultivation and exploitation of core competencies (Aisthorpe et al, 1998).
With an enabling infrastructure in place, the organisation will need to apply this potential into developing the key internal processes at which it must excel in order to meet its customer objectives or service delivery agreements.
2.6 Outcome Measures and Performance Drivers In the Balanced Scorecard there are generally two types of measures. The first are sometimes referred to as ‘outcome measures’ because they describe the results of past actions, such as the utilisation of resources or activities performed.
This type of measure is normally found in the ‘higher’
quadrants of a traditional Scorecard – Financial and
Customer. The second are referred to as ‘performance drivers’
because they represent hypotheses about actions that will determine or influence future outcomes. For example, if we improve staff training we will retain customers and earn higher margins. Well-designed Scorecards will attempt to combine outcome measures and performance drivers within and between quadrants.
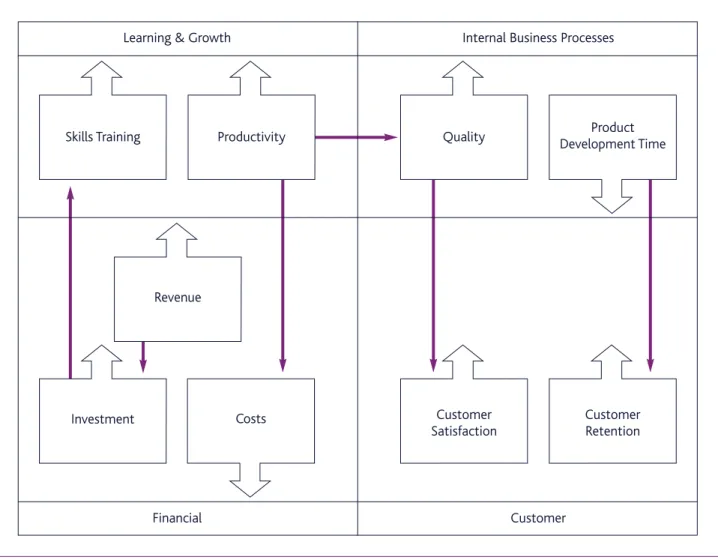
2.7 Linking the Quadrants: Cause and Effect Relationships Kaplan and Norton’s (1996a) research highlights the cause and effect linkages between the measures in the various quadrants. When designing Scorecards, attention needs to be given to the understanding of cause and effect linkages.
Figure 4, overleaf, shows some hypothetical linkages that may exist between performance measures in the various
quadrants. For example, it may be hypothesised that an increase in production quality may flow through into a rise in customer satisfaction measures.
Some relationships between measures may be verified through experience and analysis. The perception of the validity of the linkages will often be strongly influenced by the time allowed for the desired effect to materialise. For example, solving a shortage of staff in an NHS hospital by implementing training may take several years; whilst reducing product development time could quite quickly influence customers’ perceptions of a commercial organisation.
Although cause and effect terminology can make linkages seem deliberate and positive, this may not in fact be the case.
It is unlikely that managers will be able to anticipate all the effects of their actions and there may well be some
unexpected and negative side effects. Organisations will need to remain watchful and ready to respond.
Each quadrant of the Scorecard reflects a key focus and the measures in each quadrant should be selected such that there are no ‘perverse’ measures; i.e. measures do not conflict with each other. However, it should not be assumed that all of the measures must necessarily be related to each other. As Olve et al (1999) comment,
‘If we could relate all measures to each other, then we could put a monetary value on computer literacy or customer service for example’.
Kaplan and Norton (1996a) emphasise the Financial quadrant as the focus of all the objectives in the three other quadrants and, for many organisations, the Financial quadrant may also determine the pace at which strategic change can take place.
For example, if an organisation needs to generate cash flow, this will set the priority for action. Similarly, if a public organisation is in danger of overspending its budget, it may have to compromise certain objectives and prioritise its actions.
Key Points:
●The Balanced Scorecard encourages managers to consider a portfolio of both financial and non financial measures.
●Balanced Scorecard measures are linked to the organisation’s strategic objectives.
●The generic Balanced Scorecard contains four quadrants: Financial; Customer; Internal Business Processes; Learning and Growth.
●Contemporary Scorecard designs increasingly reflect the importance of the customer’s (or citizen’s) perspective.
●Balanced Scorecard measures should reinforce each other.
Figure 4: Hypothesising Linkages between Scorecard Measures
Learning & Growth Internal Business Processes
Financial Customer
Skills Training
Investment
Revenue
Productivity Quality
Customer Satisfaction
Customer Retention Product Development Time
Costs