a copy to be downloaded by an individual for the purpose of research and private study only. The thesis may not be reproduced elsewhere without the permission of the Author.
Vitamin D status and relationship between vitamin D and risk factors of metabolic syndrome: A study in Taiyuan City in China
A thesis presented in partial fulfillment of the requirements for the degree of
Master of Science in
Human Nutrition
at Massey University, Manawatu, Palmerston North New Zealand
Xiaoning Yan
2014
i
Abstract
Background
Vitamin D deficiency is widespread, and the residents in Taiyuan City in China seem to be at high risk of vitamin D deficiency. The situation might be because the city is located in north China and air pollution in the city is heavy. Meanwhile, emerging evidence suggests that vitamin D deficiency may be associated with prevalence of metabolic syndrome (MetS), which usually progress to diabetes and increases the risk of cardiovascular disease. MetS has been becoming much more common in China, and even affects younger people.
Objectives
This study investigated the vitamin D status of non-manual workers living in Taiyuan City; and explored the relationship between vitamin D status and markers of MetS in 200 participants attending the Health 100 Check-up Center in Taiyuan City for their usual health check.
Methods
In this cross-sectional study; 200 non-manual workers aged 20-80 years old, living in Taiyuan City were recruited. The participants had their serum vitamin D levels measured and were asked questions about their lifestyle, including daily exercise, alcohol use and smoking. The Check-up Center provided data relating to MetS of the participants. These data included anthropometrics (height, weight and body circumferences), biochemical data (lipid profiles and fasting glucose from blood samples taken for the check-up) and blood pressure.
Results
Seventy eight percent of participants had vitamin D values less than 50 nmol/L. The women’s serum 25-hydroxyvitamin D (25(OH)D) status (median; 32.70 nmol/L (upper and lower quartile; 25.80, 43.80)) was significantly lower than that of the men (44.00 nmol/L (32.30, 55.40)) (p<0.01). In females aged younger than 40 years vitamin D status (29.25 nmol/L (24.05, 40.85)) was significantly lower than older
ii
participants (age>65). In the present study, multiple linear regressions showed the determinants of the vitamin D status were female gender, smoking, and increased fasting glucose (p<0.05). The prevalence of MetS, or abdominal obesity between the groups with and without vitamin D insufficiency were not significantly different (p=0.08; p=0.07). Multiple logistic regression analysis showed that vitamin D status was not associated with MetS.
Conclusions
Vitamin D insufficiency was highly prevalent in non-manual workers in Taiyuan City in China during the winter season. Vitamin D status in the women was lower than the men. Among the females, younger women had worse vitamin D status than the older women. So, in the present study, female gender, increased fasting glucose, and smoking were significant determinants for vitamin D insufficiency. Vitamin D insufficiency was not associated with the risk factors for MetS in the present study.
However, female gender, increased waist circumference (WC), and raised serum triglycerides were associated with higher risk of MetS.
iii
Acknowledgement
I would very much like to first express my sincere gratitude to my supervisor, Associate Professor Jane Coad for giving me the opportunity to be in this project. It could not have happened without you. I would also like to extend my appreciation and respect to you for your insights, knowledge and endless support, guidance, understanding and patience during my study. Especially, when I encountered grave difficulties in the period of data collection, and when I was trapped in house hold affairs, you tolerated the stagnation of the study and gave me much encouragement and trust. It was your encouragement and trust that made me rally and carry through the study. Thank you for everything!
I would also like to express my heart-felt gratitude to my supervisor, Dr. Jasmine Thomson. Your knowledge, instruction, guidance and serious attitude gave me great encouragement and help.
I am most grateful to the General Manager of Health 100 Check-up Center, Ms.
Rengli Yue and all her colleagues for the great help in the data collection and biochemical tests.
I sincerely thank Xiaofeng, Zhongling, Jingjing, Ivy, Phoebe, Lily and other friends here at New Zealand and China for your help in the study and warm friendship in life.
Most importantly, my deepest thanks to my husband, Huijun and my daughter, Ranran; you are the source of my strength and courage. I greatly appreciate that we
have shared the same ideas, passion and dream. Love is with us forever.
iv
Table of Contents
Abstract ... i
Acknowledgement ... iii
Table of Contents ... iv
List of tables ... vi
List of figures ... vii
List of abbreviations ... viii
Chapter 1. Introduction ... 1
1.1 Background ... 1
1.2 Significance of the study ... 3
1.3 Hypotheses ... 4
Chapter 2. Literature review ... 5
2.1 Overview to vitamin D ... 5
2.1.1 Sources and synthesis of vitamin D... 5
2.1.2 Vitamin D hydroxylation ... 7
2.1.3 Vitamin D receptor ... 9
2.1.4 Vitamin D binding protein ... 9
2.1.5 Functions of vitamin D ... 10
2.1.6 Definitions of vitamin D status ... 11
2.1.7 Vitamin D status in people worldwide ... 13
2.2 Overview of metabolic syndrome (MetS) ... 16
2.3 Vitamin D and metabolic syndrome ... 19
2.3.1 Vitamin D and obesity ... 19
2.3.2 Vitamin D and insulin resistance ... 25
2.3.3 Vitamin D and hypertension ... 33
2.3.4 Vitamin D and dyslipidemia ... 41
2.4 Vitamin D measurement ... 48
2.4.1 Challenges and needs on vitamin D measurement ... 48
2.4.2 Different types of assay ... 49
2.5 Summary ... 55
Chapter 3. Materials and methods ... 57
3.1 Study design ... 57
3.1.1 Collection of qualitative data ... 57
3.1.2 Collection of quantitative data ... 58
3.1.3 Blood biochemical markers ... 59
3.2 Study sample ... 60
v
3.3 Recruitment of the participants ... 61
3.4 Ethics ... 61
3.5 Statistical analysis ... 62
Chapter 4. Results ... 63
4.1 General characteristics ... 63
4.2 Vitamin D status ... 64
4.3 Multiple linear regression analyses of 25(OH)D concentration ... 66
4.4 The relationships between vitamin D and the components of metabolic syndrome ... 67
4.4.1 Comparison of 25(OH)D concentrations by body mass index ... 67
4.4.2 Comparison of serum 25(OH)D concentrations by waist circumference ... 67
4.4.3 Comparison of 25(OH)D concentrations in people with or without metabolic syndrome. ... 68
4.4.4 Prevalence of MetS, obesity and central obesity in different 25(OH)D levels ... 68
4.4.5 Comparison of various parameters in different vitamin D levels ... 69
4.4.6 Multiple logistic regression analyses of metabolic syndrome ... 70
Chapter 5. Discussion ... 73
5.1 Introduction ... 73
5.2 Interpretation of the results ... 73
5.2.1 The 25(OH)D status of the participants ... 73
5.2.2 Women had lower vitamin D status than men ... 75
5.2.3 Women under 40 years had the worst vitamin D status ... 76
5.2.4 Determinants of the 25(OH)D status ... 76
5.2.5 The relationship between serum vitamin D and the components of metabolic syndrome ... 78
5.3 Limitations and self-reflection ... 81
5.4 Conclusions ... 82
Reference list ... 83
Appendix 1 ... 115
Appendix 2 ... 117
Appendix 3 ... 124
Appendix 4 ... 126
Appendix 5 ... 129
vi
List of tables
Table 2.1 Definitions of vitamin D status* ... 11
Table 2.2 Definition of MetS by WHO, ATP ċ, IDF and CDS ... 17
Table 2.3 Randomized controlled trials on the influence of vitamin D on obesity markers. ... 23
Table 2.4 A summary of RCTs on the effect of vitamin D supplementation on adiponectin ... 29
Table 2.5 A summary of RCTs on the effect of vitamin D3 supplementation on blood pressure. ... 37
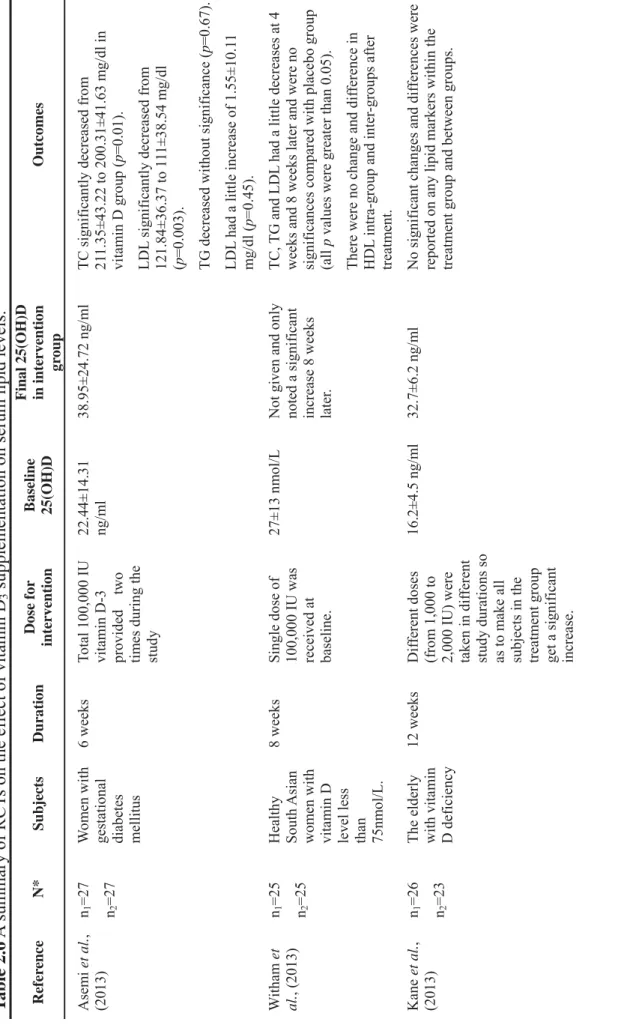
Table 2.6 A summary of RCTs on the effect of vitamin D3 supplementation on serum lipid levels. ... 44
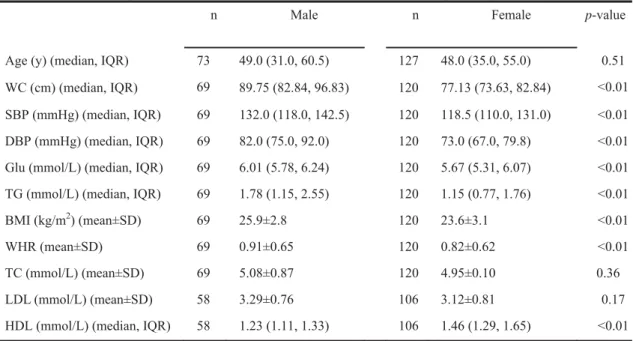
Table 4.1 Descriptive and biochemical characteristics of the participants ... 63
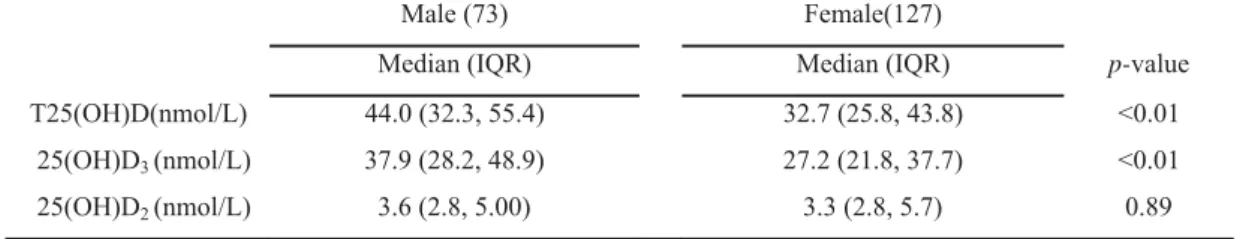
Table 4.2 Mean values of 25(OH)D in males and females ... 64
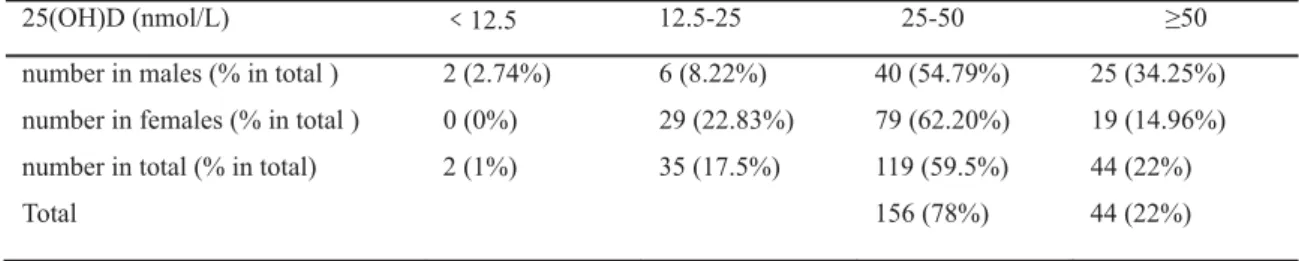
Table 4.3 Numbers and constituent ratios of 25(OH)D in males and females ... 65
Table 4.4 Comparisons of total 25(OH)D (nmol/L) by age rang in males and females ... 65
Table 4.5 The large multivariate model analysis for 25(OH)D concentration ... 66
Table 4.6 Multiple linear regression analysis for 25(OH)D concentration ... 67
Table 4.7 Comparisons of 25(OH)D (nmol/L) by BMI in males and females (n) ... 67
Table 4.8 Comparison of 25(OH)D (nmol/L) status by WC in males and females ... 68
Table 4.9 Comparison of 25(OH)D (nmol/L) status by MetS in males and females . 68 Table 4.10 Prevalence of MetS, obesity and central obesity in different vitamin D levels ... 69
Table 4.11 Comparison of variables in different 25(OH)D levels ... 70
Table 4.12 The large multivariate model analysis for MetS ... 71
Table 4.13 Multiple logistic regression analysis for MetS ... 71
vii
List of figures
Figure 1.1 Map of China ... 3
Figure 2.1 Synthesis of vitamin D3 and the skeletal and extra-skeletal effects of vitamin D, derived from (Kannan & Lim, 2014) with permission from John Wiley and Sons. ... 9
Figure 2.2 Potential mechanisms for cardiovascular risk factors and vitamin D deficiency, derived from (Lee et al., 2008), with the permission from Elsevier. ... 16
viii
List of abbreviations
1,25(OH)2D 1,25-dihydroxyvitamin D
7-DHC 7-Dehydrocholesterol
25(OH)D 25-hydroxyvitamin D
25(OH)-epi-D Epimer of 25-hydroxyvitamin D
ATP National Cholesterol Education Program
BMI Body mass index
BP Blood pressure
CDS Chinese Diabetes Society
CPBA Competitive protein binding assay
CVD Cardiovascular disease
DBP Vitamin D binding protein
DBS Dried blood spot
DEQAS Vitamin D External Quality Assessment Scheme
DM Diabetes mellitus
EIA Enzyme immunoassay
FINS Fasting insulin
FM Fat mass
FPG Fasting plasma glucose
Glu Glucose
HC Hip circumference
HDL-C High density lipoprotein cholesterol
HOMA Homeostasis model assessment
HPLC High performance liquid chromatography IDF International Diabetes Federation
IFG Impaired fasting glucose
IGT Impaired glucose tolerance
IR Insulin resistance
IS Insulin sensitivity
LC-MS/MS Liquid chromatography-tandem mass spectrometry LDL-C Low density lipoprotein cholesterol
ix
MetS Metabolic syndrome
MUHEC Massey University Human Ethics Committee mVDR Membrane vitamin D receptor
NCEP National Cholesterol Education Program
NA-CLPBA Nichols advantage-automated protein binding assay
nVDR Nuclear vitamin D receptor
PD Peritoneal dialysis
PTAD 4-phenyl-1,2,4-triazoline-3,5-dione
PTH Parathyroid hormone
OR Odds ratio
RAS Renin-angiotensin system
RCT Randomized controlled trial
RMP Reference measurement procedure
SMD Standardized mean difference
SPF Sun protect factor
RIA Radioimmunoassay
T2DM Type 2 Diabetes mellitus
TC Total cholesterol
TG Triglycerides TNF-Į Tumor necrosis factor-Į
UV Ultraviolet
VDR Vitamin D receptor
WC Waist circumference
WHO World Health Organization
WHR Waist circumference/hip circumference ratio
1
Chapter 1. Introduction
1.1 Background
Vitamin D is a fat-soluble vitamin that is produced when ultraviolet rays from sunlight strike the skin and trigger vitamin Dsynthesis. Vitamin D is also naturally present in some foods like oily fish and sun-dried mushroom (Holick, 2008b). The vitamin D from skin synthesis or digestive tract enters the blood circulation and is hydroxylated by a specific enzyme forming 25-hydroxyvitamin D (25(OH)D) in the liver. 25(OH)D is the main circulating form of vitamin D in the body. It is not bio-active but its serum concentration reflects the nutritional status of vitamin D. So, vitamin D status is assessed by the serum concentration of 25(OH)D. The 25(OH)D is formed in the liver then reaches the kidney via the circulation. In the kidney, 25(OH)D is further hydroxylated to form dihydroxyvitamin D (1,25(OH)2D), which is the active metabolite in the body. 1,25(OH)2D binds to the vitamin D receptor (VDR) in target cells to form a vitamin-receptor complex, which has its biological effect via gene expression.
It is well known that the characteristic biologic roles of vitamin D are to affect the bone, kidney and small intestine to regulate the metabolism of calcium and phosphorus (DeLuca & Zierold, 1998). However, the finding that many tissues synthesize 1,25(OH)2D, and that VDR is extensively expressed throughout the body, led to the concept that adequate vitamin D levels are important for many non-skeletal functions in the body, including the cardiovascular and immune systems (Holick, 2008a; Brandenburg et al., 2012). Emerging data indicated that 1,25(OH)2D might play a role in immunoregulation, cellular proliferation, differentiation, and inducing apoptosis procedures by direct or indirect gene regulation (Holick, 2008a;
Agmon-Levin et al., 2013; Luong & Nguyen, 2013). So, vitamin D deficiency could be a pathological condition for many diseases, including cardiovascular disease (Abu el Maaty & Gad, 2013), cancer (Sun et al., 2011; Hollis et al., 2013; Yousef et al., 2013) and autoimmune diseases (Agmon-Levin et al., 2013). Inversely, sufficient vitamin D status could be beneficial to the cardiovascular system. Both animal and human studies provided support for 1,25(OH)2D restraining renin synthesis,
2
improving insulin sensitivity and strengthening cardiac contractility (Y. C. Li et al., 2004; Xiang et al., 2005; Kayaniyil et al., 2010; Matias et al., 2010; Vaidya &
Williams, 2012; A. M. Belenchia et al., 2013). So, optimizing vitamin D status was suggested to be protective to reduce cardiovascular disease (CVD) risks, including obesity, insulin resistance, hyperglycemia, dyslipidemia, and hypertension. These risk factors are the well-known components of metabolic syndrome (MetS). That means vitamin D deficiency could be a potential risk factor of CVD by promoting progression of MetS, or could be a confounder for current CVD risk assessment. So, in that sense, it is necessary to identify the vitamin D status and its associations with the components of MetS in adults.
Metabolic syndrome (MetS) is a cluster of risk factors for cardiovascular events, including abdominal obesity, insulin resistance, hyperglycemia, hypertension, lowered high density lipoprotein-cholesterol (HDL-C), raised low density lipoprotein-cholesterol (LDL-C) and triglycerides (TGs) (Alberti et al., 2005). The diagnostic criteria for MetS are slightly different depending on the different international medical organizations. However, abdominal obesity and insulin resistance or impaired glucose tolerance or diabetes are agreed to be the central components in all of the diagnostic criteria. The causes of MetS are various;
long-term unhealthy lifestyle is one of most important promoting factors (Kwasniewska et al., 2009). Many studies, especially observational studies, have identified that hypovitaminosis D is associated with MetS. However, most of the randomized, controlled trials (RCT) have been inconsistent. So the relationship between vitamin D and MetS is obscure.
In China, there have been very few specialized surveys which have investigated Chinese people’s vitamin D status. However, from the limited studies carried out so far, the status of serum vitamin D in different groups of Chinese people was alarming (Zhang et al., 2013). Meanwhile, MetS is also becoming much more common in China, even affecting younger people (Fu & Prasad, 2014; Ming et al., 2014).
3
1.2 Significance of the study
China is vast in territory and its topography is varied and complicated. Different regions have different quantity of sunlight. Taiyuan city is a typical industrial city, which is located in Loess Plateau in north China (Figure 1) and 38 degrees north latitude. Its climate is typical mainland monsoon and has four distinct seasons. In winter, the maximum and the minimum temperatures are 5 degrees above zero and minus 10 degrees below zero, respectively. The average daily sunshine duration in winter is about 5.5 hours. The city also lacks special locations and facilities for the large population to do outdoor exercises. Together with the heavy air pollution and haze in winter caused by industry and burning coal for heating, the city surroundings are not suitable for outdoor physical activity. Therefore, it is of interest to investigate the vitamin D status of residents living in Taiyuan City. However, as far as the current author knows, there have been no studies evaluating their vitamin D status.
The present study determined the serum vitamin D concentrations of 200 adult volunteers, to provide an initial evaluation of the vitamin D status of people living in
Taiyuan.
Figure 1.1 Map of China, retrieved from: www.china.mike.com
Taiyuan
4
MetS is a social health problem of concern in China. The relationship between vitamin D status and MetS has been studied elsewhere and is still controversial worldwide. However, there were a limited number of studies that explored the health consequences of low vitamin D status and the relationship between vitamin D status and MetS in Chinese people. The present study explored the relationship in the adults in Taiyuan city in China. The regular parameters of MetS components, including blood lipid profiles, fasting blood glucose, blood pressure, waist circumference, body mass index were collected. Also, daily smoking, alcohol drinking and physical exercise were collected and analyzed in the study. So, the study will provide background to the further studies in this area and possible policy modification regarding the improvement of vitamin D status.
The aims of the present thesis are to determine the vitamin D status of the adult group in Taiyuan city in China and to examine whether there is a relationship between the vitamin D status and MetS in these participants.
1.3 Hypotheses
The major null hypotheses (H0) for the present study were:
H01: General population living in Taiyuan City will have sufficient serum vitamin D concentrations.
H02: Insufficient vitamin D serum concentration is not associated with the risk of metabolic syndrome.
5
Chapter 2. Literature review
The objective of this review is to thoroughly examine the published literature on the relationship between vitamin D and the components of metabolic syndrome. The topics of the review include physiology of vitamin D in humans, relationships between vitamin D deficiency and metabolic syndrome, and measurement of vitamin D. The focus of the discussion is evidence from observational and interventional studies.
2.1 Overview to vitamin D
2.1.1 Sources and synthesis of vitamin D
The primary source of Vitamin D is synthesis of vitamin D3 in the skin on exposure to sunlight. One study showed that the average individual synthesises 80% of their total vitamin D from sunlight (Nowson & Margerison, 2002). However, many factors would affect vitamin D3 synthesis in people. Specifically, the intensity of ultraviolet B (UV-B) is a critical factor affecting synthesis of vitamin D3. It was said that 20 mJ per cm2 was the threshold of UV-B exposure for synthesis of pre-vitamin D in the skin (Bender, 2003). Low intensity radiation, for example, below 20 mJ per cm2, did not produce significant pre-vitamin D3. Thus, some regions above 40o latitude in winter are not likely to receive sufficient UV-B intensity which will result in insufficient vitamin D status of the population. In northern China for example Taiyuan City, spring and summer are sunny and rainless. However in winter, there is low daily intensity of UV-B radiation, together with heavy air pollution, which hinders some UV-B radiation, so it is estimated that a significant number of local residents are likely to have vitamin D insufficiency and deficiency.
There are multiple external factors affecting vitamin D synthesis in the skin. UV-B dose is a critical one. A randomized controlled trial (Bogh et al., 2011) compared the plasma 25(OH)D in different groups who had similar baseline 25(OH)D levels before and after UV-B exposure of different dose and duration. The results showed that the increase in 25(OH)D3 production was positively related to UV-B dose rather
6
than dose rate. In other words, optional vitamin D3 synthesis might be generated by the appropriate UV-B dose. Longer exposure does not increase production of pre-vitamin D3 and increases the risk of DNA damage to the skin (Lehmann &
Meurer, 2010). Ozone and cloud cover also decrease the intensity of UV-B radiation by absorbing and scattering photons (Kimlin, 2008). However, it has been suggested that sunlight is not absolutely essential for vitamin D synthesis in the skin, because UV-B can penetrate clouds. About 50% of UV-B radiation penetrates complete cloud cover and reaches the earth surface (Bender, 2003). Other factors, which affect the amount of UV-B received include time of day, different seasons, latitude and altitude, (Kimlin, 2008). Furthermore, in some countries, health information emphasizing sun safe practices and advocating sunscreen to protect from melanoma could result in decreased vitamin D3 synthesis. Publicity like this enhances fear about exposure to sunlight in some people, which could lead to them having compromised vitamin D status (Houghton et al., 2010). In fact, Kennedy (2003) found that lifetime sun exposure was not associated with developing malignant melanomas. So, although excessive sun exposure without using sunscreen should be avoided, always using sunscreen and avoiding any sun exposure is not encouraged, because one study demonstrated that a sunscreen of 8 SPF could absorb most of the UV spectrum involved in pre-vitamin D3 synthesis, therefore significantly compromising the production of vitamin D (Matsuoka et al., 1987). In addition, dark skin or veiled dressing in some cultures hinders them from receiving enough solar radiation despite plentiful ambient sunlight therefore leading to a lower vitamin D status.
The second source of vitamin D is diet. However, there are few foods containing noteworthy amounts of vitamin D, except for some oily fish like salmon, mackerel and fish oil, etc. (Holick, 2008b) and a few foods of animal origin, like dairy fat, egg and lean meat (Shrapnel & Truswell, 2006). In addition, some plants contain natural vitamin D2, such as sun-dried mushroom (Holick, 2008b). However the content in plants is small, so it is not possible to meet vitamin D requirements from dietary sources. Vitamin D fortified foods and vitamin D supplements are another source.
However, at present, there are no vitamin D fortified foods available in China except for infant formula milk powder, but these vitamin D fortified foods may be available in other countries. With regard to vitamin D supplements, only large-dose vitamin D
7
preparations are available in some medical and health institutions and these are only used to deal with severe pathological conditions in China. For example, dihydroxyvitamin D was often used for the patients with chronic kidney disease to improve their vitamin D status and suppress secondary hyperparathyroidism (Cheng, 2014). Furthermore, there are some calcium supplements and multivitamin supplements containing low doses of vitamin D.
2.1.2 Vitamin D hydroxylation
7-Dehydrocholesterol (7-DHC, provitamin D3) is an intermediate in the synthesis of cholesterol, which is abundant in the basal and suprabasal layers of the skin. When the skin receives UV-B light irradiation, 7-DHC undergoes isomerization and transforms into precalciferol (pre-vitamin D3). Then, the pre-vitamin D3 undergoes a structural rearrangement and becomes cholecalciferol (calciol, vitamin D3). The whole process is fast; about 50% of pre-vitamin D3 transforms vitamin D3 within 2.5 hours in the skin (Lehmann & Meurer, 2010). Once formed, vitamin D3
immediately enters extracellular space and diffuses from epidermis into dermal capillary bed. In the circulation, vitamin D3 quickly combines with vitamin D binding protein (DBP) and is transported to the liver for further hydroxylation (Lehmann & Meurer, 2010; Henry, 2011).
In the liver, vitamin D3 is hydroxylated at the C25-position of the side chain to form 25-hydroxyvitamin D3 (calcidiol, 25(OH)D3), which is the main circulating form.
The hydroxylation process is catalyzed by a microsomal cytochrome P450 enzyme CYP2R1 and/or the mitochondrial cytochrome P450 CYP27A1. In addition, other P450-dependent hydroxylases were recently found to exert vitamin D 25-hyydroxylase activities, including CYP2C11, CYP3A4, CYP2D25 and CYP2J3.
However, these enzymes might have different biological activities in different populations or species (Prosser & Jones, 2004). Once formed in human body, 25(OH)D3 enters the circulation and binds to DBP which is transported to the kidneys (Lehmann & Meurer, 2010; Henry, 2011).
In the kidneys, 25-hydroxyvitamin D3 is further hydroxylated to 1,25-dihydroxyvitamin D3 (calcitriol, 1,25(OH)2D3) by several hydroxylases. This
8
form is the active metabolite of vitamin D in the body. CYP27A, CYP27 in mitochondria and 1Į-hydroxylase in microsomes are three cytochrome P450-dependent enzymes in the kidneys that catalyze the 1-hydroxylation of 25-hydroxyvitamin D3. Of these, the microsomal enzyme is synthesized in response to parathyroid hormone so as to improve the production of 1,25(OH)2D3. On the contrary, its synthesis is suppressed by increased concentration of 1,25(OH)2D3. So, it seems that the microsomal 1Į-hydroxylase is the most important enzyme in controlling production of 1,25(OH)2D3 (Bender, 2003).
Another enzyme in the kidney is calcidiol 24-hydroxylase, which hydroxylates both calcidiol and calcitriol. This enzyme is synthesized in response to calcitriol, and its function counters the 1Į-hydroxylase. The two kinds of the calcidiol hydroxylase jointly regulate the synthesis of calcitriolso as to increase the 24-hydroxycalcidiol production when the calcitriol production is more than physiological requirement.
The formation of 24-hydroxycalcidiol is thought to be a pathway for inactivation of calcitriol (Bender, 2003). This finding needs more evidence to support it.
Most vitamin D is excreted by the bile. Only a minor part is catalyzed to other metabolites and excreted in urine (Bender, 2003).
9 Figure 2.1 Synthesis of vitamin D3 and the skeletal and extra-skeletal effects of vitamin D, derived from (Kannan & Lim, 2014) with permission from John Wiley and Sons.
2.1.3 Vitamin D receptor
Vitamin D receptor (VDR) mediates the effects of 1,25(OH)2D moderating its biological functions. There are two types of VDRs: the membrane vitamin D receptor (mVDR) and the nuclear vitamin D receptor (nVDR) (Haussler et al., 2011). The former mainly takes part in the regulation of calcium and phosphorus and the latter acts on target genes after combining with 1,25(OH)2D and affecting the expression of the structural genes which affect biological functions. However, many polymorphisms have been found in VDR genes in humans, which affect the biological function of vitamin D. These might be associated with incidence of some diseases, such as osteoarthritis, cancer, cardiovascular diseases, diabetes, renal diseases, and autoimmune disorders (Valdivielso & Fernandez, 2006).
2.1.4 Vitamin D binding protein
The vitamin D binding protein (DBP; Gc-globulin) is a member of the albumin family and it is predominantly produced in the liver. It is responsible for transporting
10
the majority (85-90%) of vitamin D and its metabolites in the circulation, including cholecalciferol, calcidiol, calcitriol and 24-hydroxycalcidiol (Daiger et al., 1975).
Among them, calcidiol and 24-hydroxycalcidiol have higher affinity for the DBP than the other two. Because of the differences in primary structure, there are three types of Gc-globulin: Gc-2, Gc-1 slow and Gc-1 fast. Gc-globulin has unusually high circulating concentrations compared to other hormone binding proteins (Haddad, 1995). Its concentration reaches up to 6mmol/L while most of the others are below 1mmol/L, for instance, the concentration of thyroxine binding protein is 300 ȝmol/L and that of cortisol binding protein is 800ȝmol/L (Bender, 2003). Also, saturation of Gc-globulin with vitamin D derivatives is very low. Only about 2% to 5% of the binding sites are occupied under physiological conditions. This situation is important in protection against vitamin D intoxication (White & Cooke, 2000). It is thought that Gc-globulin might exert other physiological functions; this still needs more exploration. Furthermore, the concentration of Gc-globulin might impact on vitamin D levels. Under some conditions, Gc-globulin would change in quantity, affinity with its ligands, and its biological functions (Yousefzadeh et al., 2014). For example, Gc-globulin gene polymorphisms are extensively distributed in different groups (Malik et al., 2013). The polymorphisms produce Gc-globulin with different structures, which are not so effective in transporting vitamin D in the blood stream and so could lead to lowered vitamin D levels. This is thought to be related to some diseases, such as some cancer, inflammation, and autoimmune diseases (Chun, 2012;
Yousefzadeh et al., 2014).
2.1.5 Functions of vitamin D
1,25(OH)2Dis the bio-active form of vitamin D and its classic function is involved in bone metabolism. 1,25(OH)2D combines VDR in the intestine to stimulate the formation of epithelial calcium channels, which significantly promote calcium absorption (Christakos et al., 2011). When the serum calcium concentrations decrease to below the normal level, 1,25-(OH)2D is stimulated by parathyroid hormone to promote the maturation of osteoclasts, which release calcium ions into the blood stream from bone tissue (DeLuca & Zierold, 1998). Also,1,25-(OH)2D promotes the absorption of phosphorus which assists in the formation of calcium hydroxyapatite in the bone tissue (DeLuca & Zierold, 1998). Therefore, vitamin D
11
deficiency is associated with skeletal diseases, such as rickets in infants, osteoporosis in adults, bone pain, even osteomalacia and increased risk of fracture (Holick, 2008b).
In conclusion, vitamin D is crucial to bone health from infancy to old age.
Meanwhile, vitamin D has multiple extra-skeletal functions. The discovery of extensive expression of vitamin D receptor (VDR), not only in the kidneys, but also in the breast, colon, brain, prostate, macrophages and other tissues, indicates the complex and diverse biological roles of vitamin D in the human body (Holick, 2008a). Accumulating evidence shows that vitamin D might be involved in numbers of biological processes, such as cellular proliferation, differentiation, anti-angiogenesis and inducing apoptosis, regulating immunity, improving glucose metabolism and other roles (Holick, 2008a). Accordingly, vitamin D deficiency might be associated with many extra-skeletal diseases, including infections, allergies, cancer, obesity, insulin resistance (IR), diabetes mellitus (DM) and cardiovascular diseases (Zittermann & Gummert, 2010). Among these diseases, obesity and IR are the critical pathological links to metabolic syndrome (MetS) (Fujita, 2007; Gallagher et al., 2010). So, with the increasing incidence of MetS, the relationship between vitamin D and MetS has become a topic of concern worldwide.
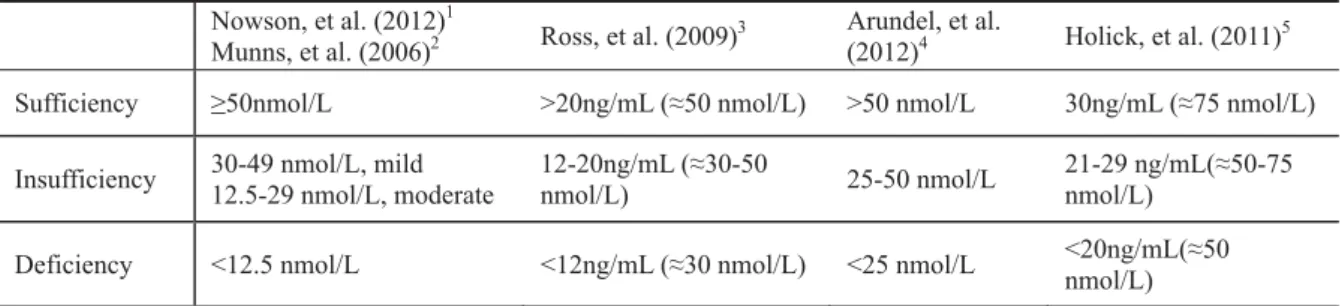
2.1.6 Definitions of vitamin D status
The definitions of vitamin D status are still controversial. The different cutoff values of 25(OH)D sufficiency and deficiency are presented in Table 2.1.
Table 2.1 Definitions of vitamin D status*
Nowson, et al. (2012)1
Munns, et al. (2006)2 Ross, et al. (2009)3 Arundel, et al.
(2012)4 Holick, et al. (2011)5 Sufficiency 50nmol/L >20ng/mL (§50 nmol/L) >50 nmol/L 30ng/mL (§75 nmol/L) Insufficiency 30-49 nmol/L, mild
12.5-29 nmol/L, moderate 12-20ng/mL (§30-50
nmol/L) 25-50 nmol/L 21-29 ng/mL(§50-75 nmol/L)
Deficiency <12.5 nmol/L <12ng/mL (§30 nmol/L) <25 nmol/L <20ng/mL(§50 nmol/L)
*To convert 25(OH)D concentration from ng/mL to nmol/L multiply by 2.459.
1. Working Group of the Australia and New Zealand Bone Mineral Society, Endocrine Society of Australia and New Zealand. 2. Working Group of the Australasian Paediatric Endocrine Group, Paediatric Bone Australasia. 3. Institute of Medicine. 4. British Paediatric and Adolescent Bone Group. 5. The Endocrine Society
12
Besides the cutoff values in Table 2.1, there are other recommended definitions of vitamin D sufficiency. The Warsaw conference, held in Warsaw, Poland, 2012 (http://www.witaminad.waw.pl/), reached a consensus on the optimal vitamin D concentrations, which were considered to be 30-50ng/mL (70-125nmol/L) in the Central European population (Pludowski et al., 2014). This range of vitamin D suficiency was determined according to evidence of 30-50ng/mL vitamin D concentrations being significantly associated with reduced risk of non-skeletal disease. However, this definition is used in a limited scope currently.
The rationales of the different opinions on 25(OH)D sufficiency or deficiency were mainly based on the effects of vitamin D on mineral homeostasis, bone health, and muscle functions (Holick et al., 2011; Nowson et al., 2012). Also, the factors affecting the vitamin D status and the evidence associating vitamin D levels with non-skeletal disease were considered. A suggestion of setting the threshold values specifically for age groups was also put forward. A study reported that for healthy postmenopausal women, when the average concentration of vitamin D was increased from 50.1 to 86.5nmol/L, calcium absorption correspondingly increased from 45% to 65% (Heaney et al., 2003). By contrast, another study found that a decrease of average vitamin D concentrations from 122 to 74 nmol/L did not lead to apparent changes in calcium absorption (Barger-Lux & Heaney, 2002). There was also evidence to suggest that bone density would be increased with serum vitamin D concentrations above 80nmol/L in elderly women (Devine et al., 2002). So, it was queried how much vitamin D was sufficient to exert both skeletal and non-skeletal functions, at least for postmenopausal women.
Similarly, another study found that 60nmol/L might be a better cutoff of vitamin D sufficiency for young children, because vitamin D concentration minimizing the parathyroid level was around 61nmol/L (Houghton et al., 2010). It was also asserted that parathyroid hormone concentration plateaus when vitamin D is within 75-100nmol/L (Holick, 2006). It is unclear whether there is any difference in the satisfactory level of vitamin D between children and adults. It is also unclear what the optimal values of 25(OH)D for the musculoskeletal system are, and the obscure relationship between vitamin D and diseases have led to inconsistent classifications
13
of vitamin D status.
The inaccuracy of the vitamin D assay methods was another reason for the inconsistency in classifications of vitamin D sufficiency or deficiency. The study conducted by Looker et al. (2002) defined vitamin D deficiency and insufficiency as
<17.5 nmol/L and <62.5 nmol/L, respectively to account for potential impact of the measurement error of radioimmunoassay (RIA) assay adopted in the study.
So, it seems necessary to gather more evidence to standardize the cutoff values of 25(OH)D status, especially those studies exploring non-skeletal functions of vitamin D above 50nmol/L. Increasing accuracy and precision of vitamin D assays is also essential. Moreover, reference serum values for a population should take more factors into account, possibly including age, living location, season and race, which are the main determinants of vitamin D status (Mithal et al., 2009).
2.1.7 Vitamin D status in people worldwide
Vitamin D deficiency is estimated to affect approximately 30-50% of people worldwide (Lee et al., 2008). Possibly, more than one billion people have vitamin D deficiency or insufficiency worldwide (Holick, 2008a). A survey from USA (NHANESċ) reported that 25% to 57% of American adults in lower latitude areas in winter and 21% to 58% in higher latitude areas in summer had vitamin D insufficiency, which was defined as less than 62.5 nmol/L (Looker et al., 2002).
The study also reported that more severe deficiency, defined as 17.5nmol/L, occurred in African Americans compared with other races (Looker et al., 2002). In Europe, it was estimated that most residents living in Central and Western Europe had vitamin D levels below 30-50 ng/mL of optimal values, which were consensus on the Warsaw conference (Pludowski et al., 2014). However, this value range for optimal vitamin D status was higher than that of other guidelines. In New Zealand, Rockell et al.
(2006) conducted a survey of 2,946 participants aged 15 and older and reported 48%
were lower than 50 nmol/L and 84% were lower than 80 nmol/L. Particularly, Pacific and MƗori people had lower vitamin D status. Their mean 25(OH)D concentrations
14
were 37 nmol/L and 42 nmol/L, respectively. For South Asian women living in Auckland, up to 84% of participants had insufficient vitamin D levels (<50 nmol/L) (P. R. von Hurst et al., 2010). For pregnant women and children, the situation might be more severe. A study (Judkins & Eagleton, 2006) of pregnant women in Wellington reported that vitamin D deficiency was very prevalent in the group, affecting women of all ethnicities in New Zealand. Sixty one percent of those surveyed had 25(OH)D concentrations less than 25 nmol/L. Rockell et al. (2005) investigated children aged 5-14 years and reported that 41%, 59% and 25% of Maori, Pacific, and New Zealand European and Others had vitamin D insufficiency (<37.5 nmol/L). Children living in Dunedin also had high prevalence of vitamin D insufficiency (<50 nmol/L) and 10% of those living in Auckland had vitamin D deficiency (< 27.5 nmol/L) (Grant et al., 2009; Houghton et al., 2010). Surveys from other countries, such as Korea, Japan, India, Iran, Canada, Australia, and Brazil presented similar situations, with high prevalence of insufficiency of serum 25(OH)D in different groups and ethnicities (Newhook et al., 2009; Hirani et al., 2013; Maeda et al., 2013; Yoshimura et al., 2013; Faghih et al., 2014; G & Gupta, 2014). So, vitamin D deficiency or insufficiency has become common in all ages and ethnicities worldwide, even in sunny areas like Singapore (Hawkins, 2009). It must be noted that the results of the above studies indicated the prevalence of vitamin D insufficiency to some extent; however, the results were not comparable, because the
definitions of vitamin D sufficiency and deficiency used were different.
In China, there was also no consensus on the definitions of vitamin D sufficiency or deficiency. Most studies in China defined vitamin D sufficiency in adults or elderly as >50 nmol/L, and defined vitamin D insufficiency and deficiency as <50 nmol/L and <25 nmol/L, respectively. However, for children and adolescents, the definitions of vitamin D sufficiency were inconsistent. Some adopted >75 nmol/L, others adopted >50 nmol/L. Nonetheless, vitamin D insufficiency is prevalent in most areas.
The vitamin D status in elderly was poor, surveys from northern cities, such as Beijing and Shenyang (40°N and 42°N, respectively), showed that the women over 60 years had 98.8% and 84.2% vitamin D insufficiency in the Spring season (Zhou et al., 2003; Wang et al., 2009). In Shanghai (31°N), the situation was also grim and 84% and 89% of older males and females had vitamin D insufficiency (Lu et al.,
15
2009). Even in Hong Kong (22°N), the reported prevalence of vitamin D insufficiency and deficiency in the elderly was 40.3% and 22.5%, respectively (Wat et al., 2007). For adults, the vitamin D status in south China seemed better than that in north China. One study compared young women living in Beijing (40°N) with those living in Hong Kong (22°N), reporting that the mean serum vitamin D value of Beijing women was much lower than that of Hong Kong women (p<0.0001). In addition, 40% and 18% of young women in Beijing and Hong Kong, respectively, had vitamin D levels less than 25 nmol/L (Woo et al., 2008). Furthermore, middle-aged women in a study in Shenyang (42°N) had serum vitamin D concentrations between 27.2-38.3nmol/L in winter (Zhou et al., 2010).
Children and adolescents in different areas also had high proportions of vitamin D insufficiency. In Hangzhou (30°N), Zhu et al. (2012) found that the prevalence of vitamin D insufficiency and deficiency was high in primary and secondary school students; 89.6% and 46.4% of the group had vitamin D levels less than 75nmol/L and 50nmol/L, respectively. Another study from Beijing reported 89% of adolescent girls had serum vitamin D values lower than 50nmol/L (Foo et al., 2009). In summary, vitamin D insufficiency is prevalent in Chinese. However, a large survey on a national scale, especially with good design and appropriate standardized methodology is needed to provide a clear picture of the situation in China.
It has been known that vitamin D deficiency is associated with some diseases, not only in the skeletal system, but also in the extra-skeletal system. Figure 2.2 briefly presents the potential relationships between vitamin D and cardiovascular risk factors, all of which are involved in the development of metabolic syndrome (MetS). In addition, the present review will focus on the relationship between vitamin D status and MetS in more depth.
16 Figure 2.2 Potential mechanisms for cardiovascular risk factors and vitamin D deficiency, derived from (Lee et al., 2008), with the permission from Elsevier.
2.2 Overview of metabolic syndrome (MetS)
MetS refers to a cluster of cardiovascular risk factors, mainly central obesity, impaired glucose regulation and diabetes, hypertension, and dyslipidemia, which appear gradually following the accumulation of excess abdominal fat (Fujita, 2007).
It also could be accompanied by a pathological state of chronic inflammation, oxidative stress and hypercoagulability, which gradually lead to endothelial damage, and eventually cardiovascular disease (Khoshdel et al., 2012). However, in the pathological state, obesity, especially intra-abdominal fat distribution, and the associated insulin resistance (IR) are thought to play critical roles in the progression of the components of MetS (Fujita, 2007). Essentially, MetS is the aggregate state of multiple risk factors for cardiovascular disease and individuals with MetS have a much higher risk of progressing to diabetes mellitus and cardiovascular disease.
However, the diagnostic criteria for MetS are inconsistent. Different international expert groups use different diagnostic criteria. The summary of these diagnostic criteria for MetS is presented in Table 2.2:
17
Table 2.2 Definition of MetS by WHO, ATP ċ, IDF and CDS
WHO (Alberti, 1998) ATP ċ (Alberti, 2009) IDF (Alberti, 2005) CDS (Chinese Diabetes Society)
Required DM, IFG, IGT, or IR & at
least two of the following: Any three of the
following: Required high WC by the
cutoffs* & at least two of the following:
Any three of the following:
x WHR0.9 in men, 0.85 in women;
x TG1.7 mmol/L or specific treatment for the lipid abnormality;
x BP140/90 mmHg or treatment of previously diagnosed hypertension;
x Urinary album excretion rate20 ȝg/minor,
albumin-to-creatinineratio30 mg/g.
x WC102cm in
men, 88cm in women;
x TG1.7 mmol/L;
x BP130/85 mmHg
or taking anti-hypertensive medications x HDL<1.03 mmol/L
in men
<1.29 mmol/L in women;
x Fasting Glu. 5.6 mmol/L.
x TG1.7 mmol/L or specific treatment for the lipid abnormality;
x BP130/85 mmHg or treatment of
previously diagnosed hypertension;
x HDL<1.03 mmol/L in men,
x <1.29 mmol/L in women, or specific treatment for the lipid abnormality;
x Fasting Glu. 5.6 mmol/L, or
previously diagnosed type 2 diabetes.
x BMI25kg/m2; x TG1.7 mmol/L;
x BP140/90 mmHg or taking
anti-hypertensive medications;
x Fasting Glu.6.1 mmol/L;
x HDL0.9 mmol/L in men,
1.0 mmol/L in women.
*Ethnic-specific cutoffs for waist circumference (WC): Europeans: WC94cm in men and 80cm in women; South Asians: WC90cm in men and 80cm in women; Chinese: WC90cm in men and
80cm in women; Japanese: WC85cm in men and 90cm in women.
MetS: metabolic syndrome; WHO: World Health Organization; ATP ċ: National Cholesterol Education Program---Third Adult Treatment Panel; IDF: International Diabetes Federation; CDS:
Chinese Diabetes Society; DM: diabetes mellitus; IFG: impaired fasting glucose; IGT: impaired glucose tolerance; IR: insulin resistance; WHR: the ratio of waist circumference/hip circumference;
WC: waist circumference; BMI: body mass index; TG: triglycerides; HDL: high density lipoprotein cholesterol; BP: blood pressure; Glu: glucose.
Some studies on adipocytes identified that visceral fat, rather than subcutaneous fat, produces angiotensinogen and proinflammatory cytokines, such as TNF-Į, IL-6, which are associated with the progression of insulin resistance and are positively related with adipocyte size (Qi & Pekala, 2000; Rahmouni et al., 2004). de Jongh et al. (2004) also demonstrated that obesity was associated with microvascular dysfunction, which might further relate to insulin resistance. On the other hand, a case-control study showed that insulin sensitivity, endothelial function and inflammatory response, which were evaluated 4.2±0.8 months after bariatric surgery, were significantly improved in morbidly obese patients compared with the control group (Vázquez et al., 2005). By contrast, liposuction on abdominal subcutaneous adipose tissue did not significantly affect insulin action or other obesity-related
18
metabolic abnormalities in patients, as reported by Klein et al. (2004). Carr et al.
(2004) undertook a cross-sectional study of healthy adults and concluded that intra-abdominal fat (IAF) could be regarded as an independent indicator of MetS, because the results of their study showed that the IAF of participants with MetS was significantly higher than those without MetS (166.3 vs. 79.1 cm, p<0.001) and IAF also was associated with the components of MetS, including the insulin sensitivity index. The above studies imply that excessive ectopic fat accumulation is the principle cause of insulin resistance.
Insulin resistance (IR) is broadly defined as the reduced biological effect of insulin.
IR has been generally thought to be an underlying pathophysiology that promotes the development of MetS and can be regarded as a predictor of MetS. Some studies confirmed these hypotheses (Carr et al., 2004; Reaven, 2011; Vonbank et al., 2011).
However, a recent study suggested an alternative hypothesis. Karnchanasorn et al.
(2013) showed that a statistically significant number of participants in the MetS group did not have IR; meanwhile, a statistically significant number of participants in the IR group were not diagnosed with MetS. Based on these results, Karnchanasorn et al. suggested IR is neither necessary nor required for MetS, although it is a risk factor for MetS. The study used homeostasis model (HOMA) to assess IR, which was often used for assessing individual’s IR, IS, and insulin ȕ-cell function worldwide currently. HOMA-IR is from log-transformed value of (FIN6×FPG)/22.5 (Matthews et al., 1985). However, the method seems to be more applicable for Caucasian original younger adults and might not be reliable for older adults and other races (Matthews et al., 1985). Together with other bias, such as participant selection bias, the conclusions of the study need to be further investigated before being accepted.
In summary, obesity, especially visceral obesity, and IR are considered to be critical aetiological factors that contribute to the genesis and development of MetS. Here, it is necessary to stress that no one factor can promote the disease solely and any disease must be the result of the combined action of multiple risk factors. So, MetS is definitely caused by multiple risk factors through multiple pathways and not just
19
obesity and IR.
The underlying treatment for MetS is altering lifestyle and diet; including adjusting dietary composition, exercising, losing weight, giving up smoking and drinking so as to reduce abdominal fat and improve insulin resistance (Duclos, 2007; Sun et al., 2012; Wakabayashi, 2014). For those individuals with hyperlipidemia, hyperglycemia and hypertension, treatment by effective medication is essential besides adjusting life style. Successful treatment mostly depends on whether the patient compliance of therapeutic schedule is good.
2.3 Vitamin D and metabolic syndrome
Recent epidemiological investigations have identified that the vitamin D level is reversely associated with the incidence of MetS.
2.3.1 Vitamin D and obesity
The prevalence of obesity has continued to rise for the past 30 years worldwide, which makes obesity a global public health problem. Obesity increases the morbidity and mortality of cardiovascular and cerebrovascular diseases. It also produces lots of social issues, such as increasing health care expenses, lowered quality of life, detriment to physical and mental health as well as discrimination (O'Hara & Gregg, 2006). However, the aetiology of obesity is a very complicated process, which could be affected by endocrine disorder, heredity, psychological pressure, living conditions and surroundings, and eating habits (Jebb, 1997; Racette et al., 2003). In recent years, researchers have found that some micronutrients, such as vitamin D, could play certain roles in the occurrence and development of obesity. Meanwhile, fat accumulation also might influence serum vitamin D concentrations.
2.3.1.1 Effects of obesity on vitamin D levels
As previously mentioned, abdominal obesity is the principal cause of MetS and affects body metabolism. Currently, most cross-sectional studies on different
20
populations have similar findings, which are that serum vitamin D levels in obese populations were significantly lower than those in non-obese populations (Arunabh et al., 2003; Parikh et al., 2004; Lagunova et al., 2009; Josefson et al., 2013). In a cohort study, the percentage of participants with vitamin D less than 75nmol/L in obese population was 80%, which was significantly higher than the proportion in the non-obese population (p<0.0001) (Hyppönen & Power, 2006). It was also reported that BMI and fat content even in non-obese people was negatively correlated with vitamin D levels (Arunabh et al., 2003; Blum et al., 2008). Besides, McGill et al.
(2008) studied 250 overweight adults and the results showed a decrease of 0.74 nmol/L (p=0.002) in vitamin D3 per 1 kg/m2 increase in BMI and a decrease of 0.29 nmol/L (p=0.01) per 1cm increase in waist circumference. A large bi-directional Mendelian randomization analysis of 21 adult-cohorts, totalling 42,024 participants, concluded that higher BMI led to lower 25(OH)D, but vitamin D had only a small effect on BMI after removing confounders’ influences (Vimaleswaran et al., 2013).
Based on these studies, it was concluded that vitamin D status is lower in obese population compared to people with normal weight. However, most of the studies related to the topic seem to be observational studies. More interventional trials are needed to see whether fat accumulation or decrease, affects vitamin D status.
2.3.1.2 The potential mechanism of fat effecting serum vitamin D level
The mechanisms for obesity affecting vitamin D level are controversial; but commonly accepted notions include the following: Firstly, vitamin D is fat soluble and easily trapped by adipose tissue which leads to a decrease in serum vitamin D in obese individuals. As early as 1971, Rosenstreich et al. (1971) found 80% of radioactive 14C labelling vitamin D was deposited quickly into adipose tissue in an animal experiment. In a clinical study (Wortsman et al., 2000), the obese group had a 57% lower increase in serum vitamin D compared to the non-obese, age-matched control group after they received equal ultraviolet irradiation. A study reported that the synthesis of provitamin D3 was not significantly different between the obese group and the non-obese group (Wortsman et al., 2000). That means that more subcutaneous fat in obese individuals may retain more 25(OH)D synthesized by the
21
skin and prevent it from being released into the blood stream, despite these obese individuals having more skin area exposed to ultraviolet irradiation. These studies suggest that fat tissue is a storage site of 25(OH)D and it seems that mobilizing 25(OH)D from fat tissue is very slow compared with vitamin D deposition which leads to lowered serum vitamin D in obese individuals.
Secondly, there is a much simpler explanation of volumetric dilution. Drincic et al.
(2012) explored the relationship between 25(OH)D concentration and body size, reporting no difference in serum 25(OH)D concentrations between the obese group and the non-obese group after the results were adjusted for body size. That means a larger fat mass could have a dilution effect on vitamin D levels in obese individuals.
Both proposed mechanisms would result in decreased serum vitamin D concentrations in obese people and reduced bioavailability on 25(OH)D. Based on the above studies, fat loss could result in increased serum vitamin D levels. A study conducted by Rock et al. (2012) in which 383 over-weight or obese women took part in a 2-year clinical study verified this point. The study reported that the participants with no weight loss during the study period had increased their mean serum vitamin D concentration by 1.9 ng/mL, while those with 5%-10% and more than 10% loss of baseline weight increased vitamin D concentrations by 2.7 ng/mL and 5.0 ng/mL, respectively. The results provided evidence to support the effect of fat on serum vitamin D level.
2.3.1.3 Effects of vitamin D on obesity
The proposed effects of vitamin D on obesity are even more controversial. Vitamin D was suggested to be a modulator of body weight and decreased vitamin D level in winter might stimulate the “winter response” of fat accumulation and abnormal metabolism, such as increased IR and blood pressure (Foss, 2009). Some observational studies provided evidence for this opinion (Brock et al., 2010;
González-Molero et al., 2013). However, not all researchers thought so. A cross-sectional study implemented by Creo et al. (2013) reported no relationship between vitamin D levels and BMI. Further, several RCTs were conducted to see if vitamin D supplementation affects BMI and other obesity markers. The summary of
22
the RCTs in recent years is shown in Table 2.3. Collectively, most of the RCTs did not show an effect of vitamin D supplementation on obesity. Only two RCTs (Anthony M Belenchia et al., 2013; Wamberg et al., 2013) showed the study groups had received a little benefit from vitamin D supplementation. Both studies indirectly reflected that vitamin D supplements improved obesity based on vitamin D effect on the ratio of leptin to adiponectin and PTH concentration, respectively. Noticeably, the RCT conducted by Belenchia et al. (2013) was the only study specifically designed to investigate the effects of vitamin D on markers of obesity, although it did not find significant changes in BMI and WC in adolescent subjects after 4,000 IU daily vitamin D3 was supplemented for six months. Furthermore, a meta-analysis based on 12 RCTs did not find that vitamin D supplementation affected the standardized mean difference (SMD) of BMI, fat mass (FM) and percentage fat mass (%FM) (Pathak et al., 2014). However, the efficacy of vitamin D supplementation on obese might only be evident if vitamin D is depleted in the body (Grimnes et al., 2011), while in most RCTs, the range of baseline vitamin D concentrations were broad. In addition, factors such as small sample size, inadequate dosage, short study duration, low compliance, not optimizing other nutrients limited accuracy of study result.
In summary, current research studies on the effects of vitamin D on obesity are inconclusive. However, the potential roles of vitamin D in the occurrence and development of obesity cannot be ignored, for some studies at the genetic level found that low plasma vitamin D levels might be a modest mediator between genetic variants associated with obesity and increased risk of diabetes (Afzal et al., 2014), which is strong rationale for more studies being done in future.
23
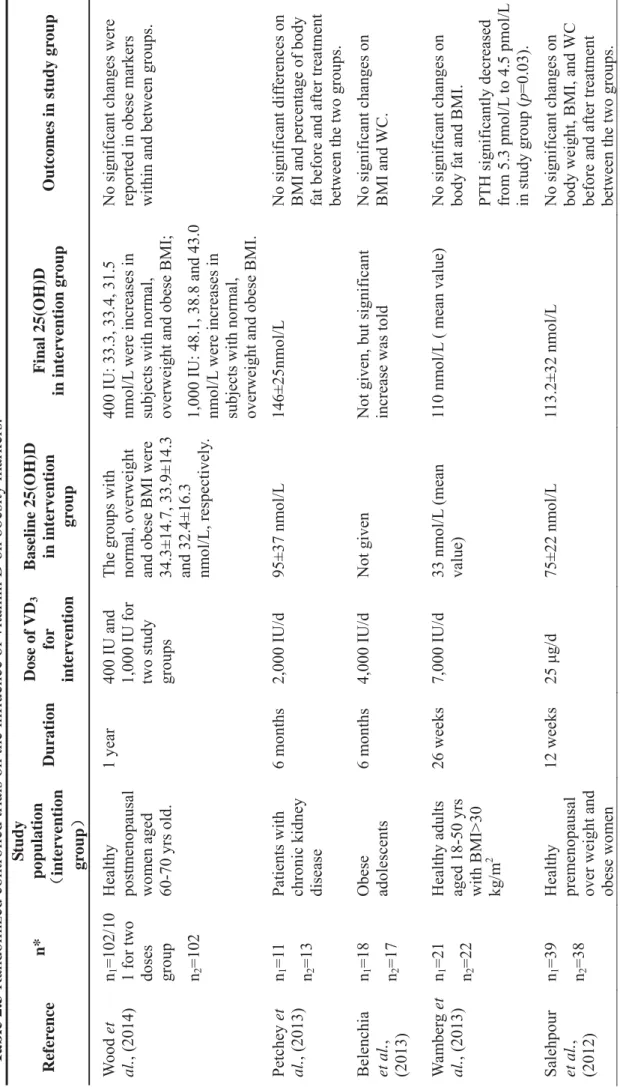
Table 2.3 Randomized controlled trials on the influence of vitamin D on obesity markers. Referencen*Study population ˄intervention group˅
DurationDose of VD3 for intervention Baseline 25(OH)D in intervention group
Final 25(OH)D in intervention groupOutcomes in study group Wood et al., (2014)n1=102/10 1 for two doses group n2=102
Healthy postmenopausal women aged 60-70 yrs old.
1 year 400 IU and 1,000 IU for two study groups The groups with normal, overweight and obese BMI were 34.3±14.7, 33.9±14.3 and 32.4±16.3 nmol/L, respectively.
400 IU: 33.3, 33.4, 31.5 nmol/L were increases in subjects with normal, overweight and obese BMI; 1,000 IU: 48.1, 38.8 and 43.0 nmol/L were increases in subjects with normal, overweight and obese BMI.
No significant changes were reported in obese markers within and between groups. Petcheyet al., (2013)n1=11 n2=13
Patients with chronic kidney disease
6 months 2,000 IU/d 95±37 nmol/L 146±25nmol/L No significant differences on BMI and percentage of body fat before and after treatment between the two groups. Belenchia et al., (2013)
n1=18 n2=17
Obese adolescents 6 months 4,000 IU/d Not given Not given, but significant increase was told No significant changes on BMI and WC. Wamberget al., (2013)n1=21 n2=22 Healthy adults aged 18-50 yrs with BMI>30 kg/m2
26 weeks 7,000 IU/d 33 nmol/L (mean value) 110 nmol/L ( mean value) No significant changes on body fat and BMI. PTH significantly decreased from 5.3 pmol/L to 4.5 pmol/L in study group (p=0.03). Salehpour et al., (2012)
n1=39 n2=38
Healthy premenopausal over weight and obese women 12 weeks 25 ȝg/d 75±22 nmol/L 113.2±32 nmol/L No significant changes on body weight, BMI, and WC before and after treatment between the two groups.
24
Referencen*Study population ˄intervention group˅
DurationDose of VD3 for intervention Baseline 25(OH)D in intervention group
Final 25(OH)D in intervention groupOutcomes in study group A significant decrease in fat mass was resulted in the study group compare with the placebo group (p<0.001). Ardabili et al., (2012)n1=24 n2=26
Women with polycystic ovary syndrome and vitamin D deficiency 2 months 50,000 IU, once every 20days.
6.9±2.8 ng/ml 23.4±6.1 ng/ml No significant changes and differences on body weight and BMI in and between the two groups. Gallagher et al., (2012)
Ntotal= 163, to 7 groups with different doses from low to high and a placebo group.
healthy, white, postmenopausal women aged 57 to 90 years 1 year Different doses of 400, 800, 1,600, 2,400, 3,200, 4,000, 4,800 IU per day.
38.2±9.4 nmol/L Not given, but the scatter diagram showed significant, gradual increases from low to high doses groups.
There was no significant interaction between BMI and dose of vitamin D3. von Hurst et al., (2010)
n1=42 n2=39
South Asian women aged 23-68 years, with IR and vitamin D insufficiency.
6 months 4,000 IU per day Median value =21 nmol/L Median value =80 nmol/L BMI did not change significa