ACTIVITY-BASED COST MANAGEMENT
and a craftsman in the field of advanced cost management.
Wiley Cost Management Series
Activity Accounting: An Activity-Based Costing Approachby James A. Brimson Activity-Based Costing: Making It Work for Small and Mid-Sized Companies,
Second Editionby Douglas T. Hicks
Activity-Based Management: Arthur Andersen’s Global Lessons from the ABM Battlefield, Second Editionedited by R. Steven Player and Roberto Lacerda
Activity-Based Management for Service Industries, Government Entities, and Nonprofit Organizationsby James A. Brimson and John Antos
Activity-Based Management in Daily Operationsby John Miller
Driving Value Using Activity-Based Budgetingby James A. Brimson and John Antos
Guide to Cost Managementby Barry Brinker
ACTIVITY-BASED COST MANAGEMENT An Executive’s Guide
Gary Cokins
John Wiley & Sons, Inc.
New York • Chichester • Weinheim • Brisbane • Singapore • Toronto
No part of this publication may be reproduced, stored in a retrieval system or transmitted in any form or by any means, electronic, mechanical, photocopying, recording, scanning or otherwise, except as permitted under Sections 107 or 108 of the 1976 United States Copyright Act, without either the prior written permission of the Publisher, or authorization through payment of the appropriate per-copy fee to the Copyright Clearance Center, 222 Rosewood Drive, Danvers, MA 01923, (978) 750-8400, fax (978) 750-4744.
Requests to the Publisher for permission should be addressed to the Permissions Department, John Wiley & Sons, Inc., 605 Third Avenue, New York, NY 10158–0012, (212) 850-6011, fax (212) 850-6008, E-Mail: [email protected].
This publication is designed to provide accurate and authoritative information in regard to the subject matter covered. It is sold with the understanding that the publisher is not engaged in rendering legal, accounting, or other professional services. If legal advice or other expert assistance is required, the services of a competent professional person should be sought.
This title is also available in print as ISBN 0-471-44328-X.
Some content that appears in the print version of this book may not be available in this electronic edition.
For more information about Wiley products, visit our web site at www.Wiley.com
Contents
Preface vii
1 Removing the Blindfold with ABC/M 1
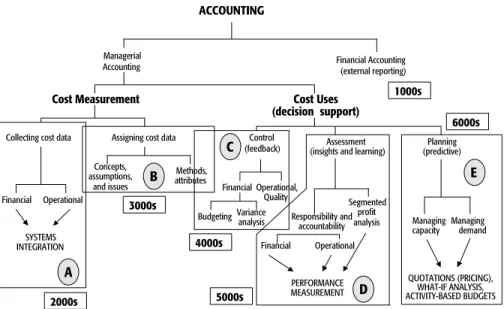
2 A Management Accounting Framework: A Taxonomy 32 3 Are All Your Trading Partners “Worth It” to You? 99 4 The Internet, E-Commerce, Supply Chain Management,
and Digital Economies: Where Does ABC/M Fit In? 149 5 The Holy Grail: Performance Measure Systems
That Produce the Correct Behavior 197
6 Popular Uses of ABC/M 226
7 ABC/M Integrates with Other Software Tools 279 8 Predictive Costing, Predictive Accounting 285 9 Implementing ABC/M Through Rapid Prototyping 325 10 Common Misconceptions about ABC/M and
Employee Buy-In 345
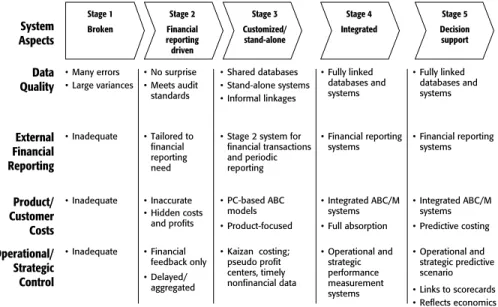
11 Stage Five Cost Systems: The Future of ABC/M 352
Appendix 360
Index 368
About the Author
Gary Cokins, CPIM, is an internationally recognized expert, speaker, and author in advanced cost management and performance improvement systems. He re- ceived a BS in Industrial Engineering/Operations Research from Cornell Uni- versity in 1971 and an MBA from Northwestern University’s Kellogg School of Management in 1974.
He began his career as a strategic planner with FMC Corporation. With FMC’s Link-Belt Division, he served as Financial Controller and then Production Manager, which exposed him to the linkages between cost information, opera- tions, performance measurements, and results. In 1981, he began his management consulting career with Deloitte & Touche (where he was trained by Eli Goldratt and Robert Fox and implemented Theory of Constraints (TOC) OPT software).
Next, with KPMG Peat Marwick, Gary implemented integrated business systems and ultimately focused on cost management systems, including Activity-Based Costing (ABC). While at KPMG Peat Marwick, he was trained on ABC by Prof.
Robert S. Kaplan of the Harvard Business School and by Prof. Robin Cooper.
Gary headed the Global Cost Management Consulting Services for Electronic Data Systems (EDS) from 1991 to 1996. More recently, he is Director of Indus- try Relations for ABC Technologies (www.abctech.com).
Gary was the lead author of the acclaimed An ABC Manager’s Primer spon- sored by the Institute of Management Accountants (IMA) and the Consortium for Advanced Manufacturers—International (CAM-I). His second book, Activity Based Cost Management: Making It Work, was judged by the Harvard Business School Press as “read this book first.”
Gary serves on performance management committees, including CAM-I, American Production and Inventory Control Society (APICS), the Supply Chain Council, the Council for Logistics Management (CLM), the Automotive Indus- try Action Group (AIAG), the IMA, Association for Management Information in Financial Services (AMI/FS), the American Society for Quality (ASQ), the So- ciety of Manufacturing Engineers (SME), and the American Institute of CPAs (AICPA). Gary was the co-editor of CAM-I’s 2001 Glossary of ABC/M Terms and is a member of Journal of Cost ManagementEditorial Advisory Board. Gary can be contacted at [email protected].
Preface
Sometimes luck beats planning. I have been fortunate in my professional career, a career that began in 1973 as an accountant and continued into operations man- agement and management consulting. Without realizing it—through a series of different jobs and management consulting assignments—I somehow earned a reputation as an internationally recognized expert in activity-based cost manage- ment (ABC/M). In truth, I am always learning new things about how to build and use managerial accounting systems. I’m not sure that any expert in ABC/M ex- ists. I’m just fortunate to have been formally working with ABC/M since 1988 when I was introduced to it.
I have already written two books about ABC/M, so why would I want to write another? There are several reasons:
• Since I wrote my last ABC/M book five years ago, a great deal of progress has occurred in the field. There has been a marked increase in the growth, accep- tance, and successes with ABC/M implementation by organizations of all sizes and in all industries and in most countries as well as in government and the public sector. As evidence, the attendance at ABC/M software companies’
customer conferences is almost exceeding the capacity of the largest hotel conference centers. They will need to be held at city convention centers.
• There is an increasing understanding that ABC/M provides information that integrates with a broad number of applications and decisions. ABC/M in isolation is not an improvement program—it is an enabler for other manage- rial methods and approaches to be effective. In some cases ABC/M data allow processes to be better performed and decisions to be better made. In other cases, they make decisions possible that were not before.
• I have personally recognized that the impediments that have been preventing ABC/M from exploding faster in growth and acceptance are the misconcep- tions about it. They range from false beliefs that ABC/M is monstrously large and complicated to misperceptions that it takes forever to implement.
These falsehoods must be replaced with the evidence that quickly imple- mented, non-complex ABC/M models ignite the best results. (The discussion on ABC/M Rapid Prototyping in Chapter 9 will reinforce my observations.)
• Poor ABC/M model design and architecture will inevitably lead to poor re- sults. Unfortunately, large ABC/M systems are sometimes flawed right from the beginning design steps. Hence, ABC/M regularly gets an undeserved black eye. Well, there is nothing wrong with ABC/M—the problem is with
the improperly designed structures. I believe that ABC/M is a craft—and I hope my book provides guidance to those with craftsman-like minds. Some accountants may have problems with this.
• The advanced and more mature users of ABC/M—those who have been re- calculating their ABC/M autopsy data (i.e., historical expenses) for several years—have pushed the ABC/M methodology to be applied to the future.
These advanced companies want to gauge the consequences of their deci- sions and scenarios. They want to know what will change based on pursuing alternatives available to them. This introduces the topics of predictive cost- ing and cost estimating. That may not sound exciting to some, but as the In- ternet spawns more e-trading market exchanges with auctions and bidding, rule-based decision making relying on ABC/M may become mission-critical for suppliers and service-providers in an e-commerce digital economy.
• Finally, I am writing another book because it is in me to do it. I have learned a lot since my last book was published. Some readers may dismiss some writ- ers as simply displaying ego rather than being of practical use. I’d like to think that my contribution to the field of managerial accounting originates from a sense of duty rather than ambition. I have now seen many ABC/M systems and have been comparing them. In short, I’d like to make a difference.
I enjoy constructing computer figures that illustrate the points I write about.
(Actually, it usually happens in reverse. I first create the diagram, then compose text for the picture that I drew.) My gift for visualizing and illustrating has ap- parently made my prior ABC/M books popular.
As you wander into my book, I want one key message, which may get mud- dled, to be stated up front so you can watch for it. That message is that manage- rial accounting is now transitioning into managerial economics. Many of those fuzzy questions about marginal costs, profits, and economics can finally begin to be answered using valid data with credible assumptions. And computer software and data are no longer the inhibitors to calculating results that they were in the 1990s. The technology problem has been solved. The major obstacle is not pro- ducing the cost math—it is in people’s thinking. It is how they frame a problem, make assumptions, and consider what they are really trying to do or solve with their cost information.
I begin this book by first discussing why there is an increasing interest in ABC/M (Chapter 1), immediately followed by some fundamental explanation of how one constructs an ABC/M Cost Assignment Network that models an orga- nization and becomes its repeatable reporting system (Chapter 2).
The expansion of costing beyond just products and base services into chan- nels, distribution, and customers enables customer contribution profit margins to be calculated and made visible. The managerial movement to manage profit mar- gins is addressed in Chapter 3. The Internet introduces new ramifications, par- ticularly the irreversible shift of power from sellers to buyers. Chapter 4 discusses
applying ABC/M across an entire supply chain of trading partners to improve profits and remove excess costs.
The output of an ABC/M calculation system is always an input into some- thing else. Chapters 5, 6, and 7 discuss the popular uses and applications of ABC/M data, including for balanced scorecard performance measurements, shared services management, unused capacity management, project management, and quality management. In short, ABC/M supports better decision making.
Chapter 8 gives a preview of where ABC/M is headed—its use as a predic- tive costing tool. In this chapter, I reconcile ABC/M with the Theory of Con- straints throughput accounting method. ABC/M is also revealed as the foundation for activity-based budgeting, a budgeting approach that is superior to today’s highly “political” approach.
Chapters 9 and 10 deal with the myths and misconceptions about ABC/M.
Chapter 9 describes a popular solution to implementing ABC/M in days, not months, that removes most of the mysteries: ABC/M Rapid Prototyping. It quickly produces results in contrast to long drawn-out ABC/M implementations.
Chapter 11 concludes my book with a crystal ball look that suggests that managerial accounting is evolving into managerial economics. And the force making this possible is not so much the high-speed computing horsepower of lap- tops and servers as much as it is better thinking about the dynamics and proper- ties of cost behavior made more understandable by ABC/M.
I write this book to focus the managerial accounting community’s attention on the thinking rather than the math. The margin for error for organizations is continuously narrowing, so I want ABC/M data and their uses to help people and organizations make better decisions and perform better and more in alignment with their defined strategy.
I am forever grateful to my wife, Pam Tower, who for the year I was writing this book allowed me to balance—and occasionally mis-balance—my job and family.
Gary Cokins
[email protected](I welcome your e-mail)
Preface ix
1
Removing the Blindfold with ABC/M
“Whoever is careless with the truth in small matters cannot be trusted with important matters.”
—Albert Einstein, German-Swiss-American scientist1
INTRODUCTION
Imagine that you and three friends go to a restaurant. You order a cheeseburger and they each order an expensive prime rib. When the waiter brings the bill they say, “Let’s split the check evenly.” How would you feel?
That is how many products and service lines “feel” when the accountants take a large amount of indirect and support overhead expenses and allocate them as costs without any logic. There is minimal or no link that reflects a true relative use of the expenses by the individual products, service lines, or end-users. This is unfair. Activity-based cost management (ABC/M) “gets it right.” It more fairly splits the waiter’s check. Many ABC/M practitioners wish the word allocation never existed. It implies inequity to many people based on past abuses in their or- ganization’s accounting practices. The word allocationeffectively means “mis- allocation” because that is usually the result. ABC/M practitioners will often say that they do not allocateexpenses; instead they trace and assignthem based on cause-and-effect relationships.
ABC/M can do much more than simply trace expenses and costs. It provides a tremendous amount of visibility for people to draw insights from and also use for predicting the possible outcomes of decisions. Many operations people cyni- cally believe that accountants count what is easily counted, but not what counts.
Outdated, traditional accounting blocks managers and employees from seeing the more relevant costs.
Important Messages for ABC/M Project Teams
It is a mistake for ABC/M project teams to refer to ABC/M as an improvement program or a change initiative. The ABC/M data are simply used as a means to an end. If ABC/M is described as an improvement program, it might be regarded by managers and employees as a fad, fashion, or “project of the month.” ABC/M data make visible the economics of the organization and its consumption of re- source expenses. Money is continuously being spent on organizational resources whether or not ABC/M measuring is present.
ABC/M is analogous to a physician’s stethoscope, which allows a doctor to lis- ten to one’s heartbeat. Your heart is beating regardless of the presence of the stetho- scope. Similarly, an organization is continuously burning up its resources through its activities into its outputs regardless of whether ABC/M is monitoring these events.
I am deliberately understating ABC/M for an important reason. In the early 1990s, when ABC/M was beginning to receive serious attention, the management consulting community began selling ABC/M engagements as consulting services.
Unfortunately the consultants oversold ABC/M as a magic pill that could possibly solve all of an organization’s problems (and perhaps solve world hunger, too). This raised management’s expectations too high. If the consultants did not solve the prob- lems that their clients engaged them for, some of those clients blamed ABC/M for not working. However, ABC/M worked just fine; some of the consultants just did not adequately understand how to interpret and use the data. Some did not know how to design and construct an effective ABC/M system. When one realizes that ABC/M is fundamentally good data to be used for understanding, discovery, and decision making, then it is better positioned for longer-term use and wider acceptance.
So I am deliberately managing expectations about ABC/M by reducing the perception that it provides all the answers. ABC/M restacks the costs; it does not root them out. ABC/M’s data can be a great enabler for providing answers; the key word here is enabler. One controller I met referred to ABC/M as the ultimate ques- tion generator. He observed that, equipped with the ABC/M data, employees and managers frequently had reactions like, “What would explain or account for that?”
Organizational improvement is referred to by a variety of terms, among them total quality management (TQM) and business process reengineering (BPR).
They all have one thing in common: a focus on continuing improvement of work and the pursuit of excellence in daily operations. Many of these programs em- phasize the following:
• Management of processes rather than resources;
• Elimination of waste;
• Improvement to processes that results in better, faster, and cheaper services to customers; and
• Empowerment of employees to create change.
A common thread runs through all these improvement techniques: a focus on work activities and their relationship to services or products provided to customers.
The ABC/M data can turbocharge these types of popular performance im- provement programs. It is inevitable that all organizations will eventually rely on some form of an ABC/M information system to assist in effectively managing their affairs. There is no reason to hype or overstate the power of ABC/M; it will continue to claim widespread global acceptance based on its merits and on the utility that the ABC/M information provides.
Organizational Shock from ABC/M
Ninety percent of ABC/M is organizational change management and behavior modifying, and 10 percent of it is the math. Unfortunately most organizations that implement ABC/M initially get those two reversed. They spend far too much time defining and constructing their ABC/M information system and very little time thinking about what their organization will do once they have their new ABC/M data. This is a huge problem.
This poor implementation habit has adversely affected the rate of adoption of ABC/M. When ABC/M systems fall short of manager and employee teams’ ex- pectations, it is usually because the initial ABC/M system design was substan- tially over-engineered. The typical initial ABC/M system is usually excessively detailed and is well past diminishing returns on extra accuracy for each incre- mental effort of work. One manager reacted to seeing the first ABC/M report by saying, “I feel like a dog watching television. I don’t know what I’m looking at!”
With a fraction of the effort and in a much shorter time frame, the implementa- tion team could have started to produce results.
It is important to start getting results quickly from ABC/M because of the or- ganizational shock that some managers and employees may experience when they receive the new ABC/M data. That is, it is important to start realizing what kind of new and possibly disturbing information might come from ABC/M.
When people see the ABC/M data for the first time, they will see things they have never seen before—and some of it will not be pretty. For example, there may be a product manager who for years believed that his or her products or ser- vice lines were the most profitable in the organization. But when ABC/M finishes more properly tracing the true consumption of expenses, that person’s product or service line may appear much less profitable than it did under the traditional broad cost averaging scheme, and perhaps even unprofitable! That product man- ager will not be happy to see that information or whoever is reporting that infor- mation. Do not underestimate the level of resistance that can come from exposing managers and employees to the ABC/M data.
There is an important lesson here: Treat the ABC/M data responsibly.
ABC/M is not an accounting police tool. It is an organization-wide managerial information system. Its data are not intended to embarrass anyone, and it should not be used to punish anyone. In many cases no one really knew what their true costs were. Many may have suspected that the existing expense and cost alloca- tion was wrong, but they did not know what the correct calculations would
Introduction 3
reveal. ABC/M finally gives managers and employee teams the hope that they can see the truth. But seeing the data and using the data are not the same thing.
Much more thinking is required when it comes to using the ABC/M data for man- aging and decision making.
There is an old saying that all truth passes through three phases:
1. It is ridiculed.
2. It is violently opposed.
3. It is accepted as being obvious.
Whether dealing with the ABC/M methodology itself or the output data com- puted by the ABC/M system, keep the following in mind: There will be resis- tance to ABC/M, due to people being afraid not so much of change—although that is a factor—as of uncertainty. The irony is that ABC/M brings truth, but until the ABC/M data are revealed, people are not sure what it is going to show or how it might be used.
In short, even if an activity-based cost model is in place, do not expect ABC/M to follow automatically. Using the data is a hurdle.
Overhead Expenses Are Displacing Direct Costs
The direct laborers in organizations are the employees who perform the frontline, repeated work that is closest to the products and customers. However, numerous other employees behind the frontline also do recurring work on a daily or weekly basis. These employees’ work is highly repeatable at some level, for example, a teller in a bank. Figure 1.1 is a chart that includes this type of expense plus the other two major expense components of any organization’s cost structure, its purchased materials and its overhead.
Most organizations are experienced at monitoring and measuring the work of some of the laborers who do recurring work by using cost rates and standard costs. In the bottom layer of the chart is cost information that also reveals per- formance-related costs other than the period’s spending, such as labor variance reporting. It is in this area of the chart, for example, that manufacturers use labor routings and process sheets to measure efficiency. These costs are well known by the name standard costs. Service organizations also measure this type of output- related information. For example, many banks know their standard cost for each deposit, each wire transfer, and so forth.
Problems occur in the overhead expense area appearing at the top portion of Figure 1.1. The chart reveals that over the last few decades, the support overhead expenses have been displacing the recurring costs. The organization already has substantial visibility of its recurring costs, but it does not have any insights into its overhead or what is causing the level of spending of its overhead. ABC/M can help provide for insights and learning.
In a bank, for example, managers and employee teams do not get the same robustness of financial information about the vice-presidents working on the sec-
ond floor and higher up in the building as they do about tellers. The only finan- cial information available to analyze the expenses of the vice presidents and other support overhead is the annual financial budget data. These levels of ex- penses are annually negotiated. The focus is on spending levels, not on the vari- ous cost rates. The expense spending is monitored after the budget is published.
Spending is only monitored for each department or function for each period to see if the managers’ spending performance is under or over their budget or plan.
ABC/M extends to the overhead the understanding and visibility of spending that is already applied to the recurring laborers. ABC/M can then become an or- ganization-wide method of understanding work activity costs as well as the stan- dard costs of outputs.
Impact of Diversity in Products, Service Lines, Channels, and Customers
When you ask people why they believe indirect and overhead expenses are dis- placing direct costs, most answer that it is because of technology, equipment, au- tomation, or computers. In other words, organizations are automating what previously were manual jobs. However, this is only a secondary factor in the shift in organizational expense components.
The primary cause for the shift is the gradual proliferation in products and ser- vice lines. Over the last few decades organizations have been increasingly offering
Introduction 5
The demand for overhead activities is not much linked to sales or production volume. It results from:
• The increasing diversity and complexity of products, services, channels, and customers
• Quality levels
A key to understanding ABC/M is to understand how cost behavior truly varies in relation to other factors.
Cost Components
Stages in the Evolution of Businesses
Integrated Old-fashioned Hierarchical
Changes in Cost Structure 100%
Overhead
Direct (recurring) Labor Material
1950s 1990s
Direct
0%
FIGURE 1.1 Overhead Costs Displacing Direct Costs
a greater variety of products and services as well as using more types of distribu- tion and sales channels. In addition, organizations have been servicing more and different types of customers. Introducing greater variation and diversity (i.e., het- erogeneity) into an organization creates complexity,and increasing complexity re- sults in more overhead expenses to manage it. So the fact that the overhead component of expense is displacing the recurring labor expense does not automat- ically mean that an organization is becoming inefficient or bureaucratic. It simply means that the company is offering more variety to different types of customers.
For those who may not be convinced by this explanation, go speak with an employee who has been in your organization a long time and is shortly due to re- tire. Ask him or her: “How thick was our product catalog when you joined the or- ganization and how thick is it now? What types of customers did the founder serve at the inception of our organization and how many more types do we serve now?” The explanation for increasing overhead will become evident.
In short, the shift to overhead displacing direct labor reveals the cost of com- plexity. ABC/M does not fix or simplify complexity; the complexity is a result of other things. But what ABC/M does do is point out where the complexity is and where it comes from.
How long can organizations go on making decisions with the misinformation reported by their accounting systems? In the 1980s many organizations, reacting to the pressures from high-quality Japanese products, confessed that they had a
“quality crisis.” In the twenty-first century, organizations may realize that they have an “accounting crisis.”
IF ABC IS THE ANSWER, WHAT IS THE QUESTION?
Growing Discontent with Traditional Calculation of Costs
Why do managers shake their heads in disbelief when they think about their company’s cost accounting system? I once heard an operations manager com- plain, “You know what we think of our cost accounting system? It is a bunch of fictitious lies—but we all agree to them.” It is a sad thing to see the users of the accounting data resign themselves to lack of hope. Unfortunately, many accoun- tants are comfortable when the numbers all foot-and-tie in total and could care less if the parts making up the total are correct. The total is all that matters, and any arbitrary cost allocation can tie out to the total.
The sad truth is that when employees and managers are provided with reports that have accounting data in them, they use that information regardless of its va- lidity or their skepticism of its integrity. Mind you, they are using the data to draw conclusions and make decisions. This is risky.
Imagine you were a roving reporter who asks managers and employee teams throughout your organization: “How happy are you with the existing financial and accounting data to support our decisions to improve our competitiveness?
Thumbs up or down?” Many would give the data thumbs down. These people
have basic needs such as knowing where their organization makes or loses money. It is amazing, but for many organizations the most fundamental questions get the poorest answers—or no answers.
How can traditional accounting, which has been around for so many years, suddenly be considered so bad? The answer is that the existing data are not nec- essarily bad so much as somewhat distorted, incomplete, and unprocessed. Fig- ure 1.2 shows the first hint of a problem. The left side shows the classic monthly responsibility-center statement report that managers receive. Note that the exam- ple used is the back office of an insurance company. This is to demonstrate that, despite misconceptions, indirect white-collar workers produce outputs no differ- ently than do factory workers.
If you ask managers who routinely receive this report questions such as
“How much of these expenses can you control or influence? How much insight do you get into the content of work of your employees?” they will likely answer both questions with, “Not much!” This is because the salary and fringe benefit costs usually make up the most sizable portion of controllable costs, and all that the manager sees are those expenses reported as lump-sum amounts.
When you translate those “chart-of-account” expenses into the work activities that consume the financial general ledger’s expenses, a manager’s insights from viewing the activity costs begin to increase. The right side of Figure 1.2 is the ABC/M view that is used for analysis and as the starting point for calculating the If ABC Is the Answer, What Is the Question? 7
Key/scan claims Analyze claims Suspend claims Receive provider inquiries Resolve member problems Process batches
Determine eligibility Make copies Write correspondence Attend training Total Claims Processing Department
Stating activities with an action verb-adjective-noun grammar convention creates an atmosphere for change by providing a new way of looking at something people
are already familiar with, rather than something that is foreign.
Salaries Equipment Travel expenses Supplies Use and occupancy Total
$621,400 161,200 58,000 43,900 30,000
$914,500
$600,000 150,000 60,000 40,000 30,000
$880,000
$(21,400) (11,200) 2,000 (3,900)
––
$(34,500)
Actual Plan Favorable/
(unfavorable) Chart-of-Accounts View
Chart-of-Accounts View From: General Ledger
Activity-Based View Activity-Based View To: ABC Database
$ 31,500 121,000 32,500 101,500 83,400 45,000 119,000 145,500 77,100 158,000
$914,500 Claims Processing Dept
When managers get this kind of report, they are either happy or sad, but they are rarely any smarter!
FIGURE 1.2 Language of ABC/M
Source:Gary Cokins, Activity-Based Cost Management: Making It Work, © 1996, McGraw-Hill.
Reproduced with the permission of The McGraw-Hill Companies.
costs for both processes and diverse outputs. In effect, the ABC/M view resolves the deficiencies of traditional financial accounting by focusing on work activities.
ABC/M is work-centric, whereas the general ledger is transaction-centric.
A key difference between ABC/M and the general ledger and traditional techniques of cost allocation (i.e., absorption costing) is that ABC/M describes activities using an “action-verb-adjective-noun” grammar convention, such as
“inspect defective products,” “open new customer accounts,” or “process cus- tomer claims.” This gives ABC/M its flexibility. Such wording is powerful be- cause managers and employee teams can better relate to these phrases, and the wording implies that the work activities can be favorably affected, changed, im- proved, or eliminated. The general ledger uses a chart of accounts, whereas ABC/M uses a chart of activities. In translating general ledger data to activities and processes, ABC/M preserves the total reported revenues and costs but allows the revenues, budgeted funding, and costs to be viewed differently.
Notice how inadequate the data in the “chart-of-accounts” view are for re- porting business process costs that run cross-functionally, penetrating the verti- cal boundaries of the organization chart. The general ledger is organized around separate departments or cost centers. This presents a reporting problem. For ex- ample, with a manufacturer, what is the true total cost of processing engineering change notices (ECNs) that travel through so many hands? For a service organi- zation, what is the true cost of opening a new customer account?
Many organizations have been flattened and delayered to the extent that em- ployees from different departments or cost centers frequently perform similar activities and multi-task in two or more core business processes. Only by reassem- bling and aligning the work activity costs across the business processes, such as
“process ECNs” or “open new customer accounts,” can the end-to-end process costs be seen, measured, and eventually managed. As a result of the general ledger’s structure of cost center mapping to the hierarchical organization chart, its informa- tion drives vertical behavior, not the much more desirable process behavior.
In effect, using traditional cost systems, managers are denied visibility of the costs that belong to the end-to-end business processes. This is particularly ap- parent in the stocking, distribution, marketing, and selling costs that the tradi- tional accounting “expenses to the month’s period.” With traditional cost allocations, these sales, general, and administrative expenses (SG&A) are not proportionately traced to the costs of the unique products, containers, services, channels, or customers that cause those costs to occur.
In summary, the general ledger view describes “what was spent,” whereas the activity-based view describes “what it was spent for.” When employees have reliable and relevant information, managers can manage less and lead more.
Drivers Trigger the Workload
Much more information can be gleaned from the right-side view. Look at the sec- ond activity, “analyze claims” for $121,000, and ask, what would make that cost
significantly increase or decrease? The answer is the number of claims analyzed.
That is that work’s activity driver. Figure 1.3 shows that each activity on a stand- alone basis has its own activity driver. At this stage the costing is no longer rec- ognizing the organizational chart and its artificial boundaries. The focus is now on the work that the organization performs and what affects the level of that workload.
There is additional information. Let’s assume there were 1,000 claims ana- lyzed during that period for the department shown in Figures 1.2 and 1.3. The unit cost per each analyzed claim is $100 per claim. If a specific group of senior citizens over the age of 60 were responsible for half those claims, we would know more about a specific customer or beneficiary of that work. The senior citizens would have caused $60,500 of that work (i.e., 500 claims times $121 per claim).
If married couples with small children required another fraction, married couples with grown children a different fraction, and so forth, ABC/M would trace all of the $121,000. If each of the other work activities were similarly traced using the unique activity driver for each activity, ABC/M would pile up the entire
$914,500 into each group of beneficiary. This reassignment of the resource ex- penses would be much more accurate than any broad-brush cost allocation ap- plied in traditional costing procedures and their broad averages.
The Cost Assignment Network is one of the major reasons that ABC/M cal- culates more accurate costs of outputs. The assignment of the resource expenses also demonstrates that all costs actually originate with the customer or benefi- ciary of the work. This is at the opposite extreme of where people who perform If ABC Is the Answer, What Is the Question? 9
Activity-Based ViewActivity-Based View To: ABC Database
Key/scan claims Analyze claims Suspend claims Receive provider inquiries Resolve member problems Process batches Determine eligibility Make copies Write correspondence Attend training
Total
$ 31,500 121,000 32,500 101,500 83,400 45,000 119,000 145,500 77,100 158,000
$914,500 Claims Processing Dept
In addition to seeing the “content of work,” the activity view gives insights into what drives each activity's cost magnitude to fluctuate.
Salaries Equipment Travel expenses Supplies Use and occupancy Total
$621,400 161,200 58,000 43,900 30,000
$914,500
$600,000 150,000 60,000 40,000 30,000
$880,000
$(21,400) (11,200) 2,000 (3,900)
––
$(34,500) Plan
Actual Favorable/
(unfavorable) Claims Processing Department
Chart-of-Accounts ViewChart-of-Accounts View From: General Ledger
Activity cost drivers
Fixed versus variable classifications get redefined with ABC/M.
Products/customers
# of
# of
# of
# of
# of
# of
# of
# of
# of
# of
FIGURE 1.3 Each Activity Has Its Cost Driver
“cost allocations” think about costs. Cost allocations are structured as a one source-to-many destinations redistribution of cost. But the destinations are actu- ally the origin for the costs. The destinations, usually outputs or people, place de- mands on work, and the costs then “measure the effect” by reflecting backward through the ABC/M cost assignment network.
What Are Costs?
Although the two cost views, cost assignment and process, seem logical, people who design or use ABC/M systems often have difficulties deploying the power of these two views, because in practice they often confuse the two views. Part of the problem in defining and designing costing systems is understanding just what exactlycostsare. What are costs anyway? Costs themselves are abstract and in- tangible. One cannot see costs or hold a couple of them in one’s hands. Yet we all know they are there. Like an echo, we know they exist whether we measure them or not.
We know that costs increase or decrease as there are changes in the workload that affect the activity costs via their cost drivers. Work activities are triggered by events, and the costs react as the effect. In one sense, because costs are not tangi- ble, ABC/M operates as “an imaging system” similar to radar, sonar, ultrasound, or an electrocardiogram. Just like a digital camera, ABC/M records an image.
Costs measure effects more than they illuminate root causes. However, ABC/M systems do provide an enterprise-wide image of all the collective effects plus the causal relationships that result in an organization’s costs. So costs pro- vide insights into root causes, but mainly through their inferences. This may sound ironic, but “cost management” can be considered an oxymoron (such as
“jumbo shrimp” and “hospital food”). You do not really manage costs and fi- nancial results; that is like pushing a rope. You understand the causes(and dri- vers) of costs. Then you manage the causes. Cost management is accomplished by driver management.
So, in effect, an organization does not manage its costs: It manageswhat causes those costs to occur (i.e., its cost drivers) and the effectiveness and efficiency of the organizations’ people and equipment to respond to those causal triggers.
When one designs a cost measurement system, that costing information is ac- tually measuring something that, as mentioned, is intangible and invisible. In its own way, ABC/M “tangibilizes” data to represent things that most people believe are intangible.
To sum up, in one sense, the report on the left side of Figures 1.2 and 1.3 rep- resents an “accounting police” command-and-control tool. Have you overspent your budgeted target? If you have, who says that budgeted target amount was fair when it was initially imposed? When managers receive the left-side responsibil- ity center report, they are either happy or sad, but rarely any smarter. Today’s competitive world will be dominated by “learning organizations,” not ones that are straightjacketed by spending restrictions. The right side of Figures 1.2 and 1.3
restates those same expenses in a much more useful format and structure for de- cision support.
When expenses are expressed as activity costs they are in a format that makes it easy to trace them into outputs. This way employees can never say, “we could care less about what anything costs.” People care more when they know what things cost and believe that the accuracy of those costs is reliable. Cost ac- counting is outside many individuals’ comfort zones. ABC/M makes cost under- standable and logical.
As ABC/M converts expenses into the calculated costs of work activities and their outputs, it starts making expenses appear more concrete. To aid in organi- zational learning, we as a society need to increase the representation of reality—
and ABC/M is the foundation for that financial realm. The problem today is that when you have the wrong information coupled with the wrong measurements, it is not difficult to make wrong decisions.
ABC/M as a Translator, Not a Replacement for the General Ledger
Figure 1.4 uses the analogy of an optical lens to show how ABC/M serves as a translatorof general ledger data to provide more focused information for im- proved decision support. The lens not only translates the ledger costs into a more useful and flexible format, it provides more sensory information. The data from the ABC/M lens can serve as an early warning detector that some resource level of spending may be out of alignment with the goals or strategy of the organiza- tion. For quality managers, ABC/M makes visible all the work related to the cost If ABC Is the Answer, What Is the Question? 11
An ABC system does not replace the accounting system.
It restates the same data and adds operating relationships to more effectively support decision making.
General Ledger (expense
account balances) A blizzard of
transactions
Accumulator
Optical Lens (Reassigns Costs)
Types of decision makers
A B C / A B M
Ms. Strategy
Mr. Operations
Data Data+ Information
FIGURE 1.4 ABC/M Does Not Replace the Accounting System
Source:Gary Cokins, Activity-Based Cost Management: Making It Work, © 1996, McGraw-Hill.
Reproduced with the permission of The McGraw-Hill Companies.
of quality (COQ). It reveals for them where quality-related costs are located and which outputs and products the COQ costs have gone into.
Figure 1.4 illustrates that ABC/M is not a replacement for the traditional gen- eral ledger accounting. Rather, it is a translator or overlay that lies between the cost account accumulators in the general ledger and the end-users, such as managers and analysts, who apply cost data in decision making. ABC/M translates expenses into a language that people can understand. It translates expense into elements of costs, namely the work activities, which can be more flexibly linked or assigned to busi- ness processes or cost objects based on demand-driven consumption patterns, not simplistic cost allocations. The reason ABC/M is becoming popular is that the gen- eral ledger is now recognized as being structurally deficient for delivering good business information for decision support. The general ledger is a sound mecha- nism for collecting and accumulating transaction-intensive costs but not for con- verting those costs into useful managerial information.
In the simplest terms, the general ledger acts like a checkbook; one can read the dollar amounts spent but not really know the what-fors and whys of any indi- vidual “check.” And unfortunately the general ledger’s largest “check” amounts are employee payroll-related, which gives managers virtually no visibility of the content of the employee work activities being performed. Furthermore, the pay- roll-related costs do not reveal the interrelationships between that work and other work or products and customer services. There are no insights into what events cause or drive work activity costs to vary. Because an organization’s work activ- ities are probably the most controllable costs that a manager or team can influence, these activities are critical to know and to understand.
In contrast to traditional accounting, ABC/M focuses on the work activities associated with operating a business or managing a not-for-profit organization.
As previously mentioned, ABC/M is work-centric, whereas the general ledger is transaction-centric. Both have their place, but the general ledger’s data are too raw to be considered business intelligence for decision support. ABC/M solves the general ledger’s problem of unprocessed expenditure data. However, just translating the ledger account expenses into their work activities is an incomplete description of ABC/M. The total ABC/M picture comes from linking the activi- ties into networks to calculate the cost of outputs for performing analysis, deter- mining trade-offs, and making decisions.
Managing with a process view created a growing need for better managerial and costing data. Managing processes and managing activities (i.e., costs) go to- gether. By defining a business processas comprising two or more logically re- lated work activities intended to serve end-customers, the need for integrating processes, outputs, and measured costs becomes even more apparent as an im- portant requirement for managers and teams. And the ABC/M Cross (discussed further in the following sections) provides a logical way to visualize and report on these linkages.
In summary, ABC/M resolves the general ledger’s structural problem. With ABC/M, the general ledger account balances are first converted into activity costs.
Then ABC/M assigns the activity costs to cost objects or reassembles the activity costs across business processes. These new and transformed ABC/M cost data can be used to identify operating relationships that can be used effectively in making product, channel, market, and customer-oriented decisions. This ABC/M infor- mation can also be useful in managing processes and any quality-related issues within the processes. In all cases, ABC/M transforms the general ledger data into a different type of cost information that is more useful for decision making.
How Does Activity-Based Costing Compute Better Accuracies?
ABC/M was developed as a practical solution for problems associated with tra- ditional cost management systems that we now realize are distorting and incom- plete. Indirect expense and overhead cost allocation practices of traditional systems can bring more damage than good to organizations. In traditional cost- ing the indirect expenses are usually too aggregated to serve any purpose, and these large groupings destroy any likelihood for calculating an accurate cost of any type of output.
The next problem with overhead cost allocations is that excessively broad- brush average cost rates are applied to calculate costs. Worse yet, the cost alloca- tions usually rely on a sales-related, volume-based factor or basis, such as direct labor hours or department expenses. It may be an inputs-used or outputs-produced basis measure, but the basis usually will not accurately measure the segments of the total. This flawed basis for allocating costs rarely reflects the specific cause- and-effect relationship between the indirect overhead expense and the work out- put, part, product, service, channel, or customer (i.e., the cost object) that is actually consuming the cost. Many managers are tired of “allocation foodfights.”
The result of inaccurate cost allocations, because allocating is a zero-sum error game, is that some cost objects are over-costed while the remainder are under-costed. In other words, as a consequence of unquestioned formula cost al- locations, traditional financial accounting can grotesquely distort the true cost of products and service lines, which in turn can wildly distort their individual profit margins. Some refer to traditional cost allocation methods as “spreaders.”
The ABC/M logical assignment of expenses and costs obliterates the use of simple averages as the basis for tracing costs. Figure 1.5 illustrates the impact of ap- plying ABC/M rather than the traditional allocation. The diagram reveals ABC/M’s
“S-curve.” The horizontal line represents the flawed costs that are calculated by a traditional standard costing system. These costs represent the belief system of the organizations. Many employees accept them as accurate strictly because the ac- countants report them. Other employees are suspicious.
In practice, one discovers that the under-costed products are substantially under-costed because these products may be low-volume with small lot sizes, re- quire more technical attention, consume more handling, or need extra inspection.
ABC/M removes the distortions from simplistic cost allocations. An allocation-free If ABC Is the Answer, What Is the Question? 13
cost system is like a smoke-free environment: no pollution. In short, don’t allocate, prorate. In the end, ABC/M is like bringing in the “myth grenades” that blow up the old flawed beliefs and replace them with real facts.
Defending the Status Quo
Some accountants defend their simplistic allocations as adequate for product and service-line costing. They may have been so in the past. The use of volume-based allocations will provide reasonably accurate calculated costs when the following conditions exist:
Few and very similar products and service lines.
Low overhead expenses.
Homogeneous conversion processes.
Homogeneous channels, customer demands, and customers.
Low selling, distribution, and administrative expenses.
Very high margins.
How many organizations possess those characteristics? Hardly any today.
Perhaps simple cost allocations worked when Henry Ford was producing thou- sands of Model-T automobiles, all black—and with minimal indirect and over- head costs. But not anymore.
In effect, we have allowed the accounting profession to construct a costing scheme that distorts reality and violates variable costing, as a manager understands it. The ultimate problem is that companies are actually losing money on certain
Activity-Based Costing
Traditional Costing (baseline)
Under-costed (hidden loss)
Over-costed (hidden profit) 0%
Highest Volume, Least Complex Products and Services
Lowest Volume, Most Complex Products and Services
1,000%+
50–200%
0%
Distortion per unit (STD–ABC)/STD
Rank-ordered Products/Services
Experiences reported from ABC/M implementations show that cost subsidization has been extraordinarily large.
FIGURE 1.5 Product and Service Cost Distortion
products, orders, services, and customers when their accounting systems state that they are profitable. And since the price quotation practices usually rely on the same flawed cost data, quoting unprofitable orders to potentially unprofitable customers is perpetuated with the illusion that the quoted orders are profitable.
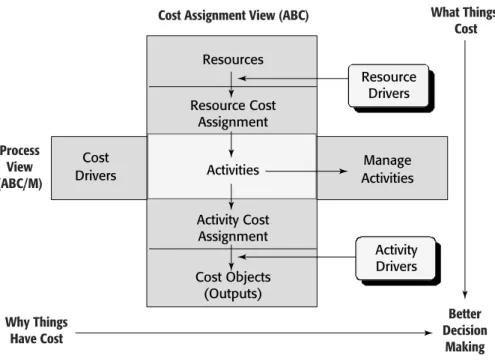
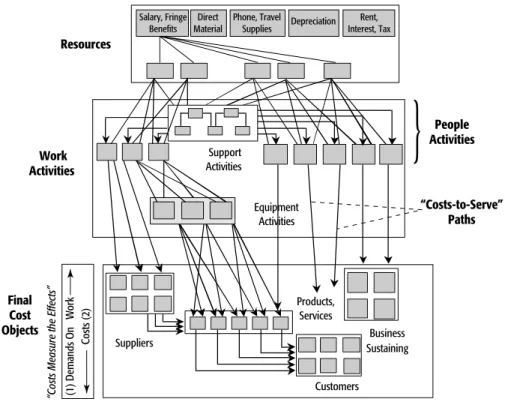
ABC/M corrects for these flaws by identifying the work activities that are re- sponsible for costs. It provides a cost flow assignment network, which allows the work activity costs and their output costs to be continuously reassigned, or passed on only if the products, services, or customers, or in some cases other work ac- tivities, actually use the activity. This condition of consumption and use is what sets ABC/M apart from traditional cost allocation schemes. Figure 1.6 is a pop- ular diagram called the ABC/M Cross.
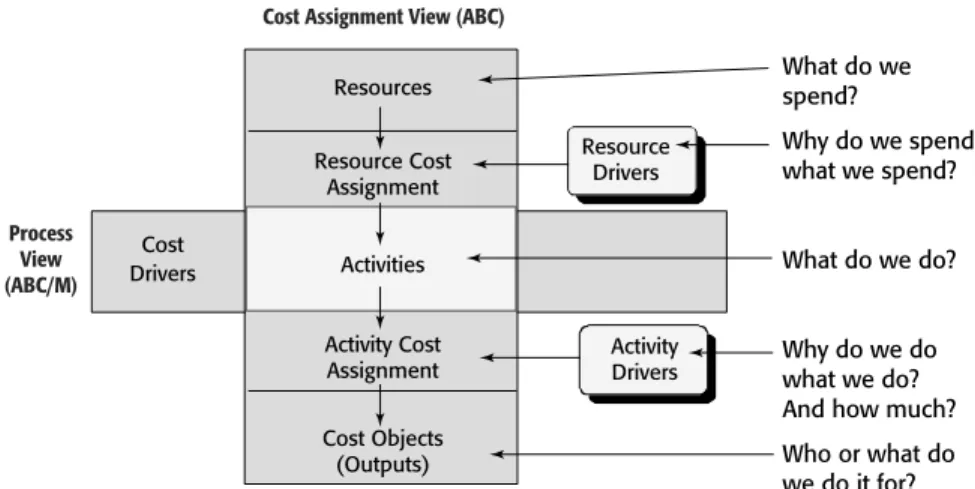
The ABC/M Cross reveals that work activities, which are located in the cen- ter intersection of the cross, are integral to reporting both the costs of processes and the costs of cost objects. Cost objectsare the persons or things that benefit from incurring activity costs; examples are products, internal or external cus- tomers, stakeholders, and outputs of internal processes. Cost objects can be thought of as to what and for whom work is done. Figure 1.7 lists the questions that the vertical cost assignment view answers.
The vertical cost assignment view explains what specific things cost, whereas the horizontal process view, which some refer to as ABM, explains what causes costs to exist and to fluctuate.
If ABC Is the Answer, What Is the Question? 15
Why Things Have Cost
Better Decision
Making What Things
Cost Cost Assignment View (ABC)
Process View (ABC/M)
Resources
Resource Cost Assignment
Activities
Activity Cost Assignment
Cost Objects (Outputs)
Manage Activities Resource
Drivers
Activity Drivers Cost
Drivers
FIGURE 1.6 Activity-Based Cost Management Framework
Source:The Consortium of Advanced Manfacturing–International (CAM-I), 1990. Used with permission.
Vertical Axis
The vertical axis reflects costs as they are sensitive to demands from all forms of product, channel, and customer diversity and variety. The work activities con- sume the resources, and the products and customer services consume the work ac- tivities. The ABC/M cost assignment view is a cost-consumption chain. When each cost is traced based on its unique quantity or proportion of its driver, allthe resource expenses are eventually reaggregated into the final cost objects. This method provides much more accurate measures of product, channel, and cus- tomer costs than the traditional “peanut-butter spreading” cost allocation method.
ABC/M has been called “pull and remember” based on its activity drivers.
This is in contrast to the nickname “push and forget” for traditional cost alloca- tion. Commercial ABC/M software has a powerful audit trail of its computed costs that runs all the way back to the resource expenditures. In ABC/M, the ac- tivity drivers behave like a “pump and valve” in this cost reassignment network.
Activity drivers are critical to ABC/M because not only do they segment and flow the costs to reflect the diversity of the products and customers, they govern the accuracies as well.
Horizontal Axis
The horizontal view of the ABC/M Cross represents the business process view.
A business process can be defined as two or more activities or a network of ac- tivities with a common purpose. Activity costs belong to the business processes.
Across each process, the activity costs are sequential and additive. In this orien- tation, activity costs satisfy the requirements for popular flow-charting and process modeling techniques and software. Business process-based thinking, which can be visualized as tipping the organization chart 90 degrees, is now
What do we spend?
Why do we spend what we spend?
What do we do?
Why do we do what we do?
And how much?
Who or what do we do it for?
Cost Assignment View (ABC)
Process View (ABC/M)
Resources
Resource Cost Assignment
Activities
Activity Cost Assignment Cost Objects (Outputs)
Resource Drivers
Activity Drivers Cost
Drivers
FIGURE 1.7 Questions Answered by the ABC/M Framework
Source:The Consortium of Advanced Manfacturing–International (CAM-I), 1990. Used with permission.
dominating managerial thinking. ABC/M provides the cost elements for process costing that are not available from the general ledger.
Cost Drivers and Activity Drivers
There is probably no term, other than activity,that has become more identified with ABC/M than the term driverand its several variations. The problem is that it has been applied in several ways with varying meanings. To be very clear, a cost driver is something that can be described in words but not necessarily in numbers. For example, a storm would be a cost driver that results in much clean- up work and the resulting costs. In contrast, the activity driversin ABC/M’s cost assignments must be quantitative, using measures that apportion costs. In the ABC/M vertical cost assignment view there are three types of drivers, and all are required to be quantitative:
• Resource drivers trace expenditures (cash outlays) to work activities.
• Activity drivers trace activity costs to cost objects.
• Cost object drivers trace cost object costs to other cost objects.
In the ABC/M Cross’s vertical cost assignment view, activity drivers will have their own higher order cost drivers. Events or other influences, which are formally called cost drivers, cause work activities. A cost driver, such as a sales or work order, is the trigger that causes the work activity to utilize resources to produce output or results. Activity costs are additive along the process and there- fore can be accumulated along the business process.
Cost drivers and activity drivers serve different purposes. Activity drivers are output measures that reflect the usage of each work activity, and they must be quantitatively measurable. An activity driver, which relates a work activity to cost objects, “meters out” the work activity based on the unique diversity and variation of the cost objects that are consuming the activity. It is often difficult to understand whether use of the term activity driveris related to a causal effect (input driver, such as “number of labor hours”) or to the output produced by an activity (output driver, such as “number of invoices processed” or “number of gallons produced”).
In many cases, this is not a critical issue as long as the activity driver traces the rel- ative proportion of the activity cost to its cost objects. An activity cost has an out- put cost rate that is synonymous with the activity driver rate. Older, less-effective terms, such as firstandsecond stagedriver, continue to be used to describe items similar to the currently more accepted terms resource driverandactivity driver.
Acost driveris a driver of a higher order than activity drivers. One cost dri- ver can affect multiple activities. A cost driver need not be measurable but can simply be described as a triggering event. The term describes the larger scale causal event that influences the frequency, intensity, or magnitude of a workload and, therefore, influences the amount of work done that translates to the cost of the activities. For example, a sales promotion can be a cost driver for substantial increases in the company’s work activities of the order-fulfillment process. The If ABC Is the Answer, What Is the Question? 17
amount of effort used in taking orders, for example segmented by teenagers ver- sus senior citizens, would require an activity driver (i.e., number of orders placed due to promotion) to calculate the proportional costs to customers in each seg- ment. There would be a unique activity driver for each work activity that belongs to the order-fulfillment process.
Figure 1.8 illustrates how activity drivers are lower order drivers of cost dri- vers. ABC/M relies on activity drivers for tracing costs, and collectively they are useful when combined with quality management (QM) problem-solving tools for identifying root causes.
Driver data, whether cost driver or activity driver information, spark root cause analysis. But usually the activity drivers used for ABC/M costing are out- put-based. Therefore, as the quantity of the drivers rises or falls over time, ABC/M can report the trend in terms of per-unit cost of work rates of the activ- ity outputs and ultimately of the products. Alternatively, ABC/M can also pro- vide the per-unit-of-each-output rates for use in predictive planning and what-if scenarios, a popular use of the ABC/M data. Cost estimating with ABC/M is nat- ural because the activity costs react and behave linearly with changes from their activity drivers. Too often in traditional costing the cost rates do not directly vary with changes in volume; this results in mis-estimates and ultimately in errors, poor decisions, and lost profits.
Activity drivers have their own cost drivers. It is best to use
“symptomatic” and physical output drivers in the ABC model to measure unit driver rates and segment the diversity of the cost objects…
…and rely on employees to determine the “nth order” drivers using TQM problem solving techniques outside of ABC’s cost flowing.
Cost Assignment View (ABC)
Process View (ABC/M)
Resources
Resource Cost Assignment
Activity Cost Assignment
Cost Objects (Outputs)
Manage Activities Resource Drivers
Activity Drivers 1st order
2nd order
3rd order
4th order
…Root Cause
Cost Drivers
Work Activities
FIGURE 1.8 Drivers Have Drivers
As mentioned, in the vertical cost assignment view the term driver is ap- pended in three areas. The first deals with the method of assigning resource costs to activities: a resource driver. The second deals with the method of assigning ac- tivity costs to cost objects: an activity driver. The third—a cost object driver—
applies to cost objects after all activity costs have already been logically assigned.
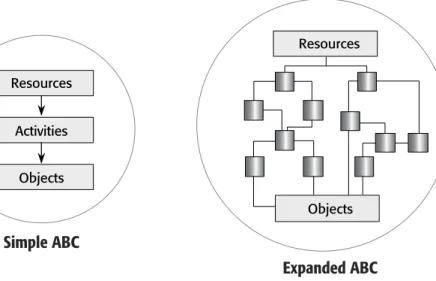
Note that cost objects can be consumed or used by other cost objects. (In this con- text, references to “first” and “second” stage drivers are being abandoned as being obsolete. Their use today would give a misleading impression that ABC/M can be easily accomplished as a simplistic two-step allocation. ABC/M practi- tioners have come to recognize that ABC/M is a multistage cost assignment scheme, as discussed in “Expanded ABC/M Cross” in Chapter 2.) By limiting the use of the word driverto four clearly defined areas—cost driver, resource driver, activity driver, and cost object driver—I hope to prevent misinterpretation or misuse of the term.
The ABC/M Cross displays in a simple fashion that the work activities at the intersection of the vertical and horizontal axis are integral to determining the cost of an organization’s processes as well as the cost of its cost objects. The activity at the intersection schematically represents an individual activity—a very local view. But from a global perspective, the vertical (cost assignment) and horizon- tal (process) views may consist of many activities that are networked based on their relationships to resources, cost objects, and other activities. (This is dis- cussed further in ”Expanded ABC/M Cross” in Chapter 2.)
Large ABC/M Size Does Not Make Better ABC/M
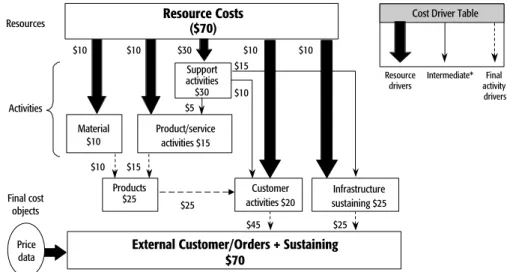
In practice, ABC/M systems will sometimes trace work activity costs to two or more other intermediate work activities that consume the work upstream from the ultimate products and customer services that initially trigger the demands on work. The reassignment network of cost-segmented consumption is responsible for the majority of ABC/M’s superior costing accuracy. ABC/M can tolerate rea- sonable cost driver estimates as proxies for actual transaction detail drivers be- cause the error does not compound; it dampens out on its way to the final cost objects. It is somewhat counterintuitive, but with ABC/M, precision inputs are not synonymous with accurate outputs. This property significantly lightens the load for data collection.
ABC/M’s property of error-dampening also means that an ABC/M model does not need to be very granular or consequently very large in size. Unfortu- nately, because this idea is counterintuitive, many ABC/M systems are over- engineered. The ABC/M models are well beyond diminishing returns of extra accuracy for extra levels of effort. This is “ABC/M’s leveling problem.” No one knows in advance how detailed to make the first ABC/M model. The project team, often led by accountants, errs on the side of excess detail. Unfortunately, some activity-based costing projects are exposed to risk because the system be- came unnecessarily difficult to maintain prior to the users comprehending how If ABC Is the Answer, What Is the Question? 19