The concept involves using fresh frozen fruit and vegetables in a cup with 5 different mixes, stored in fridges, so customers can choose which cup they like and mix it on demand in our vending machines with an option of none sugar. The introduction of the AlfaSmoothie vending machine is proof of our commitment to offer healthy, convenient and innovative solutions to our customers. Description: Ingredients are prepackaged in sealed cups, stored in the machine's refrigerated compartment, reflecting the efficient and hygienic practices of Japanese convenience stores.
In line with Alfamart's commitment to sustainability, our vending machines are equipped with a dispenser for environmentally friendly packaging. 1 Purchasing ingredients The process starts with the purchase of fresh, high-quality fruit and vegetables. This is the systematic process involved in the production and maintenance of the AlfaSmoothie vending machines.
The automated sales process allows customers to select 5 types of smoothie cups in the fridge, place them in the machine, select their chosen type of cup in the machine, customize topping preferences via a screen, make a payment, the blending process and finally receive a freshly blended and sealed smoothie for immediate consumption. In addition, we can give a review by giving starts in the screen and each cup.
Maintenance
Check for and install any available software updates for the vending machine's operating system or software applications. Perform an inventory check for all ingredients, toppings, and supplies to inform the replenishment process and prevent stockouts. Review any customer feedback or reports regarding vending machine performance and resolve any reported issues promptly.
Licensing
Situational Analysis
Industry Analysis
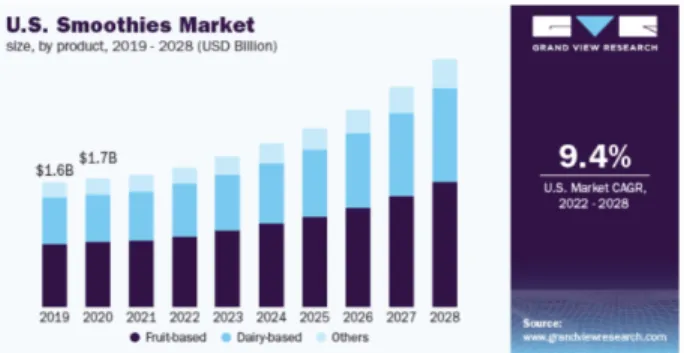
The global smoothie market showed a valuation of approximately USD 12.10 billion in 2020 and is predicted to maintain a steady growth trajectory, estimated at a compound annual growth rate (CAGR) of approximately 6.8% from 2021 to 2028 (Grand View Research , 2021). The integration of automated vending machines in the food and beverage sector is expected to show significant growth, projected at a CAGR of 7.5% from 2020 to 2027 (Allied Market Research, 2020), marking an era of innovation and technological advancement in the industry indicate. Trends in consumer behavior, as evidenced by a survey conducted by Nielsen in 2019, underline a significant shift in preferences.
About 73% of global consumers indicate they are willing to change their consumption patterns in favor of options that reduce environmental impact, indicating a robust preference for sustainable alternatives in the market landscape. Vending machine adoption in the food and beverage industry is expected to grow at a CAGR of 7.5% between 2020 and 2027 (Allied Market Research, 2020). Consumer preferences: A survey by Nielsen (2019) found that 73% of global consumers would change their consumption habits to reduce environmental impact, highlighting the preference for sustainable options.
A consumer survey conducted in Indonesia during 2021 revealed a significant market gap, with 50% of consumers expressing the absence of convenient and healthy beverages. In Southeast Asia, demand for healthy beverages is expected to grow by 8.5% annually, according to ASEAN Briefing by 2022.
Local Market Trend Analysis
The Asia Pacific smoothie market includes dominant players such as Jamba Juice, Smoothie King and Naked Juice, which together hold a 35% market share, as reported by Market Watch in 2021. Economic indicators for Indonesia are promising, with a expected GDP growth of 5%. % in 2023 according to the 2022 World Bank report. This positive economic outlook indicates a favorable environment for business growth and consumer spending in the Indonesian market.
With an urbanization rate of 56% in Indonesia, there is a notable demand for retail solutions that prioritize convenience and health in cities, as shown by UN data in 2021. In cities such as Jakarta and Bali, there is a noticeable trend where 30% more is spent on convenience foods compared to other regions, indicating a strong correlation between urbanization and consumer lifestyle preferences, as reported by Statista in 2021.
BUSINESS POTENTIAL ANALYSIS
4. 1 SWOT Analysis
- TOWS Analysis
- Competitive Pricing & Economic WT 1 Dependence on Technology &
- PESTLE Analysis
- Porter Five Forces
- Marketing Strategy
- Unique Selling Proposition (USP)
- Marketing Mix (4Ps)
- Segmentation, Targeting, Positioning (STP) Segmentatio
- Location Analysis
- Jakarta
- Bandung
- Bali
- Risk Analysis
- Market Risks
- Technical Risks
- Operational Risks
- Financial Risks
- Financial Projection
- Financial Assumption
- Capital Expenditure
- Operational Expenditure
Leverage Boost's advanced vending machine branding technology to expand into targeted marketing campaigns in new urban areas, appealing to a broader health and wellness-oriented, tech-savvy consumer base. Threat of new entrants high The ease of setting up vending machines with low initial investments attracts potential new entrants. Competitive rivalry high Competitive rivalry within the smoothie industry in Indonesia is relatively high.
Emphasize the ability to customize smoothies to personal preferences from creating a concept of "your daily smoothies" by offering fresh frozen fruits and vegetables in a cup with 5 different blends, stored in refrigerators so that customers they can choose the cup they like and mix them. on request in our vending machines with a sugar free or sugar option. Accessibility: Ensuring that machines are easily accessible and visible promotions, collaborations for gyms and health centers, and. Reason for selection: Jakarta, as the province with the highest average standard of living in Indonesia (adjusted expenditure per capita reached Rp. 18.93 million/person/year in 2022, an increase of 2.2% from last year) , exhibits high price sensitivity and trend characteristics.
Compared to others, Bandung is a higher with the average standard of living in Indonesia which is Rp 11,500,000. Here, time-pressed professionals are likely to prioritize convenience and quick service over price, contributing to the significant demand for ready-to-eat products such as smoothies. The presence of universities and colleges may influence purchasing patterns, with students and academic staff choosing nutritious and convenient food options such as smoothies, without showing significant price resistance due to the perceived value of health benefits.
The risk of new regulations or changes in existing laws that may affect the operation of vending machines or the food and beverage industry in general. Potential risks associated with the handling and storage of customer data, especially in relation to payment information. Risks associated with purchasing ingredients, including potential shortages or delays that may affect the availability of smoothies.
Ensure consistent quality of ingredients and final products across all vending machines to maintain brand reputation. Compliance with strict health and safety regulations and ensuring that all vending machines meet these standards. Risk that the initial investment in vending machines and other start-up costs will not be recouped within the expected time frame.
The sales volume for each menu and outlets varies greatly depending on the specific characteristics of each outlet region, e.g. but not limited to) price sensitivity, average annual income and population density in the region). The weighted average cost of capital (WACC) comes from equity (100%) which was 6.51% based on the team's calculation.
Operational Expenditure
Project Financing
Financial Simulation
- Total Revenue Projection
- Cost Projection
- Net Profit Projection
The above graph shows that Alfamart's total sales of Alfa Smoothie are increasing year on year. Alfa Smoothie's cost structure is divided into variable costs (the COGS of each product) and fixed costs (marketing costs, electricity and water costs, distribution costs and maintenance costs). As you can see from the chart, the difference between COGS and revenue increases as the year progresses.
In the operating cost graph above, it can be seen that this operating cost has increased year-on-year in line with the increase in business growth and the company's revenue year-on-year (YoY). The expected net profit of IDR 93 million will occur in 2024 and in 2025 the project will see an increase in net profit of IDR 22 million.
Project Feasibility Analysis
- Net Present Value (NPV)
- Financial Internal Rate of Return (IRR)
- Payback Period
- Profitability Index
- Sensitivity Analysis
- Conclusion and Suggestion
Based on the results of the free cash flow projection calculation, the calculation of Net Present Value (NPV), Financial Internal Rate of Return (IRR), Profitability Index (PI) and Payback Period (PBP) is as follows. The net present value (NPV) is obtained by subtracting the present value of money from the income of the project with the initial investment. Based on the calculation results, it is established that the FIRR of the project is equal to 37.8%.
The value of the internal rate of return (IRR) of 37.8% is greater than the weighted average cost of capital of 6.51%, which confirms the conclusion that the project is feasible. If the payback period is shorter than the maximum specified time, the project is acceptable. If the payback period is longer than the maximum specified time, the project is rejected.
The Profitability Index (PI) is a method of calculating project feasibility by comparing the sum of the present value of the cash flow value with the investment value of the project. This method calculates the comparison between the value of future net cash flows and the value of the current investment. This model calculates the cash value of net cash inflows divided by the cash value of the investment.
In this analysis, the profitability index value of 4.00 is much greater than 1, so the investment project is considered feasible. In scenario 1, if the price falls 75% from the initial price, the net present value of the firm will be negative. On the other hand, the firm could lower the price by up to 80% to gain acceptance of the project.
This indicates that the company's management is more cautious in carrying out the activities of the project, as any change in conditions will have an effect on the profitability and attractiveness of the project. Payback period of 3.32 years, payback period is shorter than the maximum set time, the project is acceptable. The Profitability Index value of 4 is greater than 1, so the investment project is considered feasible.
Appendix

