1
ANALYTICAL PLANNING METHOD MAJOR ASSIGNMENT Lecturer:
Dr.Yudi Basuki, S.T.,M.T Prof.Dr.agr.sc.Iwan Rudiarto, S.T.,M.T
Dr.Eng.Maryono, S.T.,M.T Sri Rahayu, S.Si., M.Si
Widjonarko,S.T.,M.T
ALTERNATIVE FOR HANDLING THE LOW QUALITY OF EDUCATION THAT AFFECTS THE HUMAN DEVELOPMENT INDEX IN WONOSOBO REGENCY
Arranged By:
Armeino Fadhlan Atana 21040121190050
INTERNATIONAL UNDERGRADUATE PROGRAM (IUP) DEPARTMENT OF URBAN & REGIONAL PLANNING FACULTY OF ENGINEERING – DIPONEGORO UNIVERSITY
SEMARANG CITY 2023
ii
STATEMENT OF ORIGINALITY
Student Declaration
I confirm that the major assignment of analytical planning method course with titled
‘ALTERNATIVE FOR HANDLING THE LOW QUALITY OF EDUCATION THAT AFFECTS THE HUMAN DEVELOPMENT INDEX IN WONOSOBO REGENCY’ is all my own work. I have not copied or based my work on any samples or exemplars to wich I had access. Every single source of analysis that related in this major assignment will be directly put in the references chapter.
Thus, I make this statement truthfully and if in the future this statement is not true, then I am willing to accept sanctions for my actions.
Semarang, 4 June 2023
Armeino Fadhlan Atana NIM. 21040121190050
iii ABSTRACT
Education is one of the important aspect in order to indicates wether a city or region is well developed by the human resources or not. The quality of education in Wonosobo Regency categorized to be low quality since according to the data from BPS that the average school years in the last decade has only resulting below 8 years in an average of school years attended.
This show that the education affects the human development index in Wonosobo, especially the regency has a lot of potential in the natural resources but a lack of quality in the human resources. The economy income of people in Wonosobo Regency came from the agricultural sector, and each of every people has fair amount of their own expenditure per capita in a year according to BPS. Possibility of both aspect education could corelates to the expenditure per capita to be further helps the development of Wonosobo. Furthermore, It would answer wether which of the aspect would be more influential in terms to support the Wonosobo Regency.
Keywords: Human Development Index, Education, Expenditure per Capita
iv FOREWORD
Praise and gratitude are always prayed to the presence of God Almighty because of His mercy and grace, the author was able to complete a report entitled " ALTERNATIVE FOR HANDLING THE LOW QUALITY OF EDUCATION THAT AFFECTS THE HUMAN DEVELOPMENT INDEX IN WONOSOBO REGENCY" which was the completion and also the end of the Analytical Planning Method course assignment steady and without obstacle.
Author does not forget to thank all those who have supported the completion of this report. The authors would like to thank, especially to the Advisory Lecturers of the Planning Analysis Method Course in 2023, namely Dr. Yudi Basuki, S.T., M.T., Dr. Eng. Maryono S.T., M.T., Widjonarko, S.T., M.T., and Dr.soc.agr. Iwan Rudiarto, S.T., M.Sc, Sri Rahayu, S.Si. M, Si.
who have guided and directed the preparation of this analytical report.
Author realizes that in the preparation of this report, there are still shortcomings and far from being perfect in it. Therefore, the author will be very open to suggestions and constructive criticism from readers so that they can produce better analysis results in the future. It is hoped that this analysis report can fulfill the final project of Analytical Planning Method course and can also be useful for all parties concerned and can be used as a guide for data collection and secondary surveys.
Semarang, 4 June 2023
Author
v
TABLE OF CONTENTS
STATEMENT OF ORIGINALITY ... ii
ABSTRACT ... iii
FOREWORD ... iv
CHAPTER I INTRODUCTION ... 1
1.1 Background ... 1
1.2 Problem Formulation ... 1
1.3 Purpose ... 1
CHAPTER II LITERATURE REVIEW ... 3
2.1 Human Development Index (HDI) ... 3
2.2 Cross Tabulation ... 4
2.3 Multiple Regression Analysis ... 4
2.4 Analytical Hierarchy Process Analysis ... 6
CHAPTER III CASE ANALYSIS ... 7
3.1 Scope of Study ... 7
3.2 Data Collecting Method ... 8
3.3 Cross Tabulation Analysis ... 8
3.4 Multiple Regression Analysis ... 9
3.6 Analytical Hierarchy Process Analysis ... 10
CHAPTER IV RESULT AND DISCUSSION ... 11
4.1 Cross Tabulation Analysis ... 11
4.2 Multiple Regression Analysis ... 12
4.3 AHP Analysis... 15
4.4 Result Visualization ... 19
CHAPTER V CONCLUSION ... 20
5.1 Summary of Analysis ... 20
REFERENCE ... 21
APPENDIX ... 22
vi
TABLE OF FIGURES
Map 1 Administrative Wonosobo Regency ... 7
Figure 1 Regression Analysis Table ... 5
Figure 2 Collective Gathered Data ... 8
Figure 3 Collective Gathered Data Cross Tabulation ... 9
Figure 4 Scoring Result of Cross Tabulation ... 9
Figure 5 Alternative of AHP ... 10
Figure 6 Criteria of AHP... 10
Figure 7 AHP Visualization Interconnection ... 10
Figure 8 Case Processing Summary Cross Tabulation ... 11
Figure 9 Chi Square Cross Tabulation ... 11
Figure 10 Symetric Measures Cross Tabulation ... 12
Figure 11 Descriptive Statistic Multiple Regression ... 12
Figure 12 Correlation Multiple Regression ... 12
Figure 13 Dependent Variables Multiple Regression ... 13
Figure 14 Coefficients Multiple Regression ... 13
Figure 15 Durbin Watson Multiple Regression ... 13
Figure 16 Model Summary Multiple Regression... 14
Figure 17 Scatterplot Multiple Regression ... 14
Figure 18 Normality Test Multiple Regression ... 14
Figure 19 T-Test Multiple Regression ... 15
Figure 20 Questionaire A1 AHP ... 15
Figure 21 Questionaire A.2 AHP ... 16
Figure 22 Questionaire A.3 AHP ... 16
Figure 23 Pairwise A.1 AHP ... 17
Figure 24 Pairwise A.2 AHP ... 17
Figure 25 Pairwise A.3 AHP ... 17
Figure 26 Normality A.1 AHP ... 17
Figure 27 Normality A.2 AHP ... 17
Figure 28 Normality A.3 AHP ... 17
Figure 29 Consistancy A.1 AHP ... 18
Figure 30 Consistancy A.2 AHP ... 18
Figure 31 Consistancy A.3 AHP ... 18
1 CHAPTER I INTRODUCTION 1.1 Background
The development of human resources has been considered important by the Indonesian government. Through the state objectives contained in the fourth paragraph of the 1945 Constitution, the government has the duty to protect the entire Indonesian nation and all of Indonesia's bloodshed, to promote public welfare, educate the nation's life, and participate in carrying out world order based on freedom, eternal peace and social justice. To achieve state goals, local governments carry out programs and activities to serve the community in all areas of public services such as health, infrastructure, education and so on. The government's commitment to or building the quality of public welfare can be seen through the allocation of government spending from three types of spending, namely education spending, health spending, and infrastructure spending. Based on the indicators that form the basis for measuring HDI, the education and health sectors have an important role to play in creating human resources and development.
Thus, there are at least two areas that the government needs to pay attention to in connection with efforts to expand the opportunities for its population to achieve a decent life, namely the education sector and the health sector. In this case, the government can realize an increase in the level of welfare of its people through the role of allocating government spending in the education and health sectors (Mongan, J 2019). The analysis conduct here is to support the research on how human development index could affect the urban & regional planning to deal with complexity, to know the resource allocation through analytical planning method of analysis. By the implementation of the statistical method of analysis, this could reduce the uncertainty of a development especially in human quality in a city such as Wonosobo Regency.
1.2 Problem Formulation
Based on the background that has been stated earlier, this analysis aim to know wether the human per capita could effect the human development index, or vice versa to what if the education sector could affect the human development index that furthermore could also have the saturation to affect the economical development of Wonosobo Regency.
1.3 Purpose
The purpose of this reasearch is to build up a strong evidence on what sector or aspect could affect the regional development, wether through educational sector that could improve the
2
quality of individuals or the ability of people to have more money in a sense of the human per capita to create an affecting factors to the human development index of Wonosobo Regency.
3 CHAPTER II LITERATURE REVIEW
2.1 Human Development Index (HDI)
One measure of a nation's development is its level of human development. A nation can be described as developed not only in terms of its gross domestic product (GDP), but also in terms of its population' health and educational status. The development paradigm has evolved over time, and at this point, it makes humans the primary focus of development. the understanding that natural resources and physical capital are only secondary components of production and that human capital is the foundation of a country's riches (Satrio and Rochani 2019).
Fundamentally, it will be people who actively participate in activities to raise capital, utilize resources, and carry out national development.
Human development was first offered as a new paradigm in the development model by the United Nations Development Program (UNDP) in its report "Global Human Development Report" in 1990. According to UNDP (1990), human development is defined as an increase in the population's options, which may be viewed as a process of attempts to increase options as well as the level attained as a result of these efforts. The improvement of one's level of health, education, and skills, as well as the effective application of any talents or skills one may possess, all contribute to human development. Compared to the idea of economic development, which emphasizes growth, basic requirements, social welfare, or human resource development, the idea of development has a broader definition.
According to the UNDP, a fairly wide range of development is essentially included in the definition of human development. The idea of human development calls for the analysis and comprehension of development from a human standpoint as well as from an economic growth perspective. According to the UNDP definition, people in a place should have access to a variety of options, and the government must support the provision of facilities so that people can use them and make decisions based on their options. In this instance, the government acts as a catalyst for the people to have more options. The image that may be drawn illustrates how far government spending policies have advanced the government's position as a facilitator of human growth.
4 2.2 Cross Tabulation
Crosstab analysis, sometimes referred to as cross tabulation or contingency table analysis, is a technique for examining how variables that are grouped in columns and rows interact with one another (Dewi & Samudro, 2019). The link between two categorical variables is investigated using this statistical technique. This entails creating tables that show the frequency and distribution of one variable over different variable categories. The frequency or proportion of various categories from one variable category to another variable category can be compared using crosstab analysis. Planners are able to investigate relationships and make inferences about their interrelationships thanks to this analysis, which also helps to find patterns, associations, and dependencies between variables. In the social sciences, market research, and other disciplines where categorical variables are attracted to one another, crosstab analysis is frequently utilized.
Cross tabulation analysis (Crosstabs) is the simplest method of analysis but has strong enough explanatory power to explain the relationship between variables. For this reason, there are several simple principles that need to be considered in compiling cross tables so that the relationship between variables is clearly visible. For this reason, in crosstabs analysis statistical analysis is used, namely Chi Square (Chi Square) which is symbolized by X2 .
With the help of this technique, planners may efficiently examine and evaluate complex data sets since the relationships between variables are represented in a structured and visual manner.
2.3 Multiple Regression Analysis
Regression analysis is used to measure the influence between the independent variables and the dependent variable. If there is only one independent variable and one dependent variable, then the regression is called simple linear regression . Conversely, if there is more than one independent variable or dependent variable, it is called multiple linear regression. Multiple linear regression is a regression model that involves more than one independent variable.
Multiple linear regression analysis was carried out to find out the direction and how much influence the independent variables have on the dependent variable (Ghozali, 2018). If there is only one independent variable, it is called a simple linear regression, whereas if there is more
5
than 1 independent variable, it is called multiple linear regression. This linear relationship can be described by the linear regression equation, which has the general form:
Figure 1 Regression Analysis Table
In addition, linear regression analysis also involves evaluating the statistical significance of the regression coefficients, through hypothesis testing and use of confidence intervals, to determine whether the relationship between the independent variable and the dependent variable is statistically significant. Linear regression analysis can be used for a variety of purposes, including prediction, understanding causal relationships between variables, and controlling independent variables in experiments.
There are various elements in multiple linear regression analysis that can be interpreted. The following significant elements can be interpreted:
1. R-squared, or coefficient of determination How effectively a multiple linear regression model describes the variation in the dependent variable is measured by the coefficient of determination, also known as R-squared. R-squared has a value between 0 and 1, and the greater the number, the better the model can account for data variation.
2. F-statistical test, second This test examines if there is a significant relationship between the dependent variable and at least one independent variable. The alternative hypothesis (H1) in multiple linear regression states that at least one independent variable has a significant effect on the dependent variable, contrary to the null hypothesis (H0) in the F-statistic test, which states that no independent variable has a significant effect on the dependent variable.
3. T-statistic analysis 3. This test is used to determine the individual significance of each regression coefficient for an independent variable. This test helps establish whether specific independent variables significantly affect the regression model's dependent variable. Each independent variable in a multivariate linear regression has a regression coefficient that indicates how much of an impact it has on the dependent variable. The
6
t-statistic test is used to determine whether each independent variable's regression coefficient differs significantly from zero. The independent variable's regression coefficient must equal zero in order for the independent variable to have no significant effect on the dependent variable, according to the null hypothesis (H0) of the t-statistic test. According to the alternative hypothesis (H1), if the independent variable's regression coefficient is greater than zero, the independent variable significantly influences the dependent variable
2.4 Analytical Hierarchy Process Analysis
Thomas L. Saaty created the decision support model known as AHP. According to Saaty (1993), a hierarchy is defined as a representation of a complex problem in a multi-level structure, where the first level is the objective, followed by the factor level, criteria, sub criteria, and so on down to the last level of the alternative. This decision support model will describe complex multi-factor or multi-criteria problems into a hierarchy. A complex problem can be divided into categories using a hierarchy and then organized into a hierarchical form to make the problem appear more organized and methodical.
AHP is often used as a problem solving method compared to other methods for the following reasons:
1. Hierarchical structure, as a consequence of the selected criteria, up to the deepest sub- criteria.
2. Takes into account validity up to the tolerance limit for inconsistency of various criteria and alternatives chosen by decision makers.
3. Taking into account the durability of the sensitivity analysis output decision making.
AHP can be employed for individual demands, particularly for studies pertaining to policy or the formation of priority strategies, in addition to those of public or commercial organisations.
Because a priority in AHP is made up of several possibilities, some of which may take the form of previously deconstructed (structured) criteria, prioritization in AHP is based on a structured (hierarchical) process and makes sense. As a result, AHP essentially aids in the resolution of complicated issues by creating a hierarchy of criteria that are then evaluated subjectively by interested parties, and various considerations are then drawn to create weights or priority (conclusions).
7 CHAPTER III CASE ANALYSIS 3.1 Scope of Study
Wonosobo Regency is one of the regencies in Central Java Province, with the capital city of Wonosobo and is located 120 km northwest of Semarang City. Geographically Wonosobo Regency is located at 70.11'.20" to 70.36'.24" South Latitude (LS), and 1090.44'.08" to 1100.04'.32" East Longitude (BT), with an area of 98,468 hectares (984 .68 km2) or 3.03% of the area of Central Java Province. The area of that size is administratively divided into 15 districts.
Map 1 Administrative Wonosobo Regency
In terms of geographic position, Wonosobo Regency has boundaries as follows, North: Kendal Regency and Batang Regency;
East: Temanggung Regency and Magelang Regency;
South: Kebumen Regency and Purworejo Regency;
West: Banjarnegara Regency and Kebumen Regency.
8 3.2 Data Collecting Method
The data used in this study is secondary data obtained by downloading information from data sources and then analyzing documents. The secondary data used includes the average length of schooling from 2012-2022, adjusted per capita spending for 2012-2022 and the human development index (HDI) for 2012-2022. This data was obtained from an official data source, namely the Wonosobo district Central Bureau of Statistics. Below are the data shown in a table;
Figure 2 Collective Gathered Data
Above are the 3 collective data gathered from BPS to support the analysis on how education could affect the human development index from the past 10 years.
3.3 Cross Tabulation Analysis
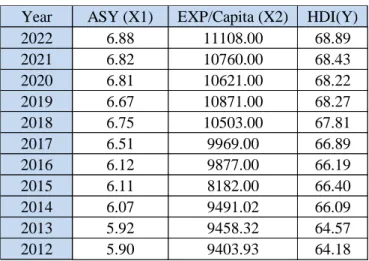
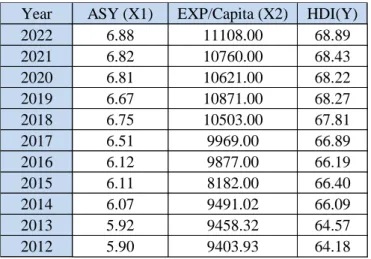
The data that is used for the input to the cross tabulation is the human development index (Y) as the dependent variables, and both average school years(X1), expenditure per capita(X2) as the independent vatiables. The range is from the past 10 years.
Year ASY (X1) EXP/Capita (X2) HDI(Y)
2022 6.88 11108.00 68.89
2021 6.82 10760.00 68.43
2020 6.81 10621.00 68.22
2019 6.67 10871.00 68.27
2018 6.75 10503.00 67.81
2017 6.51 9969.00 66.89
2016 6.12 9877.00 66.19
2015 6.11 8182.00 66.40
2014 6.07 9491.02 66.09
2013 5.92 9458.32 64.57
2012 5.90 9403.93 64.18
9
Figure 3 Collective Gathered Data Cross Tabulation
After inputting the data, next step is to scoring and categorizing based on the number stated in the previous table. The range of scoring will be from 1-3.
Figure 4 Scoring Result of Cross Tabulation
These result will be used to conduct the cross tabulation analysis in SPSS, to be furthermore resulting the final analysis.
3.4 Multiple Regression Analysis
The regression analysis will support the analysis to test wether there is an influence between one variable and another variable expressed in the form of regression. Multiple linear regression analysis results will look for the influence of 2 independent variable, namely the average school years, and expenditure per capita , and the independent variable namely human development index. The data of multiple regression analysis is the same as the data used from the previous analysis.
Year ASY (X1) EXP/Capita (X2) HDI(Y)
2022 6.88 11108.00 68.89
2021 6.82 10760.00 68.43
2020 6.81 10621.00 68.22
2019 6.67 10871.00 68.27
2018 6.75 10503.00 67.81
2017 6.51 9969.00 66.89
2016 6.12 9877.00 66.19
2015 6.11 8182.00 66.40
2014 6.07 9491.02 66.09
2013 5.92 9458.32 64.57
2012 5.90 9403.93 64.18
Year ASY (X1) EXP/Capita (X2) HDI(Y)
2022 3 3 3
2021 2 3 3
2020 2 2 2
2019 2 3 3
2018 2 2 2
2017 2 2 2
2016 1 2 1
2015 1 1 2
2014 1 1 1
2013 1 1 1
2012 1 1 1
10 3.6 Analytical Hierarchy Process Analysis
Determination of criteria and alternative solutions to problems is needed in conducting AHP analysis. The following are criteria and alternatives for strategies for dealing with the problem of low education affecting the human development index in Wonosobo.
Figure 5 Alternative of AHP
The alternatives cover 3 main consideration that soon will be the hierarchical results, additional of facility, easy accessibility, and educational campaign are 3 of the main alternatives to choose in the end.
Figure 6 Criteria of AHP
While the criteria is based on 4 criteria namely right on target, cost, time, effort. All of these will have the relation and impactness to each other while conducting the process of analysis.
Below is the priority visualization of the analytical hierarchy process.
Figure 7 AHP Visualization Interconnection
A.1 A.2 A.3
Alternatives
Additional of new education facility Easy accessibility to education facility Educational campaign to raise awarness
C1 C2 C3 C4
Criteria Right on Target Cost
Time Effort
11 CHAPTER IV
RESULT AND DISCUSSION
4.1 Cross Tabulation Analysis
The analysis of cross tabulation will consider several of hypothesis such as;
H0: No relation between the average school years and expenditure per capita.
H1: There is a relation between average school years and expenditure per capita.
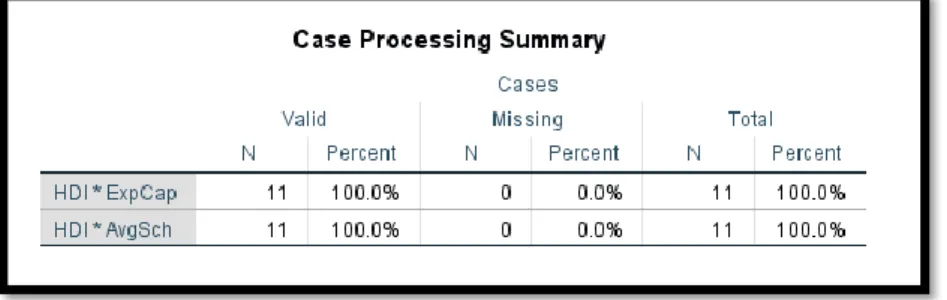
Figure 8 Case Processing Summary Cross Tabulation
All of the 11 data that has been inputed is valid and no data is missing. Which means we could see the next step.
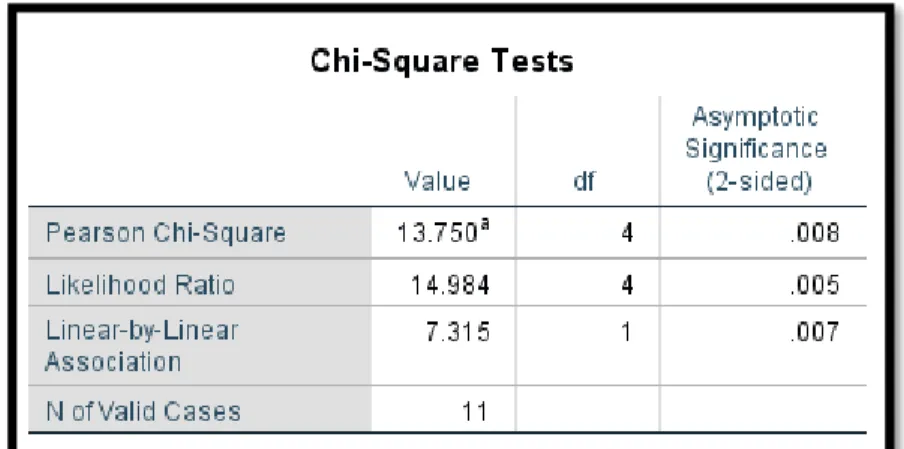
Figure 9 Chi Square Cross Tabulation
The chi-square value result in the analysis is below 0.05 it indicate that there is a corelation between one and other variables.
12
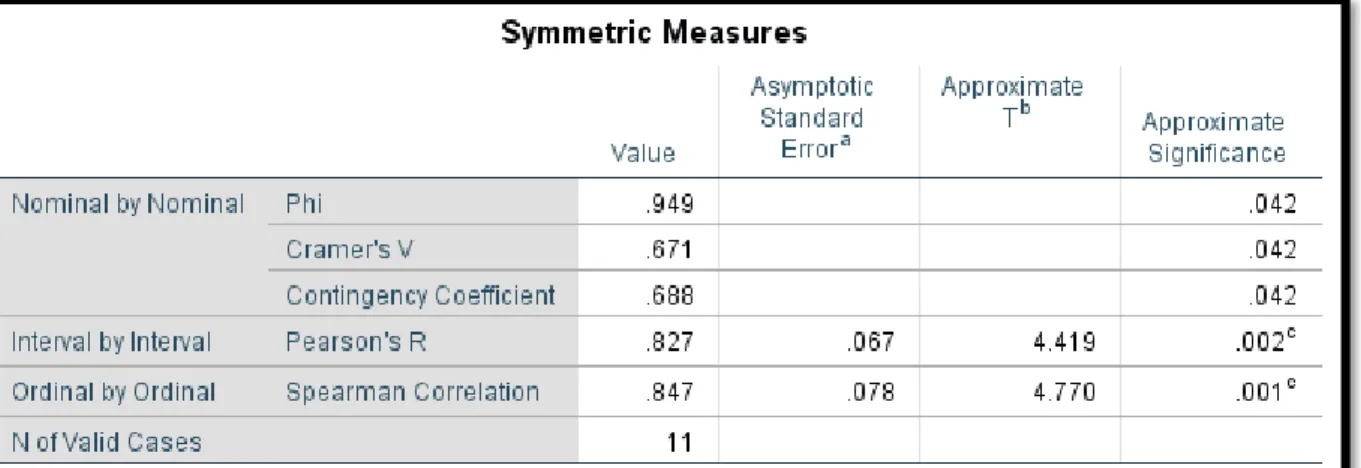
Figure 10 Symetric Measures Cross Tabulation
The contigency coefficient is close to number 1, in this case the number is .688 that also means the relation between average school years, and expenditure per capita has a strong connection.
4.2 Multiple Regression Analysis
Figure 11 Descriptive Statistic Multiple Regression
In this table it can be seen that the N coloumn is 11, which is also the number as the data that input in the first place. This also mean that the step is right
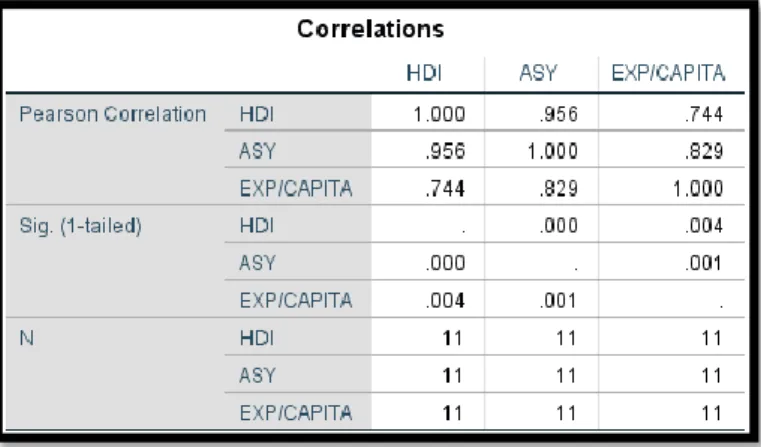
Figure 12 Correlation Multiple Regression
13
Figure 13 Dependent Variables Multiple Regression
EXP (Expenditure/Capita) and ASY (Average school year) as independent. And HDI as Dependent.
Figure 14 Coefficients Multiple Regression
It indicates that there is no symptom of multicollinearity, and the tolerance value is above 0.100 and the VIF is only 3.205 which is below 10.
Figure 15 Durbin Watson Multiple Regression
-DU Durbin Upper 1.6044 -4- DU ( 4- 1.6044)
=2.395
14
Figure 16 Model Summary Multiple Regression
As it can be seen that the regression analysis is free from no autocorrelation since the value of DW is between (1.6044) and (4-du 2.395)
Figure 17 Scatterplot Multiple Regression
The point distribution does not form a certain pattern and it can be seen that the dots are scattered above and below the value of 0, so it can be concluded that there is no heteroscedacity.
Normality Test
Figure 18 Normality Test Multiple Regression
15
As we can see in the normality plot we can see that the distribution of point is slight close to each other and diagonal. So it can be concluded that this model regression is have normal.
T test (Regression coefficient test)
Figure 19 T-Test Multiple Regression
It can be seen that the X1 variable is <0.05 which means it affect the Y variable.
The estimated model here is
Y= 41.643 + 4.392 (X1 Average School Years)
Since the Sig coloumn in the coefficient test of EXP/Capita is >0.05 and the unstandardized result is .000. So it cannot be inserted in the estimated model since there is no value of it and not affecting the human development index.
4.3 AHP Analysis
To conduct the analysis of AHP, questionaire is needed to prove for the alternative way that can be resulted to set the least and most important. Below are the table of questionaire.
Figure 20 Questionaire A1 AHP A.1 Additional of New Education Facility
C1-C2
Score 0,20
C1-C3
Score 5
C1-C4
Score 2
Adding a new education facility could hits the right target but could cost a lot of money
Adding a new education facility could hits the right target but will take a lot of time for the realization
Adding a new education facility could hits the right target but has a lot of efforts on energy and labor to build new facility.
A.1 Additional of New Education Facility C2-C3
Score 0,20
C2-C4
Score 5
Adding a new education facility could cost less money but takes a lot of time to implement it
Adding new education facility could cost less money but have a lower number of worker for efforts to build a new one
A.1 Additional of New Education Facility C3-C4
Score 5
Building a new education facility could take a lower time but increase the efforts of labor
16
Figure 21 Questionaire A.2 AHP
Figure 22 Questionaire A.3 AHP
From the questionaire result, we could gather the scoring value ex. (0,2 , 3 , 5) that could be use to conduct the pairwise, normalization, and decide the consistency measurement.
A.2 Easy Accessibility to education facility C1-C2
Score 2
C1-C3
Score 4
C1-C4
Score 5
Provision of road for accessibility could be right on target but could cost a lot of money
Provision of road for accessibility could be right on target but could cost a lot of time
Provision of road for accessibility could be right on target but could cost a lot of effort A.2 Easy Accessibility to education facility
C2-C3
Score 5
C2-C4
Score 2
Provision of road for accessibility could cost less money but takes a lot of time to implement it
Provision of road for accessibility could cost less money but have a lower of worker number that build the road access
A.2 Easy Accessibility to education facility C3-C4
Score 4
Provision of road for accessibility could be take lower time but increase the labor efforts
A.3 Educational Campaign to raise awareness C1-C2
Score 0,2
C1-C3
Score 3
C1-C4
Score 5
The campaign could aim for the target but it cost a lot of money to pay the people
The campaign could aim for the target but it takes a lot of time for the campaign
The campaign could aim for the target but it takes a lot of efforts to do the campaign A.3 Educational Campaign to raise awareness
C2-C3
Score 3
C2-C4
Score 5
The campaign could have a less cost, but takes a lot of time to spend
The campaign could have a less cost, but increase the efforts to do it
A.3 Educational Campaign to raise awareness C3-C4
Score 3
The campaign could took a short time, but so much will put on efforts to it
17
Figure 23 Pairwise A.1 AHP
Figure 24 Pairwise A.2 AHP
Figure 25 Pairwise A.3 AHP
Figure 26 Normality A.1 AHP
Figure 27 Normality A.2 AHP
Figure 28 Normality A.3 AHP
Additional of new education facility
C1 C2 C3 C4
C1 1,00 0,20 5,00 2,00
C2 5,00 1,00 0,20 5,00
C3 0,20 5,00 1,00 5,00
C4 0,50 0,20 0,20 1,00
Easy accessibility to education facility
C1 C2 C3 C4
C1 1,00 2,00 4,00 5,00
C2 0,50 1,00 5,00 2,00
C3 0,25 0,20 1,00 4,00
C4 0,20 0,50 0,25 1,00
Educational campaign to raise awareness
C1 C2 C3 C4
C1 1,00 0,20 3,00 5,00
C2 5,00 1,00 3,00 5,00
C3 0,33 0,33 1,00 3,00
C4 0,20 0,20 0,33 1,00
C1 C2 C3 C4
C1 0,15 0,03 0,78 0,15
C2 0,75 0,16 0,03 0,38
C3 0,03 0,78 0,16 0,38
C4 0,07 0,03 0,03 0,08
Total 1,00 1,00 1,00 1,00
Total Average
1,12 0,28
1,32 0,33
1,35 0,34
0,21 0,05
4,00 1,00
PRIORITY 3
C1 C2 C3 C4
C1 0,51 0,54 0,39 0,42
C2 0,26 0,27 0,49 0,17
C3 0,13 0,05 0,10 0,33
C4 0,10 0,14 0,02 0,08
Total 1,00 1,00 1,00 1,00
Total Average
1,86 0,47
1,18 0,30
0,61 0,15
0,35 0,09
4,00 1,00
PRIORITY 2
C1 C2 C3 C4
C1 0,15 0,12 0,41 0,36
C2 0,77 0,58 0,41 0,36
C3 0,05 0,19 0,14 0,21
C4 0,03 0,12 0,05 0,07
Total 1,00 1,00 1,00 1,00
Total Average
1,03 0,26
2,11 0,53
0,59 0,15
0,26 0,07
4,00 1,00
PRIORITY 1
18
Figure 29 Consistancy A.1 AHP
Figure 30 Consistancy A.2 AHP
Figure 31 Consistancy A.3 AHP
A.1 Additional of new education facility
C1 C2 C3 C4 Total Average Consistancy
Measurement
C1 0,15 0,03 0,78 0,15 1,12 0,28 7,68
C2 0,75 0,16 0,03 0,38 1,32 0,33 6,25
C3 0,03 0,78 0,16 0,38 1,35 0,34 6,83
C4 0,07 0,03 0,03 0,08 0,21 0,05 6,10
Total 1,00 1,00 1,00 1,00 7,00 1,00 26,86
CI -0,047
RI 1,32
CR -0,036
DescriptionValue of CR <
0,1 (accepted) Additional of new education facilities could become the gateway to
face the low of human development index quality
A.2 Easy accessibility to education facility
C1 C2 C3 C4 Total Average Consistancy
Measurement
C1 0,15 0,12 0,41 0,36 1,03 0,26 8,64
C2 0,77 0,58 0,41 0,36 2,11 0,53 2,90
C3 0,05 0,19 0,14 0,21 0,59 0,15 3,92
C4 0,03 0,12 0,05 0,07 0,26 0,07 6,36
Total 1,00 1,00 1,00 1,00 7,00 1,00 21,82
CI -0,257
RI 1,32
CR -0,195
Description Value of CR <
0,1 (accepted) The easy access to school can also be the consideration of people to
move and to have a reachable routes to school that could also raise the dependency for youth to go to school.
A.3 Educational campaign to raise awareness
C1 C2 C3 C4 Total Average Consistancy
Measurement
C1 0,51 0,54 0,39 0,42 1,86 0,47 3,04
C2 0,26 0,27 0,49 0,17 1,18 0,30 11,89
C3 0,13 0,05 0,10 0,33 0,61 0,15 4,34
C4 0,10 0,14 0,02 0,08 0,35 0,09 3,35
Total 1,00 1,00 1,00 1,00 7,00 1,00 22,63
CI -0,224
RI 1,32
CR -0,169
DescriptionValue of CR <
0,1 (accepted) Through promoting the educational campaign, slowly but sure this step
will raise the awareness on how important education is for their future and how it impact the family, community, even Wonosobo Regency.
19 4.4 Result Visualization
After finish the analysis of 3 different methods from the substantial process of problem identification, development identification, and alternative formulation, to conclude and simplify the 3 methods that has been analyzed, below is the figure of processes.
Figure 32 Analysis Result Visualization
20 CHAPTER V CONCLUSION 5.1 Summary of Analysis
According to the comprehensive analysis through 3 methods that has been analyzed, the result are vary on each and every analysis. In a sense of Wonosobo Regency, the education plays a crucial role in terms to upgrade the quality of life for the people, and help the prospect of advancing in the economical sector of Wonosobo Regency. The education sector plays integral part in a way to affect the human development index. Through education, the quality of people will justify by itself to affects the statistical number of human development index.
The first methods of analysis is the cross tabulation, where it can be prove that the corelation between educational sector and expenditure per capita have the affection to the human development index. Second, the multiple regression analysis. In the multiple regression method, it can be prove that even though there are strong corelation between education and expenditure per capita in the previous analysis of cross tabulation, the result in the multiple regression is in a different way, where the education really affects the human development index rather than the expenditure per capita. This shows that not all people that has the courage and purchase of power has a good knowledge quality of education. Lastly, the alternative strategy to overcome the low quality education is through create several alternatives by using analytical hierarchy process namely provision of infrastructure, good accessibility, and educational campaign. From the 3 alternative, it is rated by calculating it from the criteria and will have the result of alternative that in a way to increase the education quality is through the provision of strong educational campaign and promotion, following to that the easy access to reach the facility, and lastly the provision of new education building is not really the urgencies of the provision, since what most important is that there need to be a strong eager of campaign to invite youth people to complete their school years, and show how important education for their life is.
By the success of strategy to improve both education quality and human development index, this will fosfer the potential of Wonosobo Regency not just relying on the natural resources, but also the qualified, and competent human resources to build a strong foundation to the development of rural and urban scale of planning in Wonosobo Regency.
21 REFERENCE
Mongan, J. (2019). Pengaruh pengeluaran pemerintah bidang pendidikan dan kesehatan terhadap indeks pembangunan manusia di Indonesia. Indonesian Treasury Review:
Jurnal Perbendaharaan, Keuangan Negara Dan Kebijakan Publik, 4(2), 163-176.
https://doi.org/https://doi.org/10.33105/itrev.v4i2.122
UNDP.(1990). Human Development report 1990.
New York: Oxford University Press
Dewi, Z., & Samudro, B. R. (2019). Kajian Eksistensi Dinasti Politik terhadap Perfroma Indikator Sosial Ekonomi Kabupaten Klaten. Dinamika: Jurnal Ekonomi Pembangunan, 11(1), 1–10.
Nugraha, R. (2018). Analisis Regresi Linear Berganda dengan SPSS. Deepublish.
Satrio, Eko Muliawan, and Agus Rochani. 2019. “Efektifitas Penerapan Konsep Smart City Ditinjau Dari Aspek Indeks Pembangunan Manusia Di Kota Semarang.” Pondasi 24(2):134. doi: 10.30659/pondasi.v24i2.7642.
BPS Kab.Wonosobo 2012-2022 Indeks Pembangunan Manusia (IPM) BPS Kab.Wonosobo 2012-2022 Rata-Rata Lama Sekolah (RLS) BPS Kab.Wonosobo 2012-2022 Pengeluaran per Kapita Disesuaikan Website.wonosobokab.go.id Geografis Kabupaten Wonosobo
22 APPENDIX Crosstab
Input the number that has been categorized and scored using excel.
In the settings, make sure to differentiate between the independent, and dependent variables.
23
In the statistics settings, tick the following as mentioned in the image above.
Result of analysis will be shown.
24 Multiple Regression
In the variable view, makesure that each and every coloumn is match.
Linear Regression menu, statistic, plots, save, and option.
In the linear regression menu, place the HDI (Y) in the dependet variable, and both of the (X1)
& (X2) in the independent variable.
Collinearity diagnostic is a tool to assume test the multi polinearity, meanwhile in the residual we click the Durbin-watson is to assumption test to correlation.
25
*ZPRED The standardized predicted values of the dependent variable. The residual is the vertical distance (or deviation) from the observation to the predicted regression line.
In the Save of linear regression setting make sure to tick the unstandarized prdicted variable to have the expected result later.
Last step is to makesure the entry in Linear regression option of use probability of F is .05 and .10 for removal. As well as to exclude the case listwise.
26 Analytical Hierarchy Process
In the questionaire fill and score based on the relation of criteria and alternatives.
Conduct a pairwise analysis, where the result of scoring in the questionaire is inputted in the pairwise.
27
In the normality test, it is aimed to know which of the priority of alternative is from the least and most important judging from the number that gets close to 1
Lastly, in the consistancy result is to know wether the CR value is below 0,1 and is accepted.
28
ATTACHMENT
http://bit.ly/AHP-Armeino
Scan or click the link above to access the excel worksheet of Analytical Hierarchy Process
Thank You