An Analysis of the Geographic, Facility, and Technological Patterns of
Indianapolis Public Library Patrons
Indiana University Public Policy Institute 334 N. Senate Avenue, Suite 300
Indianapolis, IN 46204
April 2013
An Analysis of the Geographic, Facility, and
Technological Patterns of Indianapolis Public Library Patrons
© April 2013 IU Public Policy Institute 13-C13 334 North Senate Avenue, Suite 300
An Analysis of the Geographic, Facility, and
Technological Patterns of Indianapolis Public Library Patrons
April 2013 13-C13
List of Tables ... ii
List of Figures ... ii
List of Maps ... ii
Executive Summary ... 1
Introduction ... 3
Methodology ... 3
Findings ... 4
Geographic Analysis ... 4
Comparison of Demographics between In-Person and Online Respondents ... 7
Age of respondents ... 8
Gender of respondents ... 9
Education of respondents ... 10
Income of respondents ... 11
Race/ethnic background of respondents ... 12
Comparison of library use between in-person and online respondents... 12
Distance traveled to library ... 13
Mode of transportation to the library ... 14
Frequency of visits ... 15
Time spent at the library ... 16
Principal purpose of visit to library ... 16
Use of technology by patrons ... 17
Technology ownership with or without Internet ... 18
Preferred reading format ... 19
Preferred e-book devices ... 23
Other online resources used ... 23
Comparison of Indianapolis Survey Responses with Other Library Surveys ... 24
Demographic Comparisons of Indianapolis Respondents to National Surveys ... 24
Age ... 24
Gender ... 24
Education ... 25
Income ... 25
Race/ethnic background ... 25
Library use comparisons of Indianapolis Respondents to National Surveys ... 26
Frequency of visits ... 26
Library use in the past 6 (Pew 12) months ... 26
Preferred reading formats ... 26
Conclusion ... 27
References ... 28
Authors
Laura Littlepage Elsa Kramer with John Patten
ii
List of Tables
Table 1: Number of patrons by IndyPL branch and percent residing outside Marion County ... 5
Table 2: Other branches visited by IndyPL respondents in the last six months, 2012... 7
Table 3: Library use on most recent visit, IndyPL in-person and online survey respondents, 2012 ... 16
Table 4: Library use in the past six months, IndyPL in-person and online survey respondents, 2012 ... 17
Table 5: Preferred reading format by age, IndyPL in-person and online survey respondents, 2012 ... 20
Table 6: Preferred reading format by income, IndyPL in-person and online survey respondents 2012 ... 21
Table 7: Preferred reading format by education, IndyPL in-person and online survey respondents, 2012 ... 21
Table 8: Preferred reading format by distance traveled to the branch, IndyPL in-person and online survey respondents, 2012 ... 22
Table 9: Preferred reading format by frequency of visits, IndyPL in-person and online survey respondents, 2012 ... 22
Table 10: Preferred e-book devices and frequency of e-book use, IndyPL in-person and online respondents, 2012 ... 23
Table 11: Other online resources used, IndyPL in-person and online respondents, 2012 ... 23
List of Figures
Figure 1: Age of IndyPL in-person and online survey respondents, 2012 ... 8Figure 2: Gender of IndyPL in-person and online survey respondents, 2012 ... 9
Figure 3: Education of IndyPL in-person and online survey respondents, 2012 ... 10
Figure 4: Household income of IndyPL in-person and online survey respondents, 2012 ... 11
Figure 5: Race/ethnicity of IndyPL in-person and online survey respondents, 2012 ... 12
Figure 6: Distance from home to IndyPL branch, in-person and online survey respondents, 2012 ... 13
Figure 7: Mode of transportation to IndyPL branch, in-person and online survey respondents, 2012... 14
Figure 8: Frequency of visits to IndyPL branch, in-person and online survey respondents, 2012... 15
Figure 9: Time spent at the library, in-person and online survey respondents, 2012 ... 16
Figure 10: Technology ownership, IndyPL in-person and online survey respondents, 2012... 18
Figure 11: Preferred reading format, IndyPL in-person and online survey respondents, 2012 ... 19
Figure 12: Reasons why patrons read e-books, IndyPL in-person and online survey respondents, 2012 ... 20
List of Maps
Map 1: Distribution of IndyPL patrons based on circulation records, December 2 – 22, 2012 ... 4Map 2: Distribution of IndyPL patrons based on circulation records, Marion County only, December 2 – 22, 2012 ... 6
Executive Summary
As part of a strategic planning process, the Indianapolis Public Library (IndyPL) is assessing data on current and projected library use. Because IndyPL access is evolving to accommodate new technologies, evaluation includes analysis of how the IndyPL’s services and facilities will meet the needs of all users. IndyPL asked the Indiana University Public Policy Institute (PPI) to provide assistance with this assessment. Data were collected in four ways: online surveys, in- person surveys, facility use analysis, and geographical analysis. This report presents overview maps and analysis of the surveys for the library system as a whole; it also compares survey results with national or other library survey data where questions align.
Since the 1990s, surveys in all disciplines have increasingly moved from being administered face-to-face and by telephone to online surveys in an effort to improve time and cost efficiencies and reach more people. Including an in-person survey in this study’s methodology allowed PPI to identify noteworthy demographic differences between in-person library visitors and patrons surveyed online, and between Indianapolis and national survey (such as Pew) respondents.
While demographic data on Indianapolis online respondents often parallel those in national library surveys conducted by phone or online, data on in-person visitors at the branches differ from both Indianapolis online and national responses. A combination of in-person and online survey methods may result in a more accurate picture of IndyPL users and point to
considerations for library marketing and outreach.
Indianapolis in-person respondents were younger, had lower income and less education, and were more likely to be black males than online respondents, Pew respondents, and the Marion County (IN) population in general. In-person respondents were more likely than online
respondents to travel a short distance to their primary branch. Most respondents in both groups drive to the library, but almost four times as many in-person respondents said they walk.
All of the online respondents and more than half of the in-person respondents had visited at least one other branch in addition to their home branch in the last six months. In-person
respondents most often named Central, Glendale, or College branches, and online respondents most often named Central, Glendale, or Nora.
In-person respondents were 10 times as likely as Pew respondents to visit the library 3 times a week or more. In-person respondents said they visited the library 12 times as often as online respondents, and were more than 4 times as likely to have used the computer or accessed Wi- Fi during their most recent visit.
Most respondents in both groups visited the library in the past six months to check out or return materials, pick up holds, or browse. However, in-person patrons were 27 times more likely than online respondents to use the library for research and reference, and 13 times more likely to visit to pay fines, use a copier or printer, or conduct other administrative or revenue-generating
2
All Indianapolis respondents prefer to read books in traditional print format. Preference for anything other than or in addition to print increases with education. Preferred reading format is also tied to income.
Because Internet access no longer requires a desktop computer, survey respondents were asked about their use of various electronic devices and how they use IndyPL’s resources. Their responses, and the differences in the responses between the in-person and online groups, point to the continuing existence of a “digital divide” in Marion County.
Indianapolis online respondents were more likely to own computers, tablets/e-readers, cell phones, or game consoles with Internet access than in-person respondents. A correlation has been shown between increased Internet accessibility and demand for traditional information sources (Bekkerman& Gilpin, 2013). With the federal government’s recent push to increase broadband spectrum available for unlicensed wireless devices (Federal Communications
Commission [FCC], 2013b), and as more patrons acquire wireless devices, the IndyPL may see increasing demand for traditional materials at the same time use of the web branch increases.
Introduction
As part of a strategic planning process, the Indianapolis Public Library (IndyPL) is assessing data on current and projected library use. Because Library access is evolving to accommodate new technologies, evaluation includes analysis of how the library’s services and facilities will be defined to meet the needs of all users. IndyPL has asked the Indiana University Public Policy Institute (PPI) to provide assistance with this assessment. This report presents the results of those analyses.
Methodology
Data were collected in four ways: online surveys, in-person surveys, facility use analysis, and geographical analysis. In winter 2012, IndyPL staff sent current patrons who had provided email addresses a link to an online survey, which was available for approximately two weeks. IndyPL received 12,089 responses out of a total of 135,000 messages sent, for a response rate of 11 percent.
IndyPL staff also conducted an in-person survey with similar questions to the online survey over a two-week period in December 2012. The goal was to survey approximately 100 adult visitors who may not use email or whose email addresses may not be part of the IndyPL’s patron
database at each of the 22 library branches, the Central Library, and bookmobiles. The potential respondents were first asked if they had taken this survey previously. IndyPl staff received training on survey administration and were instructed to cover various day-of-week and time-of- day periods to capture the full range of visits. The in-person survey resulted in 2,427 responses.
PPI developed the in-person and online survey instruments with input from IndyPL staff.
In addition, staff observed data on each patron’s physical use of the facility and plotted for use in a site analysis of space allocation and building design. Also, IndyPL staff transmitted
circulation data from a three-week period to PPI, allowing analysts to use patrons’ home addresses to develop a geographical analysis of materials borrowed during that time. PPI mapped user locations as listed on their IndyPL accounts, which resulted in a composite map of activity throughout Marion County and detailed maps for each of the individual branch libraries.
Data specific to each branch are presented under separate cover.
This report presents overview maps and analysis of the surveys for the IndyPL system as a whole. It also compares survey results with national or other library survey data where questions align.
4
Findings
Geographic Analysis
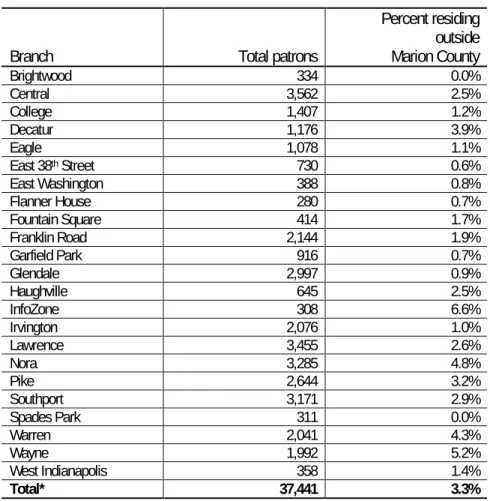
As Map 1 illustrates, IndyPL patrons who checked out materials reside throughout the metropolitan area, but are concentrated within Marion County. Each of the surrounding communities has its own library system; non-residents of Marion County must pay a fee to borrow materials from the Indianapolis Public Library. As Table 1 shows, the distribution of out- of-county patrons varies by branch. Map 2 presents the distribution of patrons in Marion County.
Map 1: Distribution of IndyPL patrons based on circulation records, December 2 – 22, 2012
Table 1: Number of patrons by IndyPL branch and percent residing outside Marion County
Branch Total patrons
Percent residing outside Marion County
Brightwood 334 0.0%
Central 3,562 2.5%
College 1,407 1.2%
Decatur 1,176 3.9%
Eagle 1,078 1.1%
East 38th Street 730 0.6%
East Washington 388 0.8%
Flanner House 280 0.7%
Fountain Square 414 1.7%
Franklin Road 2,144 1.9%
Garfield Park 916 0.7%
Glendale 2,997 0.9%
Haughville 645 2.5%
InfoZone 308 6.6%
Irvington 2,076 1.0%
Lawrence 3,455 2.6%
Nora 3,285 4.8%
Pike 2,644 3.2%
Southport 3,171 2.9%
Spades Park 311 0.0%
Warren 2,041 4.3%
Wayne 1,992 5.2%
West Indianapolis 358 1.4%
Total* 37,441 3.3%
*Total includes the addresses of patrons checking out materials from school sites, museum sites, or through IndyPL’s outreach services.
6
Map 2: Distribution of IndyPL patrons based on circulation records, Marion County only, December 2 – 22, 2012
In-person respondents were assumed to be visiting their home branch. The plurality of online respondents identified Lawrence as their home branch (5.5 percent); followed by Central (5.0 percent); East 38th Street (4.6 percent); and Haughville, Southport, InfoZone, and Warren (4.5 percent each). Branches least often named were Decatur (3.9 percent), Brightwood (3.8 percent), Pike (3.7 percent), and Nora (3.1 percent).
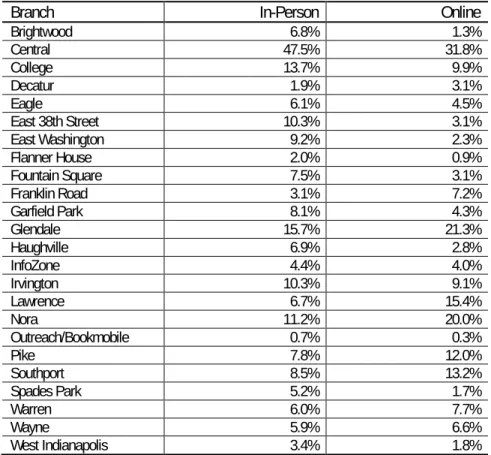
Nearly all (95 percent) online respondents and 58 percent of in-person respondents had visited at least one other branch in addition to their home branch in the last six months. As Table 2 indicates, when asked to identify other branches they had visited in the past six months, in- person respondents most often named Central (47.5 percent) and least often named Decatur (1.9 percent) and Flanner House (2.0 percent). Online respondents also named Central most often (31.8 percent), along with Glendale (21.3 percent), and Nora (20.0 percent), and least often named West Indianapolis (1.8 percent), Spades Park (1.7 percent), Brightwood (1.3 percent), Flanner House (0.9 percent), and outreach services (0.3 percent).
Table 2: Other branches visited by IndyPL respondents in the last six months, 2012
Branch In-Person Online
Brightwood 6.8% 1.3%
Central 47.5% 31.8%
College 13.7% 9.9%
Decatur 1.9% 3.1%
Eagle 6.1% 4.5%
East 38th Street 10.3% 3.1%
East Washington 9.2% 2.3%
Flanner House 2.0% 0.9%
Fountain Square 7.5% 3.1%
Franklin Road 3.1% 7.2%
Garfield Park 8.1% 4.3%
Glendale 15.7% 21.3%
Haughville 6.9% 2.8%
InfoZone 4.4% 4.0%
Irvington 10.3% 9.1%
Lawrence 6.7% 15.4%
Nora 11.2% 20.0%
Outreach/Bookmobile 0.7% 0.3%
Pike 7.8% 12.0%
Southport 8.5% 13.2%
Spades Park 5.2% 1.7%
Warren 6.0% 7.7%
Wayne 5.9% 6.6%
West Indianapolis 3.4% 1.8%
Comparison of Demographics between In-Person and Online Respondents
Noteworthy demographic differences exist between the two Indianapolis groups surveyed. In- person respondents were younger and had lower income and less education than online
respondents, and also a higher percentage of the in-person respondents were black males than the online respondents.
8
Age of respondents
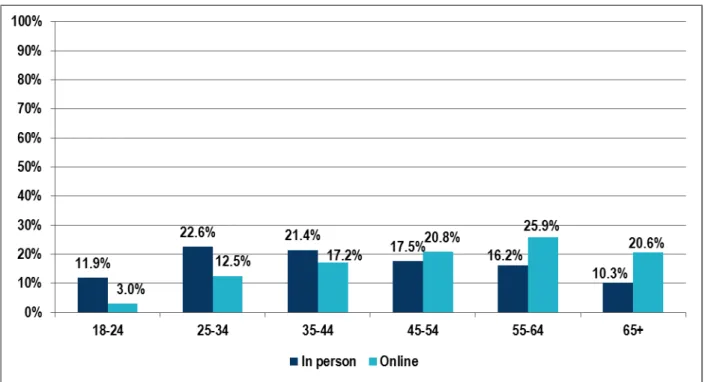
As Figure 1 illustrates, more in-person respondents were ages 25 to 44 (44.0 percent), while more online patrons were 45 to 64 (46.7 percent). In Marion County, 29 percent of all residents are ages 25 to 44 and 25 percent are ages 45 to 64 (Indiana Business Research Center, 2011b).
Figure 1: Age of IndyPL in-person and online survey respondents, 2012
Gender of respondents
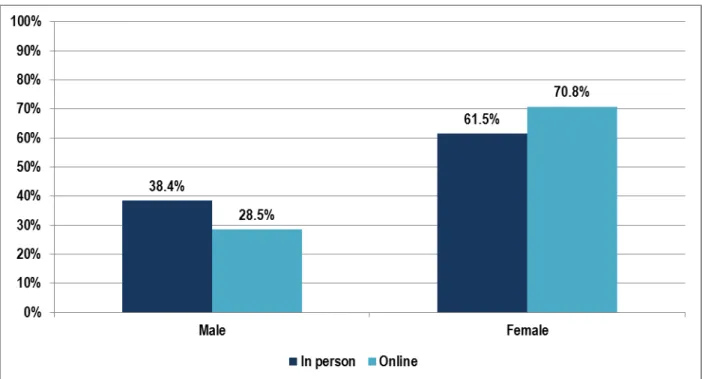
Most respondents in both survey groups were female, but the gender gap was narrower in the visitors surveyed in person, with online respondents more likely to be female (70.8 percent) than in-person respondents (61.5 percent) (see Figure 2). Some online respondents identified as other (0.7 percent).
Figure 2: Gender of IndyPL in-person and online survey respondents, 2012
10
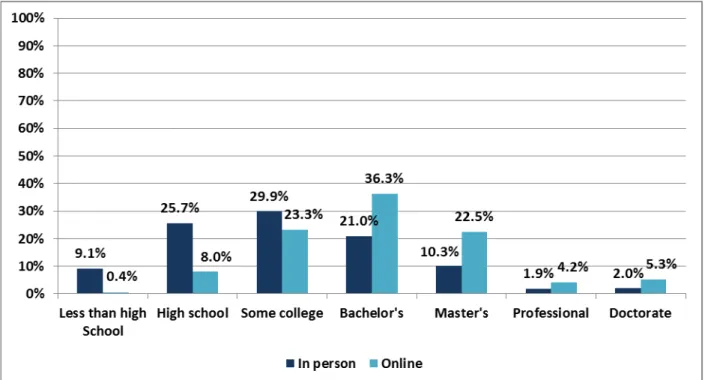
Education of respondents
As shown in Figure 3, most of the in-person respondents completed less than a bachelor’s degree (64.8 percent) and more than one-third completed high school or less (34.9 percent). In contrast, most of the online respondents completed a bachelor’s degree or more (68.3 percent), and almost one-third completed a master’s degree or more (32.0 percent). In Marion County, 84.2 percent of all adults ages 25 and up have completed high school or more, and 27.1 percent have completed a bachelor’s degree or more (Indiana Business Research Center, 2011b).
Figure 3: Education of IndyPL in-person and online survey respondents, 2012
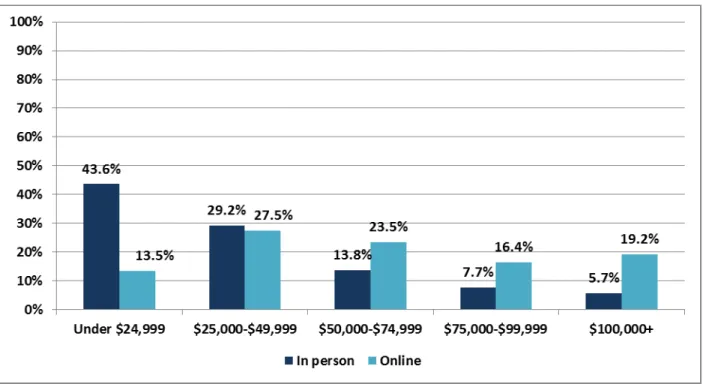
Income of respondents
A majority of in-person visitors reported having household incomes less than $50,000 (72.8 percent), with most of those having incomes less than $25,000 (43.6 percent).A majority of online patrons reported household incomes above $50,000 (59.1 percent), with most of those having incomes above $75,000 (35.6 percent) (see Figure 4).
Figure 4: Household income of IndyPL in-person and online survey respondents, 2012
12
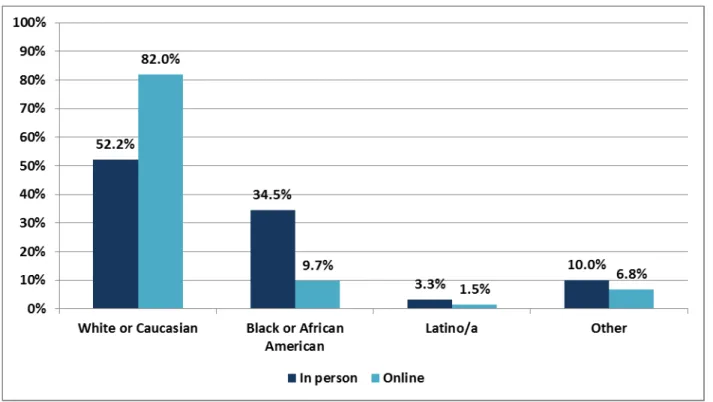
Race/ethnic background of respondents
As Figure 5 illustrates, although most survey respondents identified as White or Caucasian, the number was higher for online respondents (82.0 percent) compared with in-person visitors (52.2 percent) and compared with the Marion County population in general (59.6 percent non-
Hispanic White). More in-person visitors identified as Black or African American (34.5 percent) compared with online respondents (9.7 percent) and to the Marion County population in general (25.6 percent non-Hispanic Black). Few respondents in either group identified as Latino/a (in person, 3.3 percent; online, 1.5 percent) compared with the Marion County population in general (9.6 percent of all races identify as Hispanic). Respondents in the other category include those who identified as Asian, Pacific Islander, Native American, or multi-ethnic as well as those who chose not to reply (in person, 5.7 percent; online, 3.2 percent).
Figure 5: Race/ethnicity of IndyPL in-person and online survey respondents, 2012
Comparison of library use between in-person and online respondents
Some differences exist in the way the two groups surveyed use the library. Most respondents to the in-person survey said they are library cardholders (84.2 percent). All online respondents (100 percent) are cardholders; they received the electronic survey because they had provided email contact information in their library cardholder accounts.
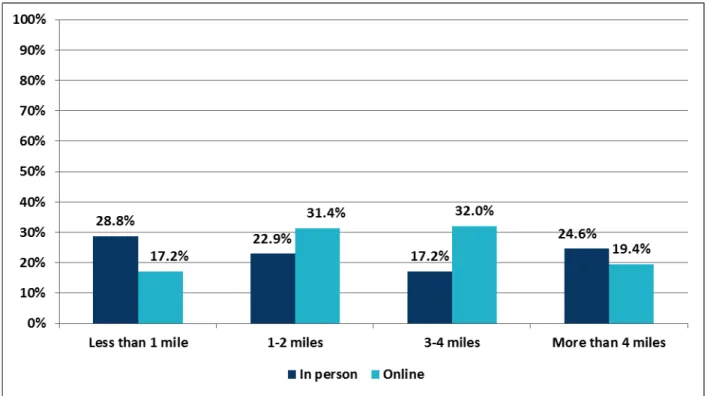
Distance traveled to library
As Figure 6 illustrates, more people who were surveyed in person travel less than one mile to their library branch (28.8 percent) compared with those who were surveyed online (17.2
percent). Although “close proximity to a library is strongly associated with higher rates of library use” (Bhatt, 2010), many Indianapolis respondents reported traveling more than four miles to their primary branch (24.6 percent in person; 19.4 percent online). “Library use is visibly higher among households that live near the library compared with those who live farther away” (Bhatt, 2010).
Figure 6: Distance from home to IndyPL branch, in-person and online survey respondents, 2012
14
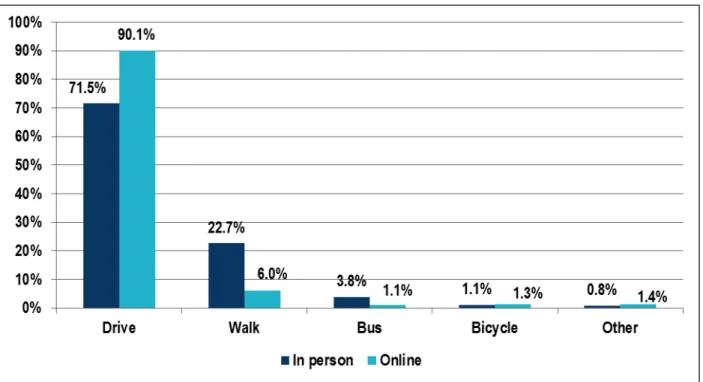
Mode of transportation to the library
A majority of respondents in both groups (see Figure 7) drive to the library (in person, 71.5 percent; online, 90.1 percent) while more in-person respondents indicated that they walk (22.7 percent). Many online respondents noted in the comments that they walk or ride a bicycle when the weather permits.
Figure 7: Mode of transportation to IndyPL branch, in-person and online survey respondents, 2012
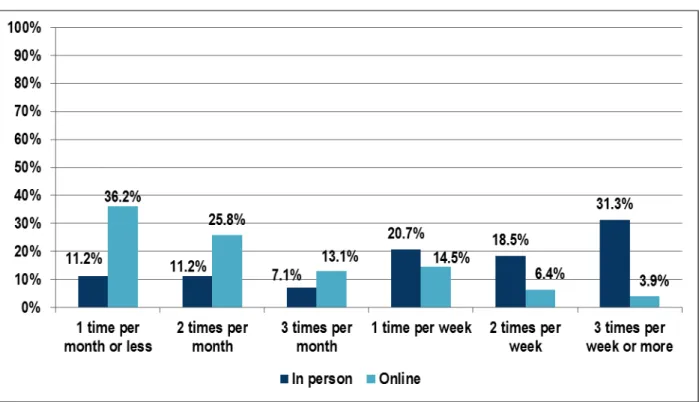
Frequency of visits
As Figure 8 shows, a majority of online respondents (75.1 percent) visit the library three times per month or less, with almost half of those (36.2 percent) visiting once a month or less. In contrast, a majority of in-person respondents (70.5 percent) visit the library once a week or more, with almost half of those (31.3 percent) visiting three times per week or more.
Figure 8: Frequency of visits to IndyPL branch, in-person and online survey respondents, 2012
16
Time spent at the library
As Figure 9 illustrates, while most respondents typically spend less than an hour in the library (in person, 63.9 percent; online, 84.4 percent) nearly half of all respondents spend 30 minutes to 2 hours in the library (in person, 46.1 percent; online, 47.3 percent).
Figure 9: Time spent at the library, in-person and online survey respondents, 2012
Principal purpose of visit to library
Table 3 shows that in their most recent visit to the library, in-person respondents were most likely to have checked out materials/picked up holds (56.0 percent) or used the
computers/accessed Wi-Fi (36.8 percent). In their most recent visit to the library, online
respondents were most likely to have checked out materials/picked up holds (41.4 percent) or to have browsed (22 percent).
Table 3: Library use on most recent visit, IndyPL in-person and online survey respondents, 2012
In person Online
Checked out materials 40.8% 40.4%
Picked up holds 15.2% 1.0%
Returned materials 16.7% 18.8%
Browsed 14.0% 22.0%
Used computer 31.1% 4.9%
Used Wi-Fi 5.7% 3.3%
Read books 4.8% 1.2%
Read magazines and/or newspapers 3.5% 0.9%
Attended program for children 2.5% 1.0%
Attended meeting 1.1% 1.0%
Attended program for adults 2.0% 0.8%
Other 7.2% 4.7%
Table 4 indicates that most respondents visited the library to borrow materials (in person, 76.7 percent; online, 84.8 percent), return materials (in person, 63.7 percent; online, 84.2 percent), or browse (in person, 50.7 percent; online, 64.4 percent). The other category, which allowed respondents to specify any other reason, is broken out in the table below for Downloaded/got help with e-books, because it is an an area of focus for this report.
Table 4: Library use in the past six months, IndyPL in-person and online survey respondents, 2012
In person Online
Checked out materials 76.7% 84.8%
Returned materials 63.7% 84.2%
Picked up holds 38.9% 78.0%
Browsed 50.7% 64.4%
Used computer 66.0% 20.4%
Used Wi-Fi 18.1% 11.3%
Read books 26.5% 15.0%
Read periodicals 21.1% 15.9%
Attended program for children 10.4% 6.9%
Attended meeting 3.6% 5.0%
Attended program for adults 0.8% 5.2%
Other 2.3% 8.8%
Downloaded/got help with e-books 0.0% 0.9%
Use of technology by patrons
According to Federal Communication Commission Chairman Julius Genachowski,
approximately one in three Americans, or about 100 million people, still do not have broadband Internet access at home, and most of these are minority and low-income persons (FCC, 2013a).
In Marion County, Indiana, 40 percent to 60 percent of households do not have broadband Internet connection at home (Indiana Business Research Center, 2011a). The Pew Research Center confirms that although the access gap based on race has narrowed in the last decade,
“Internet use remains strongly correlated with age, education, and household income” (Zickuhr
& Smith, 2012). Because so many employers post job openings exclusively online and because most jobs today require some type of computer use, having digital literacy skills and access to high-speed Internet is crucial for completing education, finding and keeping a job, and
interacting with government (FCC, 2013a).
Public library users “in disadvantaged neighborhoods tend to use library resources on site more so than off site” (Japzon & Gong, 2005). While only 4 percent of people who have broadband connection at home also access the Internet in a public library, 20 percent of those who do not have broadband and 9 percent of those who have dial-up service at home use the public library for Internet access (Economic and Statistics Administration & National Telecommunications and Information Administration, 2011). Nevertheless, a correlation has been shown between
increased Internet accessibility and demand for traditional information sources (Bekkerman &
Gilpin, 2013). With the federal government’s recent push to increase broadband spectrum available for unlicensed wireless devices (FCC, 2013b), IndyPL may see increasing demand for traditional materials at the same time virtual use of the web branch increases.
Because Internet access no longer requires a desktop computer, survey respondents were
18
responses, and the differences between the responses from in-person and online respondents, point to the continuing existence of a “digital divide.”
Technology ownership with or without Internet
As Figure 10 illustrates, Indianapolis online respondents were more likely to own a computer (95.3 percent with Internet, 2.7 percent without) than in-person respondents (62 percent with internet, 13 percent without). Online respondents were more likely to own a tablet or e-reader with internet access (59.9 percent) than in-person respondents (28.6 percent). The two groups were unlikely to own tablets or e-readers without internet access (in person, 3.9 percent; online, and 5.4 percent). Online respondents were more likely to own cell phones with internet access (72.8 percent) than in-person respondents (63.8 percent), who were slightly more likely to own cell phones without internet access (27.2 percent) than online respondents (25.3 percent).
Online respondents were more likely to own game consoles with internet access (40.5 percent) than in-person respondents (29.9 percent). Both groups were equally likely to own game consoles without internet access (in person, 14.9 percent; online, and 14 percent).
Figure 10: Technology ownership, IndyPL in-person and online survey respondents, 2012
Preferred reading format
Indianapolis respondents prefer to read books in traditional printed format (in person, 67.9 percent; online, 63.7 percent). All respondents show similar preferences for reading e-books (in person, 5.1 percent; online, 7 percent) or both e-books and print books (in person, 22.1 percent;
online, 20.7 percent) (see Figure 11).
Figure 11: Preferred reading format, IndyPL in-person and online survey respondents, 2012
20
As Figure 12 indicates, Indianapolis respondents like to read e-books because of instant access (in person, 58.1 percent; online, 69.1 percent) and mobility (in person, 43.7 percent; online, 57.2 percent).
Figure 12: Reasons why patrons read e-books, IndyPL in-person and online survey respondents, 2012
As Table 5 illustrates, over half (61.2 percent) of in-person respondents who prefer e-books were between 25 and 44, while almost two-thirds (64 percent) of online respondents with this preference were over 45. A similar pattern follows for those who responded online that they prefer both print and e-books (61.3 percent over 45) while for those who responded in person the distribution is more evenly distributed, similar to the pattern for those who prefer print books.
Table 5: Preferred reading format by age, IndyPL in-person and online survey respondents, 2012
E-books Print Both print and e-books Audio books
Age In person Online In person Online In person Online In person Online
18-24 14.3% 2.7% 11.6% 3.2% 5.3% 3.1% 11.4% 0.9%
25-34 34.7% 14.0% 21.2% 11.5% 21.2% 16.1% 24.6% 9.7%
35-44 26.5% 19.2% 20.1% 16.5% 21.8% 19.6% 26.5% 15.1%
45-54 13.3% 18.3% 17.7% 21.0% 18.2% 20.3% 17.9% 22.4%
55-64 9.2% 26.7% 17.5% 25.6% 22.4% 24.1% 12.9% 32.1%
65+ 2.0% 19.0% 11.8% 22.2% 11.2% 16.9% 6.7% 19.7%
As Table 6 illustrates, almost half of the in-person respondents with preference for e-books reported a household income of less than $25,000 (44.8 percent), while online respondents had a similar percentage (45.3 percent) of household incomes over $75,000. For those who prefer both print and e-books, income of in-person respondents was more evenly distributed, with 33.6 percent below $25,000, but not for those who responded online, with 42.3 percent over $75,000.
Table 6: Preferred reading format by income, IndyPL in-person and online survey respondents 2012
E-books Print Both print and e-books Audio books
In person Online In person Online In person Online In person Online Less than
$25,000 44.8% 7.9% 46.2% 15.2% 33.6% 10.6% 25.2% 9.2%
$25,000-
$49,999 29.2% 22.7% 28.3% 29.3% 32.9% 23.9% 35.1% 26.3%
$50,000-
$74,999 12.5% 24.2% 13.4% 23.5% 15.3% 23.2% 18.5% 24.6%
$75,000-
$99,999 8.3% 20.1% 6.7% 15.2% 11.0% 18.7% 11.9% 17.2%
$100,000+ 5.2% 25.2% 5.4% 16.8% 7.2% 23.6% 9.3% 22.6%
Table 7 shows that in-person respondents with a preference for e-books are most likely to have completed high school or some college (68.7 percent), while online respondents who prefer e- books are most likely to have completed graduate degrees (64.7 percent). Similarly, in-person respondents who said they prefer both print and e-books are mostly likely to have completed high school or some college (48.3 percent), while online respondents who prefer both formats are most likely to have completed graduate degrees (66.3 percent). In-person respondents who prefer audio books are most likely to have completed some college or a bachelor’s degree (57.8 percent), while online respondents who prefer audio books are most likely to have completed graduate degrees (62.5 percent).
Table 7: Preferred reading format by education, IndyPL in-person and online survey respondents, 2012
E-books Print Both print and e-books Audio books
In person Online In person Online In person Online In person Online Less than
high school 6.1% 0.2% 8.5% 0.4% 7.4% 0.4% 6.1% 0.2%
High school 30.4% 22.7% 27.0% 23.7% 14.1% 22.0% 15.0% 22.4%
Some college 38.3% 5.7% 29.2% 5.1% 34.2% 5.9% 32.2% 6.3%
Bachelor’s 13.9% 6.7% 21.8% 8.6% 24.8% 5.5% 25.6% 8.5%
Master’s 7.0% 36.0% 9.5% 36.2% 15.2% 37.5% 13.3% 35.2%
Professional 3.5% 4.3% 2.0% 4.2% 1.8% 4.3% 2.2% 3.7%
Doctorate 0.9% 24.4% 2.0% 21.8% 2.5% 24.5% 5.6% 23.6%
Table 8 illustrates that among those who said they prefer e-books, in-person respondents are most likely to travel less than one mile to the library (38.6 percent), while online respondents are most likely to travel one to two miles to the library (33.2 percent). Among those who said they prefer print books, in-person respondents are most likely to travel less than one mile to the library (30.3 percent), while online respondents are most likely to travel one to two miles (32.5 percent). Among those who said they prefer a combination of print and e-books, in-person respondents are most likely to travel more than four miles (30.7 percent), while online
22
they prefer audio books, in-person respondents are most likely to travel more than four miles (30.7 percent), while online respondents are most likely to travel three to four miles (36.3 percent).
Table 8: Preferred reading format by distance traveled to the branch, IndyPL in-person and online survey respondents, 2012
E-books Print Both print and e-books Audio books
In person Online In person Online In person Online In person Online
Less than 1 mile 38.6 % 14.5% 30.3% 18.0% 28.0% 16.9% 25.7% 12.4%
1-2 miles 21.9% 33.2% 25.8% 32.5% 23.0% 28.8% 24.6% 27.5%
3-4 miles 14.9% 30.4% 18.9% 31.5% 18.3% 32.7% 19.0% 36.3%
More than 4 miles 24.6% 21.9% 25.0% 18.0% 30.7% 21.6% 30.7% 23.8%
Table 9 shows that among those who said they prefer print books, most in-person respondents visited two times per week or more (50.2 percent), while most online respondents visited two times per month or less (59.1 percent). Of those who said they prefer e-books, most in-person respondents visited one time per week or more (67.8 percent), while most online respondents visited one time per month or less (68.2 percent). Of those who said they prefer both print and e-books, most in-person respondents visited the library two times per week or more (46.6 percent), while most online respondents visited two times per month or less (64.1 percent). Of those who said they prefer audio books, most in-person respondents visited two times per week or more (46.6 percent), while most online respondents visited two times per month or less (60.4 percent).
Table 9: Preferred reading format by frequency of visits, IndyPL in-person and online survey respondents, 2012 E-books Print Both print and e-books Audio books In person Online In person Online In person Online In person Online
1 time per month or less 12.5% 68.2% 11.2% 32.6% 9.4% 37.4% 6.2% 32.8%
2 times per month 10.7% 16.1% 11.1% 26.5% 12.4% 26.7% 14.6% 27.6%
3 times per month 8.9% 7.3% 6.5% 13.6% 10.2% 13.1% 7.9% 15.2%
1 time per week 22.3% 3.5% 21.0% 15.8% 21.4% 13.7% 24.7% 15.5%
2 times per week 11.6% 2.8% 18.4% 7.3% 19.0% 5.5% 21.9% 5.4%
3 times per week or
more 33.9% 2.0% 31.8% 4.2% 27.6% 3.6% 24.7% 3.5%
Preferred e-book devices
As Table 10 indicates, Indianapolis respondents who read e-books prefer to read them on their tablets (in person, 52.4 percent; online, 81.5 percent). In-person respondents are more likely to read e-books on the computer (in person, 36.3 percent; online, 21.5 percent), while both groups are less likely to read them on cell phones (in person, 26.0 percent; online, 22.0 percent).
Table 10: Preferred e-book devices and frequency of e-book use, IndyPL in-person and online respondents, 2012
Daily Weekly Monthly
In person Online In person Online In person Online
Computer 13.7% 4.9% 10.0% 6.4% 12.6% 10.2%
Tablet (iPad, Kindle, etc.) 20.3% 39.9% 15.9% 24.7% 16.2% 16.9%
Cell phone 14.2% 7.0% 5.6% 6.6% 6.2% 8.5%
Other online resources used
As Table 11 illustrates, online respondents use online resources primarily for email (95 percent), banking (72.8 percent), maps (69.9 percent), and shopping (68.8 percent). In-person
respondents use online resources primarily for email (85.5 percent), social media (56.4 percent), and research (55.7 percent). Social media (in person, 56.4 percent; online, 56.3 percent) and entertainment use (in person, 51.3 percent; online, 51.2 percent) were similar for both groups. In-person respondents were more likely to go online for job search or application (37.7 percent) than online respondents (24.0 percent).
Table 11: Other online resources used, IndyPL in-person and online respondents, 2012
In person Online
Email 85.5% 95.0%
Online banking 44.7% 72.8%
Website or blog 42.6% 59.7%
Government Interaction 21.7% 23.9%
Shop 43.8% 68.8%
Social media 56.4% 56.3%
Research 55.7% 66.4%
Job search or application 37.7% 24.0%
Maps 44.6% 69.9%
Online education 25.4% 21.0%
Selling 8.2% 8.8%
Entertainment 51.3% 51.2%
None 2.6% 0.6%
Other 2.4% 1.5%
24
Comparison of Indianapolis Survey Responses with Other Library Surveys
PPI compared the Indianapolis Public Library surveys with other research data where the questions aligned, including parts of the 2012 Pew national telephone survey of library patrons (Zickhur, Rainie, and Purcell 2013) the public libraries section of the 2011 Harris Interactive national telephone survey of library patrons for the American Library Association (2011), and OCLC’s (2010) Harris Interactive national online survey of library patrons. No recent survey data were available from comparable-size public library systems in Charlotte, Cincinnati, Columbus, Jacksonville, or St. Louis.
Midwestern respondents to the ALA/Harris survey are most likely to have visited the library in the prior 12 months (73 percent). All Pew respondents had visited the library in the prior 12 months. The typical Pew respondent visits once per month or more (36 percent) and is a non- Hispanic white female over 30 years old with a high school diploma or a college degree and income of less than $50,000 per year. Similarly, the typical in-person respondent to the Indianapolis survey visits the library once per week or more (70.5 percent) and is a non- Hispanic white female age 25 to 44 with a high school diploma or some college and income of less than $25,000. However, the typical online respondent to the Indianapolis survey visits the library three times per month or less (76.5 percent) and is a non-Hispanic white female over age 45 with a bachelor’s degree or more and income over $25,000. The typical OCLC respondent borrows from a public library at least once a year (59 percent) and is over age 45 (43 percent).
National surveys have long found that “the typical public library users were white, middle class, and well educated. [W]hy are so many poor and less educated blacks and Hispanics not using public libraries from which they can benefit the most? What could be done to increase the participation of these disadvantaged groups in public library use?” (Japzon & Gong, 2005).
Demographic data on Indianapolis online respondents parallel those in national library surveys conducted by phone or online, while data on in-person visitors at the branches differ from both Indianapolis online and national responses. A combination of in-person and online survey methods may result in a more accurate picture of library users and point to considerations for library marketing and outreach.
Demographic Comparisons of Indianapolis Respondents to National Surveys Age
Pew telephone survey respondents were fairly evenly distributed, with each of the six age group frequencies tracking close to the arithmetic mean of 16.65 percent. In-person respondents to the Indianapolis survey trended younger, more likely to be ages 25 to 34 (21 percent) and 35 to 44 (19.9 percent), while online respondents trended older, more likely to be ages 45 to 54 (20.8 percent) and 55 to 64 (25.9 percent). Compared to the Pew respondents, Indianapolis in-person respondents were less likely to be over age 65 (9.5 percent), while online respondents were more likely to be over age 65 (20.6 percent). OCLC online respondents were most likely to be over age 45 (43 percent).
Gender
Pew telephone and OCLC online respondents were almost evenly divided by gender (51 percent female, 49 percent male) compared to Indianapolis respondents, who were more likely to be female (61.5 percent in person; 70.8 percent online). A majority of female ALA/Harris respondents (72 percent) and most male respondents (58 percent) with library cards visited the library in the prior 12 months. A majority of female ALA/Harris respondents ages 18 to 34 have
a library card (75 percent), and a majority of female respondents ages 35 to 54 visited the library in the prior 12 months (77 percent).
Education
Fewer Indianapolis patrons had only a high school diploma (in person, 25.7 percent; online, and 8.0 percent) than Pew respondents (29.4 percent). More Indianapolis patrons surveyed online had completed college (36.3 percent) than in-person respondents (20.9 percent) and Pew respondents (26.8 percent). The ALA/Harris survey showed that 74 percent of library
cardholders with some college and 77 percent of those who completed college visited the library in the prior 12 months.
Income
Most Indianapolis patrons surveyed in person reported household incomes less than $50,000 (72.8 percent) compared to patrons surveyed online (41 percent) and Pew respondents who visited in the past year (52.9 percent). Fewer Indianapolis patrons surveyed in person had income above $50,000 (13.8 percent) than those surveyed online (23.5 percent) and in the Pew survey (16.8 percent). More Indianapolis patrons surveyed online reported household incomes above $75,000 (35.6 percent) compared to those surveyed in person (13.2 percent) and in the Pew survey (30.3 percent). A majority of ALA/Harris respondents with income over $100,000 have a library card (65 percent).
Race/ethnic background
Pew survey responses on race and ethnicity closely tracked U.S. Census data: 67.4 percent non-Hispanic whites (census 63.4 percent), 11.1 percent non-Hispanic blacks (census 13.1 percent), and 14.3 percent Hispanic (census 16.7 percent) (U.S. Census, 2012). In contrast, responses on the Indianapolis Library surveys varied notably from census data. The population of Marion County is 59.6 percent non-Hispanic whites, 25.6 percent non-Hispanic blacks, and 9.6 percent Hispanic (IBRC, 2011b). However, in-person respondents identified as 52.2 percent white, 34.5 percent black, and 3.3 percent Latino. Online respondents identified as 82 percent white, 9.7 percent black, and 1.5 percent Latino.
26
Library use comparisons of Indianapolis Respondents to National Surveys Frequency of visits
Indianapolis patrons surveyed in person were more than three times as likely to visit the library weekly (20.7 percent) as patrons surveyed online (6.4 percent) and respondents in the Pew phone survey (8 percent). Almost one-third (31.3 percent) of in-person respondents reported visiting three times per week or more, compared to 3.9 percent of online respondents, and 3 percent of Pew respondents.
Library use in the past 6 (Pew 12) months
Most respondents in all surveys visited the library to borrow materials (Indianapolis in person, 76.7 percent and online, 84.8 percent; Pew 73 percent) or browse (Indianapolis in person, 50.7 percent and online, 64.4 percent; Pew 73 percent). Pew respondents were more likely to borrow or download e-books (7 percent) than Indianapolis respondents (in person, 0 percent; online, 0.9 percent). Pew responses about borrowing materials were distributed over multiple formats, including print books (73 percent), audio books (17 percent), CDs (15 percent), and videos (40 percent). OCLC respondents borrowed DVDs at about the same rate (36 percent). In-person respondents to the Indianapolis survey were less likely to browse (50.7 percent) than online patrons (64.4 percent) and Pew respondents (73 percent) but far more likely to use the
computers (66 percent) than online patrons (20.4 percent) and Pew respondents (31 percent).
OCLC respondents reported borrowing materials at least monthly (28 percent) or at least once a year (59 percent). Pew respondents were more likely to study or get reference help (50 percent) than Indianapolis respondents (in person, 35 percent; online, 1.3 percent) and more likely to attend or bring a child to a program (41 percent) than Indianapolis respondents (in person, 10.4 percent; online, 6.9 percent). Pew respondents were also more likely to attend a program for adults (21 percent) than Indianapolis respondents (in person, 0.8 percent; online, 5.2 percent) and more likely to attend a group meeting (23 percent) than Indianapolis respondents (in person, 3.6 percent; online, 5 percent).
Preferred reading formats
Indianapolis survey respondents read printed books or a combination of printed and e-books at about the same frequency (in person, 90 percent; online, and 84.8 percent) as those in the Pew survey read printed books (89 percent). Indianapolis respondents were less likely to prefer e- books (in person, 5.1 percent; online, and 7.1 percent) than Pew respondents (30 percent). One recent study shows that even though e-books may be physically easier to read, people in all age groups still prefer paper (Kretzschmar, Pleimling, Hosemann, Füssel, Bornkessel-Schlesewsky,
& Schlesewsky, 2013). However, because U.S. public library circulation of e-books quadrupled from 2010 to 2011 (Library Journal, 2012), demand for them in Indianapolis appears unusually low. Pew respondents were also more likely to listen to audio books (17 percent) than
Indianapolis respondents (in person, 8.1 percent; online, and 7.3 percent). Some Indianapolis respondents said that they do not read books in any format (in person, 5.8 percent; online, 0.9 percent), a question none of the national surveys asked.
Conclusion
Demographic data on Indianapolis online respondents parallel those in national library surveys conducted by phone or online. Including both in-person and online survey groups in the IndyPL study results in a more accurate picture of all library users and points to considerations for library marketing and outreach.
Indianapolis in-person respondents were younger and had lower income and less education than online respondents, and also were more likely to be black males than Indianapolis online and national respondents. Indianapolis in-person respondents were more likely to live within walking distance of their home branch and to visit the library to use the computers or access Wi- Fi than online respondents.
Although IndyPL e-book circulation has increased recently, demand for e-books in Indianapolis appears low compared to national data. Nevertheless, the majority of respondents in both groups own computers and cell phones with Internet access, and a majority of online respondents own tablets with Internet access, indicating potential for future demand of electronic materials. A recent study in the Journal of Urban Economics points to a correlation between increased Internet accessibility and demand for traditional information sources
(Bekkerman & Gilpin, 2013). With the federal government’s recent push to increase broadband spectrum available for unlicensed wireless devices (FCC, 2013b), the library may anticipate an increased demand for traditional materials as well as increased virtual use of the web branch.
Demographic data on Indianapolis online respondents parallel those in national library surveys conducted by phone or online. Including both in-person and online survey groups in the IndyPL study results in a more accurate picture of all Library users and points to considerations for Library marketing and outreach.
The Indianapolis Public Library is an important destination within the community, providing educational, economic, and social value to Marion County citizens. Because many people in the county do not have broadband Internet connection at home, and because Internet use is tied to age, education, and household income, IndyPL helps to build a literacy bridge across the “digital divide,” providing access to the information crucial for completing education, finding and keeping a job, and interacting with government.
28
References
American Library Association. (2011). State of America’s libraries report 2011: Public libraries.
Retrieved from http://www.ala.org/news/mediapresscenter/americaslibraries/publiclibraries Bekkerman, A., & Gilpin, G. (2013, in press). High-speed Internet and the demand for locally
accessible information content. Journal of Urban Economics.
http://dx.doi.org/10.1016/j.jue.2013.03.009
Bhatt, R. (2010, April 3). The impact of public library use on reading, television, and academic outcomes. Journal of Urban Economics, 68, 148-166. Retrieved from
http://www2.gsu.edu/~ecorrb/index_files/PublicLibrary.pdf
Economic and Statistics Administration & National Telecommunications and Information
Administration. (2011, November). Exploring the digital nation: Computer and Internet use at home. Retrieved from
http://www.esa.doc.gov/sites/default/files/reports/documents/exploringthedigitalnation- computerandinternetuseathome.pdf
Federal Communications Commission. (2013a, February 14). Digital literacy gap
announcement. Retrieved from http://www.fcc.gov/events/digital-literacy-gap-announcement Federal Communications Commission. (2013b, February 20). FCC acts to significantly increase
spectrum available for unlicensed devices in the 5 GHz band. Retrieved from
http://transition.fcc.gov/Daily_Releases/Daily_Business/2013/db0220/DOC-319025A1.pdf Indiana Business Research Center. (2011a, May-June). Broadband adoption in Indiana.
InContext, 12(3). Retrieved from http://www.incontext.indiana.edu/2011/may-jun/article1.asp Indiana Business Research Center. (2011b). STATS Indiana. Retrieved from
http://www.stats.indiana.edu/index.asp
Japzon, A., & Gong, H. (2005, October). A neighborhood analysis of public library use in New York City. Library Quarterly, 75(4), 446-463. Retrieved from
http://www.dx.doi/10.1086/502786
Kretzschmar, F., Pleimling, D., Hosemann, J., Füssel, S., Bornkessel-Schlesewsky, I., &
Schlesewsky, M. (2013). Subjective impressions do not mirror online reading effort:
Concurrent EEG-eyetracking evidence from the reading of books and digital media. PLoS ONE 8(2). Retrieved from http://dx.doi.org/10.1371/journal.pone.0056178
Library Journal. (2012). 2012 Ebook usage in U.S. public libraries. [Research report]. Retrieved from http://www.library.arkansas.gov/PublicLibraryServices/Documents/Ebook-Usage- Report-Public.pdf
OCLC. How Americans use online sources and their libraries. Perceptions of libraries, 2010:
Context and community. Retrieved from
https://www.oclc.org/content/dam/oclc/reports/2010perceptions/howamericansuse.pdf
Rainie, L., & Duggan, M. (2012, December 27). E-book reading jumps; print book reading declines. Pew Research Center Internet & American Life Project. Retrieved from http://libraries.pewinternet.org/2012/12/27/e-book-reading-jumps-print-book-reading- declines/
Smith, A. (2010, August 11). Home broadband 2010. Pew Research Center Internet & American Life Project. Retrieved from http://pewinternet.org/Reports/2010/Home-Broadband-
2010.aspx
United States Census Bureau. (2012).Retrieved from http://quickfacts.census.gov/qfd/states/18000.html
Zickuhr, K., Rainie, L., & Purcell, K. (2013, January 22). Library services in the digital age. Pew Research Center Internet & American Life Project. Retrieved from
http://libraries.pewinternet.org/files/legacy-pdf/PIP_Library percent20services_Report_012213.pdf
Zickuhr, K., & Smith, A. (2012, April 13). Digital differences: Internet adoption over time. Pew Research Center Internet & American Life Project. Retrieved from
http://www.pewinternet.org/Reports/2012/Digital-differences/Main-Report/Internet-adoption- over-time.aspx
30 About the IU Public Policy Institute
The IU Public Policy Institute (PPI) is a collaborative, multidisciplinary research institute within the Indiana University School of Public and Environmental Affairs (SPEA). PPI serves as an umbrella organization for research centers affiliated with SPEA, including the Center for Urban Policy and the Environment and the Center for Criminal Justice Research. PPI also supports the Indiana Advisory Commission on Intergovernmental Relations (IACIR).
32