An analysis of the relationship between LASIK Surgery and the popularity of ophthalmology as a specialty choice for medical
students
Darien Paone
Advisor: Dr. Malcolm Getz
Economics Honors Thesis
Introduction:
Medical students’ preferences for residency positions affect the number of new doctors entering medical specialties. The popularity of these specialties determines that specialty’s projected supply of physicians, as medical students must choose a residency position that
narrows their focus to pursue specific fields. Although the number of overall residency positions is determined by the amount of available government funding, the percentage of positions filled for each specialty varies significantly. Students deciding which medical specialty to enter most commonly consider aspects of the field such as work hours, compensation, and medical
malpractice likelihood. Because of their balance of a comfortable lifestyle and high earnings, a group of specialties including emergency medicine, radiology, ophthalmology, anesthesiology, and dermatology (collectively called the EROAD specialties) have stood out in last decade as competitive and sought after options for medical students14,32. Furthermore, since the early 1990’s, Medicare reimbursement rates have fallen, causing to doctors receive less money per procedure in compensation2. Some specialties, such as ophthalmology, plastic surgery, and dermatology are able to secure revenue from procedures that are paid for outside of the mandates set by insurance and regulations2,4. These procedures like cosmetic surgery, laser hair removal, Botox injections, and refractive eye surgery are not medically necessary and so are not covered by medical insurance4, and so patients seeking these procedures must pay doctors directly as if they were any regular good or service. For physicians, performing these procedures allows them to avoid extensive paperwork and avoid reduced payments by managed care and insurance companies and provides them with up front payments, often for larger sums than traditional procedures. In 2000, elective procedures accounted for nearly 25% of revenues for plastic surgery and dermatology practices in urban areas, up from 10% in 19954. For this reason, these
specialties, which provide elective services such as refractive eye surgery and cosmetic dermatology injections like Botox, have also increasingly become more popular.
Ophthalmology is of particular interest to study because ophthalmologists have been the only physicians able to gain revenue from elective refractive surgery procedures such as Laser- Assisted in situ Keratomileusis (LASIK) surgery since the mid 1990’s when the procedure was FDA-approved for use outside of clinical trials5. The surgery has only been approved for use by board certified ophthalmologists, and so any effect the onset of LASIK surgery may have had on physician earnings will apply only to the field of ophthalmology5. This study will aim to study the effects that LASIK surgery has had on the popularity of ophthalmology residency positions and also to determine if it has had a positive effect on the annual compensation of
ophthalmologists.
LASIK surgery is an outpatient surgical procedure used to correct nearsightedness, farsightedness, and astigmatism. During LASIK surgery, an ophthalmologist uses a laser to reshape the cornea to improve the way the eye focuses light rays in order to improve vision5. Since its introduction the market in 1998, LASIK surgery has developed in a non-insurance market and has quickly grown into a medically and financially successful billion-dollar annual industry. Between 2002 and 2012, the cost of
LASIK surgery per eye increased by 39% in inflation adjusted figures, and the surgery required only 10-15 minutes for an
ophthalmologist to complete40. The increase and then decrease in price of the surgery follows a general trend encountered by new
goods entering the market. From 2002 to 2005, the price per eye increased from $1,870 to
$2,25040, presumably a result of demand exceeding the supply of physicians performing the surgery. As more competition entered the LASIK surgery market, the price per eye decreased slightly and also stabilized, with less variation in price decrease occurring past 2007.
LASIK surgery further stands out as the best option to study the direct effects of an elective procedure of specialty field because it is relatively easy for ophthalmologists to begin performing the surgery (relative to other specialists). In order to perform LASIK, an
ophthalmologist needs to be trained to use the laser required to change the shape of the cornea.
Each laser company requires physicians to successfully complete a course specific to the use of their laser. These courses may either be given for free as an incentive to purchase that company’s laser or be offered for a fee costing an upwards of $1000. The equipment is generally owned by a corporate laser center or hospital, by which the ophthalmologist is employed, and therefore the ophthalmologist has very minimal startup costs to begin performing LASIK. Ophthalmologists can also lease or buy their own equipment, which can then cost in the range of $250,000 to
$500,0005.
Several studies have focused on how higher annual earnings and more structured work hours contribute to a medical student’s decision to pursue ophthalmology, but few have investigated how ophthalmology turned into a such a sought after field. I hope that by determining a relationship between the increased popularity of an elective procedure such as LASIK eye surgery and the popularity of the corresponding medical specialty among residents will give insight into how the new technology or procedures in the medical field can affect the recognition of a medical specialty as a sought after career.
Importance for Future Policy:
It is also important to understand how medical students choose their residency positions, and therefore medical specialty, because these decisions have significant relevance to federal healthcare policy. Because of the way the government allocates that funding for residency positions, each year there are a fixed number of residency positions available in each specialty for medical school students to enter to receive their Graduate Medical Education (GME).
Graduate Medical Eduaction (GME) describes the graduate training that occurs during residency.
GME is the only gateway to become a practicing physician in the United States, because all doctors must complete some form of graduate training from an accredited United States GME program. The direct cost to train one resident averages over $100,000 per year, per student, which translates to a national total cost of approximately $13 billion dollars annually. 10,38
A majority of funding for GME comes from Medicare. The number of medical residency positions that Medicare will pay was set in the 1997 Balanced Budget Act. Since 1997, there has been no increase in the number of federally funded positions. The law imposes a hospital-
specific limit on the number of residents that Medicare will pay for, and in general, this limit is based on the number of residents the hospital trained in 1996. Smaller sources of funding include the Office of Veteran’s Affairs, state GME funding, and federal funding for children’s hospitals.
The number of GME positions has remained deadlocked in 1997 at approximately 20,000-21,000 positions per year. This has raised concern than a bottleneck effect will occur in the near future as the Association of American Medical Colleges (AAMC) has called for an increase in medical school class size by 30% nationwide by 2015. The current GME positions are distributed as follows at the PGY-1 level: 15,500-16,00 US Doctor of Medicine (62%), 3,000 Doctor of Osteopathic Medicine (12%) and 6,700 International Medical Graduate (26%) positions, for a
total of 25,500 total new residents. Medicare pays hospitals directly to cover a portion of the direct costs of training residents. These costs include the residents’ stipends, teaching physicians’
salaries, and related overhead expenses. The amount of the payment that hospitals receive is related to the share of the hospitals’ inpatients of whom are Medicare beneficiaries, the number of residents the hospital is allowed to count, and also on a hospital specific per resident amount.
10,12,38,41
The distribution of residency positions in a particular hospital is determined by the hospital’s physicians available for teaching, funding in each department, and access to patients for training residents, among other variables. A 2007 JAMA publication discussed the process of expanding the workforce of ophthalmologists by 2020. The article explained that this would be a
“cumbersome process”, as it would require approval from the sponsoring institution, funding commitments from hospitals and medical schools, and ACGME approval. Because of the approximate 6 year time lag between expanding residency recruitment and the graduation of these residents, the researchers determined that a decision to increase the number of
ophthalmology training positions by 20% would take longer than 20 years to effect a 10%
change in the number of ophthalmologists in practice. This difficultly in expanding residency programs helps explain why there has only been a meager 1.54% increase in ophthalmology residency positions between 1996 and 2011. During this time period, there was 10.47% increase in the fill rate of ophthalmology residency positions by USMDs and a parallel decrease by 10.47% by US grads and international medical graduates, which corresponds to an increase in popularity as a specialty choice. If demand for ophthalmologists has in fact increased due to LASIK surgery, it will be important to gauge exactly how significant of an impact it has made in order to anticipate future demand for ophthalmologists. It follows that this will be important
information to have in order to best distribute limited GME funding in order to anticipate the number of necessary residency positions.
Literature Review:
Extensive research has been dedicated to observing trends in medical student preferences for residency positions, and how these preferences have affected the fill and match rates for different specialty’s residency programs. A study by Dorsey et al 2003 published in the Journal of the American Medical Association sought to determine to what degree having a controllable lifestyle had on changes in specialty preferences of United States medical school seniors
(USMDs) from 1996 to 200214. Whether or not a specialty was considered to have a controllable or uncontrollable lifestyle was determined from a paper by Schwartz et al 1989 in which
controllable lifestyle specialties were defined as those in which the physician had control over the number of hours devoted to practicing the specialty. The study compared 16 specialties and the analysis found that in a log-linear model, controllable lifestyle explained 55% of the
variability in specialty preference from 1996 to 2002 after controlling for income, work hours, and years of graduate medical education required (P<0.001). It is important to comment on the classification system this paper used to determine which specialties had controllable lifestyles.
Dorsey et al 2003 referenced a paper published by Schwartz et al 1989, which is a widely cited paper for research on residents’ preference of medical specialties. In this paper, the authors sought to determine why there was a decrease in interest among residents for surgery and primary care positions. They arbitrarily designated specialties as having controllable or
uncontrollable lifestyles, and family practice was designated as having an uncontrollable lifestyle along with all of the surgical specialties. This could be because in the past family practitioners
were responsible for making house calls on their patients and doing rounds in hospitals where their patients were admitted. However, this practice structure for family practitioners is no longer considered the norm, as hospitalists and acute care physicians have taken over those functions.
Therefore, I believe that the standard hours and no expectations of taking call for a family practice physician would designate them as having a controllable lifestyle, and this is the designation I use throughout this paper.
Research has also focused on the relationship between anticipated annual compensation and the popularity of specialties. A study also published in JAMA by Mark Ebell, MD, MS, examined whether there is association between specialty selection by USMDs and anticipated income37. Using data from the 2007 National Residency Matching Program (NRMP) match results and 2007 annual American Medical Group Association survey of physician salaries, the author calculated Pearson product moment correlation coefficients between mean salary and fill rates by USMDs for each specialty. Fill rate is defined as the number of USMDs matched to each specialty divided by the number of positions offered. The analysis showed a strong, direct
correlation between specialties with higher overall annual salaries and higher fill rates with USMDs (r=0.82: P=0.001). This strong correlation suggests that anticipated income is a strong determinant for students choosing medical residencies.
A paper in the Transactions of the American Ophthalmological Society Journal examined the overall field for ophthalmology from 1980 to 2006 to measure trends in marketplace demand for ophthalmologists1. They used data over a 26-year period to develop a help wanted index (HWI) to measure the impact of the economy on the marketplace for ophthalmologists. It found that over the course of the study, there was an increase in demand for subspecialty and academic ophthalmologists and that the ophthalmologic community was responsive to the demand. The
paper did not investigate why an increase in demand for ophthalmologists has occurred, but found statistically significant results about the correlation between the median compensation of academic ophthalmologists and demand of academic ophthalmologists using data on median compensation from the Physician Compensation and Production Survey series of the Medical Group Management Association (MGMA). A multiple regression analysis was run between the HWI data and physician compensation data and determined that the median compensation of academic ophthalmologists was significantly correlated with the demand for ophthalmologists with a P-value of 0.0226.
Although few papers have focused on how the LASIK surgery has affected the field of ophthalmology, a paper by Mitchell et al. 2002 did focus on how changes in cataract surgery directly changed the behavior of ophthalmologists26. They found that the implementation of the Medicare Fee Schedule (MFS) in 1992 that affected ophthalmologists’ earnings caused
ophthalmologists to change their provision of non-cataract services to Medicare patients between 1992 and 1994. The MFS decreased in the average fee for a cataract extraction by 17.4%. This decrease in fee directly affects the revenue to an ophthalmologist per cataract extraction. The data showed that a 10% reduction in the fee for a cataract extraction caused ophthalmologists to supply approximately 5% more non-cataract surgeries, presumably to make up lost revenue due to the cataract fee reduction. Their research also suggested that physicians may behave more like profit maximizing firms than as target income seekers. This implies that physicians did not engage in demand inducement in order to achieve a targeted level of income when the
reimbursement scale changed, but rather that physicians act as other profit maximizing firms and engage in the activities that garner the most beneficial results. Published in 2002, this paper looks at trends in ophthalmology prior to the introduction of LASIK surgery but demonstrates
how physicians respond quickly to changes in their compensation through their practice.
Furthermore, if physicians do in fact behave as profit maximizing firms, it follows that ophthalmology would emerge as a pursued specialty if LASIK surgery represented a new opportunity to increase profits.
Data:
The data used in this paper includes time series data on residency match outcomes and physician compensation for ophthalmology, family practice, emergency medicine and
anesthesiology. In order to establish an indicator for the year in which LASIK was introduced to the market, annual data was also collected on the percentage of ophthalmologists performing LASIK surgery.
The data for anesthesiology, emergency medicine, and family practice function as controls in order to determine if there has been a significant change in the popularity of ophthalmology as a specialty due to an increase in income from a procedure not covered by medical insurance. Unlike ophthalmologists, these three specialties only receive compensation from procedures or office and emergency room visits through insurance companies. More simply, there are few opportunities for these physicians to perform elective procedures that would be directly paid for by consumers. All of the specialties do however, share the lifestyle (regular work hours, few emergencies) designated by medical students as an important characteristic of their desired specialty, and so will control for the possibility that ophthalmology is increasingly sought after for its lifestyle39. More specifically, using anesthesiology and emergency medicine as bases for the regressions will control for the possibility that ophthalmology is sought after as a
member of the EROADS specialties, which are higher-paying specialties with more comfortable lifestyles.
Match Rate Data
Data for residency match outcomes was derived from the National Residency Matching Program (NRMP) results and the San Francisco Match Program (SF Match) results27-31,33. The NRMP conducts the residency matching for family practice, emergency medicine, and
anesthesiology and has released a report of results and data on that year’s appointments to residencies since 1984.
The NRMP uses their program, Main Residency Match, to match applicants and programs using both of their rank ordered lists. To apply to residency programs, students first complete residency applications through the Electronic Residency Application Service (ERAS).
Residency programs then invite applicants to interviews, after which residency programs and students submit rank order lists for their preferences. The match algorithm works by attempting to match the student to their most preferred choice according to their rank order list before placing them in following positions. The attempt to match continues until the applicant gets a match or until all of the applicant’s choices on their rank order lists have been exhausted19.
The SF Match completes ophthalmology residency matching. Similar to the NRMP process, all candidates applying through SF Match and complete a universal application that is distributed to the residency programs that the applicants designate. The residency programs select applicants for interviews, which each applicant can accept or decline. Following the interview process, applicants and residency programs submit rank lists to the match. The match is an algorithm that uses the preferences expressed in the rank-order lists to place applicants into residency positions45.
The data for family practice shows the match results for post-graduate year 1 (PGY-1) matches, which corresponds to students matching into their first year of residency. During the time period for this data, the field of anesthesiology was in the process of converting PGY-2 positions into PGY-1 positions, so these numbers were aggregated to maintain consistency throughout the data set. The data for ophthalmology and match results is also for PGY-2, as ophthalmology residents must first match into their ophthalmology residencies and then match into another PGY-1 residency (usually internal medicine) through the NRMP32.
The popularity of a medical specialty can be gauged by determining the number of residents in the specialty who are graduates of US allopathic medical schools (USMDs)11,14,19. Less popular specialties have fewer USMDs and more International medical graduates (IMGs) and US medical students who have graduated but did not match during their first attempt (US grads)19. Papers by both Gildasio et al 2012 and Green et al 2009 found that specialties that have the majority of positions filled by USMDs may be considered more competitive than specialties that fill with a high percentage of IMGs and US grads. The paper done by Giladasio et al 2012 found that although this phenomenon occurs across all specialties, it can be more accentuated as the specialty becomes more competitive. Therefore, it is more beneficial to only look at the match results for USMDs when determining the level of competitiveness across specialties.
Calculation of match rates was determined by calculating the percentage of USMDs who matched to their preferred specialty. A specialty position is defined as “preferred” if the
individual listed that specialty first on their rank order list or if it was the only specialty they listed on their rank order list. Match rate was calculated as:
Match Rate = (number of positions offered / number of preferred positions) x 100
Therefore, the match rate conveys the percentage of USMDs who received residency positions in the specialty they most wanted.
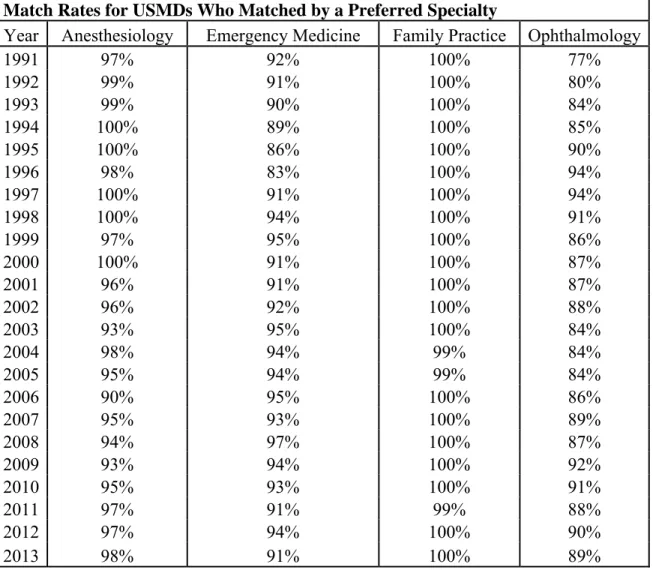
Andriole et al 2012 similarly determined match rates but defined a preferred position as a position solely listed on an individual’s rank order list. They found that lower USMD match rates indicated greater competitiveness among students for positions in the specialty. A summary of match rates for USMDs across the four specialties used in the analysis are summarized in Table 1.
Table 1. Match Rates for USMDs
Match Rates for USMDs Who Matched by a Preferred Specialty
Year Anesthesiology Emergency Medicine Family Practice Ophthalmology
1991 97% 92% 100% 77%
1992 99% 91% 100% 80%
1993 99% 90% 100% 84%
1994 100% 89% 100% 85%
1995 100% 86% 100% 90%
1996 98% 83% 100% 94%
1997 100% 91% 100% 94%
1998 100% 94% 100% 91%
1999 97% 95% 100% 86%
2000 100% 91% 100% 87%
2001 96% 91% 100% 87%
2002 96% 92% 100% 88%
2003 93% 95% 100% 84%
2004 98% 94% 99% 84%
2005 95% 94% 99% 84%
2006 90% 95% 100% 86%
2007 95% 93% 100% 89%
2008 94% 97% 100% 87%
2009 93% 94% 100% 92%
2010 95% 93% 100% 91%
2011 97% 91% 99% 88%
2012 97% 94% 100% 90%
2013 98% 91% 100% 89%
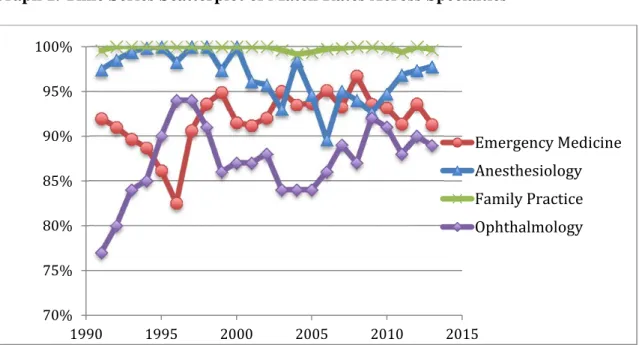
Graph 1. Time Series Scatterplot of Match Rates Across Specialties
The data for match rates shows the difference in competitiveness across specialties and also across time in each specialty. For example, family practice has consistently been an uncompetitive specialty for USMDs. 100% match rates indicate that any USMD who listed family practice residency as a preferred position has been able to receive a position in a program.
Ophthalmology remained a competitive specialty throughout the time period, but saw
fluctuations in competitiveness. The decrease in competitiveness after 1994 could correspond to the significant cut in cataract reimbursement rates that occurred in 1994, and the increase in competitiveness in 1999 could also correspond to the introduction of LASIK surgery. It is also interesting that between 1992 and 1996 the decrease in competitiveness, and therefore popularity, of ophthalmology corresponds to an increase in competitiveness and popularity for emergency medicine. In the time period when LASIK surgery entered clinical trials in 1996 and 1999, emergency medicine loses popularity while ophthalmology gains popularity.
70%
75%
80%
85%
90%
95%
100%
1990 1995 2000 2005 2010 2015
Emergency Medicine Anesthesiology Family Practice Ophthalmology
LASIK Surgery Data:
Times series data for the percent of ophthalmologists performing LASIK surgery and the number of LASIK surgeries performed per year measures the relative increase or decrease in the popularity of the surgery over time. The data for the percent of ophthalmologists performing LASIK surgery comes from the 2003 Practice Styles and Preferences survey of ASCRS (American Society of Cataract and Refractive Surgery) members21. The survey was mailed to 6350 members of ASCRS with a United States zip code, and there was an approximate 15%
response rate. Questions not answered were omitted from analysis. The ASCRS includes all ophthalmologists, not just those who choose to do refractive surgery, so the results of the time series data should provide a strong indication of how the overall field of ophthalmology transitioned to LASIK surgery. The percent of surveyed ophthalmologists performing LASIK surgery data includes both ophthalmologists who do some LASIK surgery and also those who practice exclusively as refractive surgeons; follow up questions on the form later specified how much time these doctors were dedicating towards LASIK surgery. According to this survey, 37%
of surveyed ophthalmologists were performing LASIK
surgery in 1998, and this number increased to 57% in 1999. Because a majority of opthalmologists were not performing LASIK surgery until 1999, I set the binary to 1999 instead of 1998 when LASIK surgery was officially made available to the public as an FDA-approved procedure.
Year % of surveyed opthalmologists performing LASIK
1996 6%
1997 17%
1998 37%
1999 57%
2000 60%
2001 56%
2002 54%
2003 55%
Physician Compensation Data:
The data for physician compensation was collected from the Medical Group Management Association’s (MGMA) annual physician compensation and production survey for the years 1996-201123-26. Annual median earnings were collected and adjusted for inflation by indexing each year to 2012 with the equation:
inflation adjusted annual compensation = (annual compensation/CPI deflator) x (CPI deflator- 2012)
Ophthalmology Anesthesiology Family Practice Emergency Medicine
Year
1996 $285,185 $329,939 $183,787 $249,786
1997 $288,934 $330,638 $184,340 $240,387
1998 $282,812 $331,548 $183,235 $233,510
1999 $285,278 $317,749 $183,691 $242,332
2000 $299,535 $355,297 $183,915 $251,465
2001 $322,196 $350,147 $180,966 $259,964
2002 $306,887 $370,331 $181,287 $255,412
2003 $356,740 $384,648 $181,305 $256,668
2004 $327,562 $380,895 $182,282 $259,008
2005 $345,800 $411,430 $183,844 $278,461
2006 $331,924 $407,711 $183,009 $278,975
2007 $344,517 $435,275 $189,508 $279,991
2008 $346,803 $390,775 $191,499 $275,123
2009 $354,437 $443,986 $192,828 $275,070
2010 $343,366 $420,401 $196,606 $288,545
2011 $361,536 $432,697 $204,338 $307,019
The original intention was to determine if an increase in annual growth rate corresponded to the time period after 1999 when LASIK was introduced. Unfortunately, limited data
availability and problems in physician compensation data prevented this from producing relevant results. The MGMA Physician Compensation and Production Survey is widely used for industry compensation benchmarking because it is one of the most comprehensive surveys and also has one of the largest sample sizes. However, a presentation by Business Valuation Resources (BVR), LLC highlighted key problems of current physician compensation survey data. First, the physician compensation surveys do not represent the marketplace. The MGMA survey, for example, relies on voluntary participation by physicians, meaning that respondents are not selected using statistical sampling methods. In addition to voluntary participation, physicians are also promised a free copy of the survey that retails for $730, which allows selection bias to also enter the data. The sample cannot be considered to be statistically representative of the physician marketplace. The MGMA physician compensation survey also only represents data from a
$0.00
$50,000.00
$100,000.00
$150,000.00
$200,000.00
$250,000.00
$300,000.00
$350,000.00
$400,000.00
$450,000.00
$500,000.00
1994 1996 1998 2000 2002 2004 2006 2008 2010 2012
AnnualMedianCompensation
Year
Annual Median Compensation by Specialty 1996-2011
Ophthalmology Anesthesiology
Practice settings can differ in the types and scope of services offered, and also in the economics of how a practice operates. For example, a large multispecialty physician group for
ophthalmology might offer pre- and post-operative care for LASIK surgery by partnering with an optometrist, whereas a smaller individual practice may only perform the actual surgery. The smaller physician group practices, in all specialties, are not taken into account in MGMA physician compensation survey data. This contributes to large ranges in the number of
physicians surveyed in each specialty. The pool for family practitioners is much larger than any other specialty. The larger pool size occurs because there are simply more family practitioners than specialist physicians due to family practitioners role as primary care doctors. Also, family practitioners are more likely to organize into large group practices that meet the MGMA survey criteria16. This causes the median salary data for family practice to include many more data points and contributes to skewed data results. From the available data, the only conclusive result that can be extrapolated is that the annual compensation for specialists has grown at a higher rate than family practitioners. From the available data, it cannot be determined whether or not LASIK surgery has had a significant effect on compensation in the field of ophthalmology.
Method:
Difference in difference matching was used to determine if the implementation of LASIK surgery had an effect on the match rates for ophthalmology. A binary was implemented for the years including and after 1999. Anesthesiology and emergency medicine were used as bases in order to control for the possibility that any change in ophthalmology match rate trends could be caused by a lifestyle factor.
The first regression used anesthesiology match rates as a base. Three regression equations were run:
1. MatchRateDifference(Ophthalmology-Anesthesiology) = binary + year + year*binary 2. MatchRateDifference(Family Practice-Anesthesiology) = binary + year + year*binary 3. DID = MatchRateDifference(Ophthalmology-Anesthesiology) -
MatchRateDifference(Family Practice-Anesthesiology)
The second regression used emergency medicine as a base. Three regression equations were run:
1. MatchRateDifference(Ophthalmology-Emergency Medicine) = binary + year + year*binary 2. MatchRateDifference(Family Practice-Emergency Medicine) = binary + year + year*binary 3. DID = MatchRateDifference(Ophthalmology-Emergency Medicine) -
MatchRateDifference(Family Practice-Emergency Medicine) Results:
The two sets of regression equations were run using the JMP Statistical software and the results are summarized below.
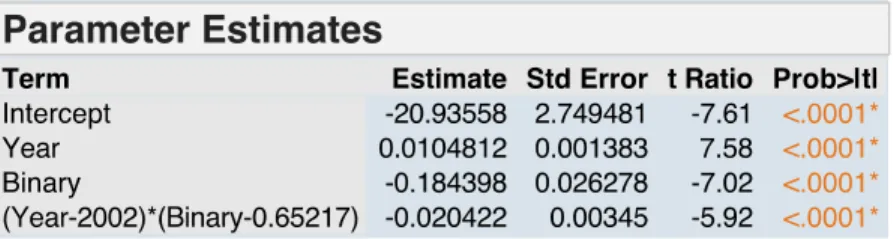
Table 2. Regression Results for MatchRateDifference(Ophthalmology-Anesthesiology)
The t-statistic for the binary for LASIK surgery was significant below the 5% level. This indicates that there was a significant difference in match rates between ophthalmology and anesthesiology after 1999 when the binary is introduced. Competition for ophthalmology residency positions increased relative to competition for anesthesiology residency positions.
Table 3. Regression Results for MatchRateDifference(Family Practice-Anesthesiology)
The t-statistic for the binary for LASIK surgery is not significant. This indicates that there was not a change in match rate trends after 1999. Because neither family practice nor anesthesiology introduced a change in their specialty during this time, it is consistent with expectations that there would not be a significant result with the binary.
Table 4. Difference-in-Difference Regression Results for Ophthalmology and Anesthesiology
With the control being anesthesiology, the significant t-statistics show that post 1999 there was a change in match rate patterns between ophthalmology and family practice.
Table 5. Regression Results for MatchRateDifference(Opthalmology-Emergency Medicine)
The t-statistic for the binary for LASIK surgery was significant below the 5% level. This indicates that there was a significant difference in match rates between ophthalmology and emergency after 1999 when the binary is introduced.
Table 6. Regression Results for MatchRateDifference(Family Practice-Emergency Medicine)
The t-statistic for the binary for LASIK surgery is not significant. This indicates that was not a change in match rate trends after 1999. Because neither family practice nor emergency medicine introduced a change in their specialty during this time, it is consistent with expectations that there would not be a significant result with the binary.
Table 7. Difference-in-Difference Regression Results for Ophthalmology and Emergency Medicine
With the control being emergency medicine, the significant t-statistics show that post 1999 there was a change in match rate patterns between ophthalmology and family practice.
Discussion:
USMD match rates change over time and reflect the competitiveness of a specialty for residency positions. It can be reasonably inferred that an increase in competitiveness of a
specialty would reflect an increase in popularity for the specialty as a career choice for students, as the increase in competition results from more students denoting the specialty on their rank
order lists. The match rate data shows that between 1991 and 1994, and also from 1998-2013 ophthalmology has been the most competitive specialty out of the four, with the percentages of students matching being lower than all other match rates. As previously mentioned, the decrease in popularity during the mid 1990’s can possibly be attributed to a sharp change in the field that came as a result of cataract reimbursement rates being significantly cut. Students could have decided to look to other specialties during this period, such as emergency medicine or another EROADS specialty, as a cut in payment for a high-volume procedure such as cataract surgery could have significant repercussions on the structure of a specialty field.
The period from 1998-2013 following LASIK surgery’s entrance into the United States market corresponds to the decrease in match rates. Statistical analysis supports the hypothesis that the introduction of LASIK surgery into the marketplace corresponded to the increase in popularity of ophthalmology as a specialty choice. Difference-in-difference matching for match rates using two different controls from the EROADS specialties, anesthesiology and emergency medicine, was statistically significant above the 99% confidence level. Statistical analysis for physician compensation data was not significant, but general trends show compensation for ophthalmology, emergency medicine, and anesthesiology (all EROADS specialties) rising faster than compensation for family practice.
The lack of statistical significance in physician compensation I believe most likely comes from insufficient survey data. However, there could be alternate explanations to explain the significance in results for match rates but not compensation data. Traditional economics would suggest that if LASIK surgery was driving an increase in physician income, the supply of ophthalmologists would increase, which would correspond to lower match rates. Over time, the increase in supply of ophthalmologists would drive increases in income back down to a long run
equilibrium. This, however, is not reflected in the data. It is possible that ophthalmologists view LASIK surgery as an alternative to traditional procedures, rather than as an additional procedure from which they can derive supplementary income. A time series investigation into procedure volumes for LASIK surgery and other common ophthalmologic procedures, such as cataract surgery, would perhaps provide information how ophthalmologists are using LASIK surgery to support their practices.
Conclusion:
The introduction of LASIK surgery represents a significant change in technology that has affected the field of ophthalmology, and this change is only one example of how the medical field has quickly advanced and presented new opportunities for both patients and doctors. With the pending transformation of the American health care system by the Affordable Care Act, it will become even more important to understand how the supply of physicians is determined in order to meet a growing physician demand. LASIK surgery may be a procedure that escapes this supply and demand problem by not falling under the umbrella of insurance-covered procedures, but it does bring to attention the significance of physician decisions on a medical specialty. If a novel medical procedure can affect the popularity of a medical specialty, it can have significant implications on the future supply of physicians in a specialty. Many papers have investigated what lifestyles factors contribute to a specialty’s popularity, but not many have examined how, or if, a specific change in technology or innovation can affect popularity. Since procedures have a significant affect on the lifestyle and also income of physicians, I believe that this is an
important area of research to continue in order to understand the future allocation of doctors across specialties.
Works Cited
1. Adelman, Ron a, and Chukwuemeka C Nwanze. “The Impact of the Economy and Recessions on the Marketplace Demand for Ophthalmologists (an American
Ophthalmological Society Thesis).” Transactions of the American Ophthalmological Society 109 (2011): 49–65.
2. Alderman, Amy K et al. “NIH Public Access.” 123.5 (2010): 1408–1413.
3. Andriole, Dorothy a, Alison J Whelan, and Kenneth B Schechtman. “Recent Trends in Match Process Outcomes for U.S. Senior Medical Students.” Academic medicine : journal of the Association of American Medical Colleges 78.10 Suppl (2003): S6–9.
4. “As Insurers Cut Fees, Doctors Shift to Elective Procedures - New York Times.” n. pag.
Print.
5. Assessment, Ophthalmic Technology. “Laser In Situ Keratomileusis for Myopia and Astigmatism : Safety and Efficacy.” 210837 (2002): 175–187. Print.
6. Bailey, Melissa D et al. “Reasons Patients Recommend Laser in Situ Keratomileusis.”
Journal of cataract and refractive surgery 30.9 (2004): 1861–6. Web. 9 Dec. 2013.
7. Cejka, Sue. “Special Report : Physician Compensation Physician Compensation in 1997 : ‘ Rightsized ’ and Stagnant.” January (1999): 55–62. Print.
8. Christensen, Clayton M. “Disruptive Innovation: Can Health Care Learn from Other Industries? A Conversation with Clayton M. Christensen. Interview by Mark D. Smith.”
Health affairs (Project Hope) 26.3 (2007): w288–95. Web. 15 Dec. 2013.
9. Chung, Kevin C et al. “NIH Public Access.” 123.4 (2010): 1385–1389.
10. David, Alan K. “Medical Education on a Collision Course: Sooner Rather Than Later?”
Family medicine 45.3 (2013): 159–63.
11. De Oliveira, Gildàsio S et al. “Factors Affecting Admission to Anesthesiology Residency in the United States: Choosing the Future of Our Specialty.” Anesthesiology 117.2 (2012): 243–
51.
12. DeZee, Kent J et al. “Effect of Financial Remuneration on Specialty Choice of Fourth-Year U.S. Medical Students.” Academic medicine : journal of the Association of American Medical Colleges 86 (2011): 187–193.
13. Dorsey, E Ray, David Jarjoura, and Gregory W Rutecki. “Influence of Controllable Lifestyle on Recent Trends in Specialty Choice by US Medical Students FREE.” (2003): 1–9.
14. Green, Marianne, Paul Jones, and John X Thomas. “Selection Criteria for Residency: Results of a National Program Directors Survey.” Academic medicine : journal of the Association of American Medical Colleges 84.3 (2009): 362–7.
15. H, D, and J M. “Demand for Ophthalmic Services and Ophthalmologists – A Resource Assessment.” (2008): 2008–2009. Print.
16. Hough, Douglass E., Kai Liu, and David N. Gans. "Size Matters: The Impact of Physician Practice Size on Productivity." Diss. Johns Hopkins University, n.d. Abstract. Medical Group Management Association, n.d. Web.
17. “Implementation and Implications for Ophthalmology” An American Ophthalmological.”
105 (2007): 448–460. Print.
18. Johnson, Bruce A. “Special Report : Trends in Physician Compensation : with Primary Care Stagnation.” January (2003): 39–45. Print.
19. Jolly, Paul et al. “Participation in U.S. Graduate Medical Education by Graduates of
International Medical Schools.” Academic medicine : journal of the Association of American Medical Colleges 86.5 (2011): 559–64. Web. 6 Dec. 2013.
20. Khadem, John, and Marcel Frenkel. “Ophthalmology, 1988.” (2014): n. pag. Print.
21. Leaming DV. Practice styles and preferences of ASCRS members--2003 survey. J Cataract Refract Surg. 2004;30(4):892-900.
22. Lindstrom, Richard L, and Bruce S Maller. “Special Report Market Trends in Refractive Surgery.” 3350.99 (1998): n. pag. Print.
23. MGMA physician compensation and production survey: 1998 report based on 1997 data.
Englewood (CO): Medical Group Management Association; 1998.
24. MGMA physician compensation and production survey: 2002 report based on 2001 data.
Englewood (CO): Medical Group Management Association; 2002.
25. MGMA physician compensation and production survey: 2012 report based on 2012 data.
Englewood (CO): Medical Group Management Association; 2012.
26. Mitchell, Jean M, Jack Hadley, and Darrell J Gaskin. “Spillover Effects of Medicare Fee Reductions: Evidence from Ophthalmology.” International journal of health care finance and economics 2.3 (2002): 171–88.
27. National Residency Matching Program Results and Data. Washington, DC: National Residency Matching Program; 2013
28. National Residency Matching Program Results and Data. Washington, DC: National Residency Matching Program; 2008
29. National Residency Matching Program Results and Data. Washington, DC: National Residency Matching Program; 2003
30. National Residency Matching Program Results and Data. Washington, DC: National Residency Matching Program; 1998
31. National Residency Matching Program Results and Data. Washington, DC: National Residency Matching Program; 1993
32. Newton, Dale A, Martha S Grayson, and Patient Page. “By US Medical School Graduates Grams Annually to Solicit Information.” 290.9 (2003): 1179–1182. Print.
33. "Ophthalmology Residency Match Report- January 2009, Comparative
Statistics." Sfmatch.org. Association of University Professors of Opthalmology, n.d. Web.
Oct. 2013.
34. “Participation in U.S. Graduate Medical Education by Graduates of International Medical Schools.” Academic medicine : journal of the Association of American Medical Colleges 86.5 (2011): 559–64. Web. 6 Dec. 2013.
35. “Practice Styles and Preferences of ASCRS Members—2004 Survey.” Journal of Cataract &
Refractive Surgery 29.7 (2004): 1412–1420. Web. 3 Jan. 2014.
36. Programs, Residency. “Rief Eports.” Table 1 (2004): 1–2. Print.
37. Salary, Future. “Research Letters.” 300.10 (2013): 1131–1132. Print.
38. Salsberg, MPA, Edward, Paul H. Rockey, MPH, Kerri L. Rivers, MS, Sarah E. Brotherton, PhD, and Gregory R. Jackson, BS. "US Residency Training Before and After the 1997 Balanced Budget Act." JAMA 300.10 (2008): 1174-180. JSTOR. Web. 10 Oct. 2013.
39. Schwartz, R W et al. “Career Change: In Quest of a Controllable Lifestyle.” The Journal of surgical research 47.3 (1989): 189–92.
40. Segre, Liz. "Cost of LASIK Eye Surgery and Other Corrective Procedures." LASIK Eye
41. Service-, Human, Medicaid Services, and Veterans Affairs. “Health Policy Brief.” 2009 (2009): 2009–2012. Print.
42. Solomon, Kerry D et al. “Special Report Refractive Surgery Survey 2001.” 3350.01 (2002):
n. pag. Print.
43. Tu, Ha T, and Jessica H May. “Self-Pay Markets in Health Care: Consumer Nirvana or Caveat Emptor?” Health affairs (Project Hope) 26.2 (2007): w217–26. Web. 3 Jan. 2014.
44. We, Listeria. “Choice of Specialty : It ’ s Money.” (2013): 2013. Print.
45. Yousuf SJ, Jones LS. Ophthalmology Residency Match outcomes for 2011. Ophthalmology.
2012;119(3):642-6.