These drug delivery systems using stimuli-responsive biomaterials will allow a more controlled and precise way to deliver these drugs in a biologically active state when the body needs them and stop releasing the drug when it no longer does. necessary.2 biomaterials will degrade more slowly and more. Bioresponsive polymers are specific smart polymers that respond to the stimulus of natural chemicals and molecules found in the body's physiological environment.
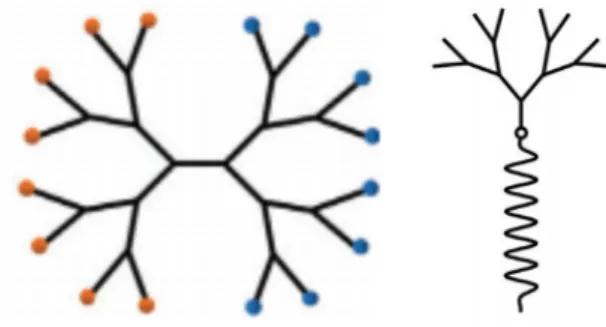
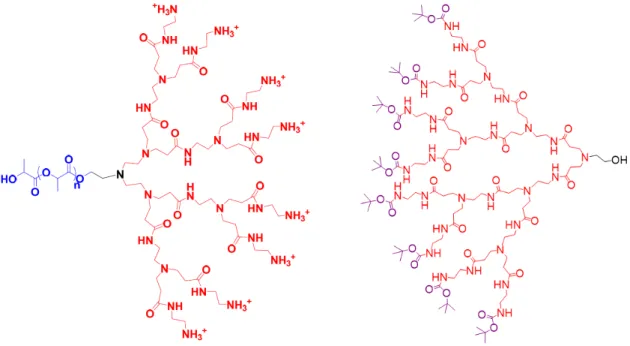
PLA-PAMAM
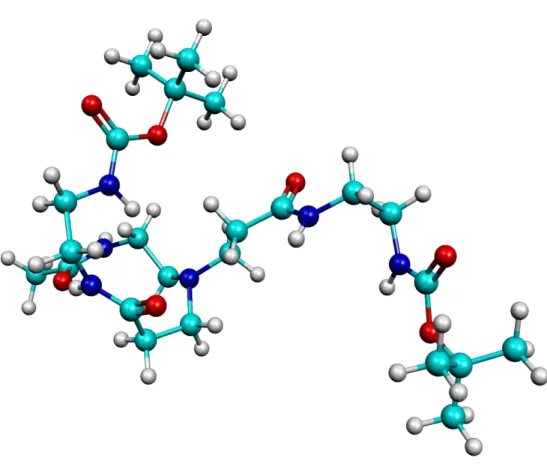
To study the whole PLA-PAMAM structure, a part of the material was studied before the whole LDBC. Watkins in ongoing studies on the polymer biomaterial and how they can expect the biomaterial to perform in the presence of aspects of the body's natural environment.
Spectroscopy
Definition
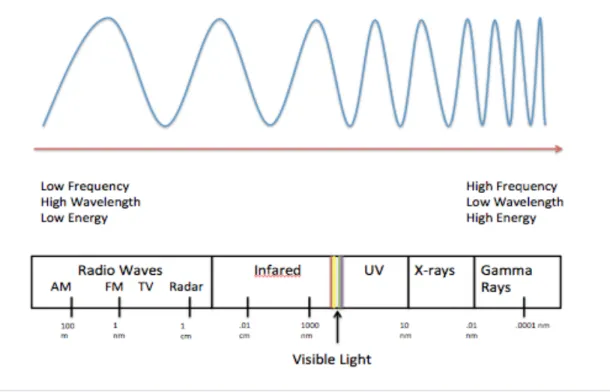
Electromagnetic Radiation
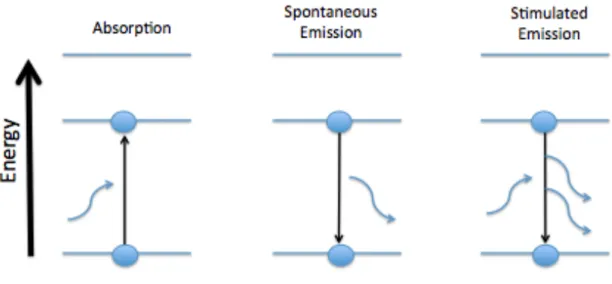
The energy of light is directly proportional to the frequency of the light and indirectly proportional to the wavelength of the light. In absorption spectroscopy, the amount of radiant energy lost by the incident light is the amount of energy required by the photon to promote the molecule from transitioning from one energy level to a higher energy state; the spectrometer measures that change in energy, specifically the loss of energy from the radiation of light.18. Emission is the relaxation of molecules from a higher excited energy state to a lower energy state and can occur spontaneously or stimulated.
Spontaneous emission is the random decay from a higher energy state to a lower energy state over a period of time and the energy released is in the form of a photon emitted in a random direction.19 Stimulated emission occurs when the molecule relaxes to induce a lower energy state by an incoming photon. The photon released in stimulated emission follows the path of the incident light that initially caused the emission, and the light appears brighter.19 This concept is the same concept used in creating a laser. For example, the B coefficients are defined in terms of the transition rates for (induced) absorption Wi12 and induced emission Wi21.20 The following equations are the relative absorption rates, stimulated emission, and spontaneous emission, respectively, where ρ(v) is the energy density per unit angular frequency -interval and N is the number of atoms in the level indicated by the subscript.20.
Einstein used this idea to formulate an equation relating stimulated emission (B21) to spontaneous emission (A21), where h is Planck's constant, c is the speed of light, and v is the frequency of light.21.
Vibrational Spectroscopy
This equation gives the relative ratio between atoms in the excited state and atoms in the ground state.21. In infrared spectroscopy, the absorption and emission of radiation are primarily the result of changes in the vibrational energy of the system through which the radiation passes (absorption) or from which it emerges (emission).22 Not only is radiation absorbed or radiates in vibrational spectroscopy, but also scatters. The total energy of a molecule can be represented as the sum of the contributions of the electronic, vibrational, rotational and translational parts.23 Each area of the electromagnetic spectrum is associated with a change in energy due to transitions between energy levels based on the wavelength of light. .
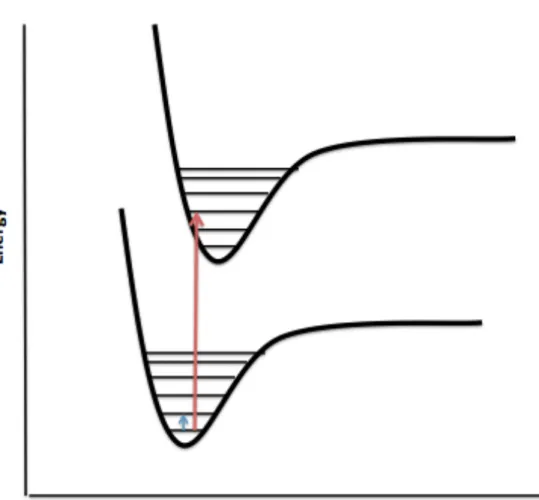
Absorption or emission of quanta in the mid-infrared region of the spectrum and scattering of visible light by vibrating molecules result in vibrational energy changes leading to IR and Raman spectra, respectively.23 Molecular vibrations are explained using the harmonic oscillator and the Schrodinger equation. . creates the vibrational energy levels of a molecule. Selection rules based on the harmonic oscillator approximation indicate which transitions are expected to have zero intensity and which have non-zero intensity.17 Transitions predicted to have zero intensity are said to be forbidden and those predicted to have non-zero intensity. are allowed.17 Vibrational transitions are illustrated in the potential energy diagram in Figure 2.2.2 and these transitions are what the spectrometer detects. The degree of freedom of a molecule is 3N, where N is the number of atoms, and this is based on the three Cartesian coordinates x, y, and z.
The vibrational modes and their interactions with radiation give rise to bands in the Raman spectrum.
Raman Spectroscopy
Instrumental Design
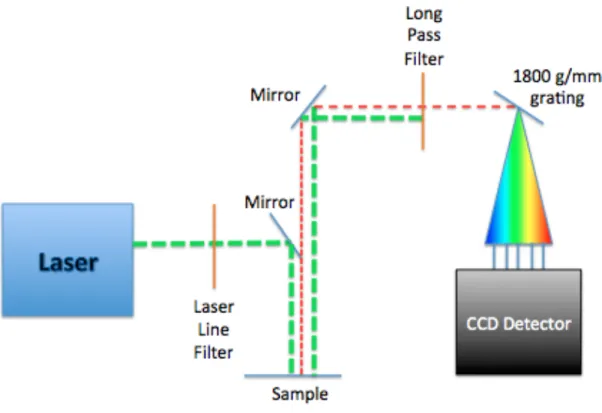
The laser is passed through the laser line filter and reflected by a mirror, projecting the laser onto the sample at a 90 degree angle to the path of the incident light. The laser line filter is a filter that only allows incident light to pass through. The scattered and reflected light is projected back to another mirror that sends the reflected light and scattered light through a long-pass filter.
This filter does not allow light of the same wavelength as the incident light to pass through. This process ensures that the spectrometer is only detecting light that is scattered inelastically. The scattered light is redirected by mirrors into a monochromator, which uses a grating to diffract the beam into a narrow band of wavelengths.24 The band of wavelengths is measured by the CCD.
The charge-coupled device is a silicon-based multichannel array detector of UV, visible and near-infrared light.25 They are able to convert the current created by the photons hitting the silicon surface into an electrical current read by the spectrometer can be.
Raman Spectroscopy Principles
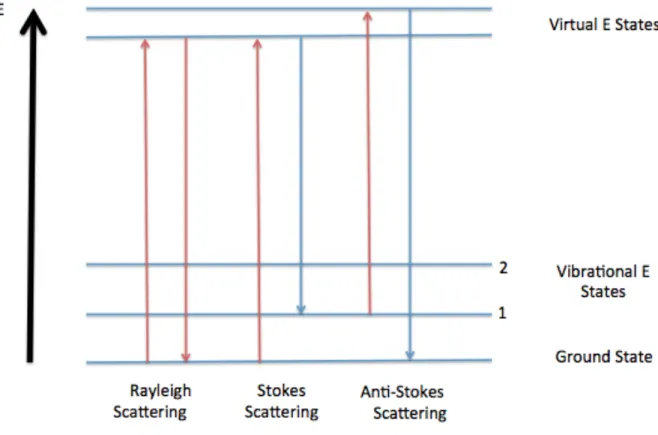
This part is very small; most of the scattered light is elastic and possesses the same energy, frequency, and wavelength as before it hit the sample.18 Elastic scattering is commonly called Rayleigh scattering. Rayleigh scattering occurs when the incident light is unaffected by the sample, and the energy of the photon after interaction with the molecule is the same as the energy of the incident photon. An anti-Stokes scattering line occurs when a molecule in an excited level is raised to a higher, unstable level by interacting with an incident photon and then returns to the ground state upon scattering of a photon.23 As in Stokes scattering as in anti-Stokes scattering, the Raman photon energy is the difference between the energy of the incident photon and the energy absorbed by the molecule.
The photon released after inelastic scattering is commonly referred to as the Raman photon.27 Figure 3.2.1 illustrates elastic scattering and inelastic scattering. The pH of a given solution is a measure of the acidity of the hydrogen ion (aH+) in that solution, as shown in the equation below,29. The Raman shift shown in the spectrum is the difference in energy between the incident photon and the scattered photons.
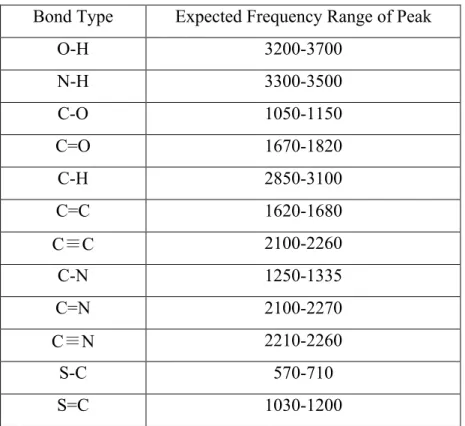
Different functional groups of molecules can be analyzed from a Raman spectrum due to the unique energy changes between the incident photons and the scattered photons from the different vibrational bonds.
Computational Methods
The larger the basis set, the more functions included and the more accurate the molecular orbital representations.
Raman Spectroscopic Analysis of PLA-PAMAM
Experimental Results and Data Analysis
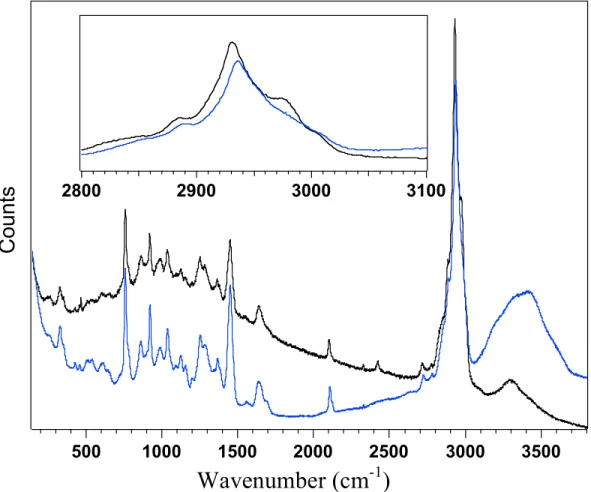
This spectrum is important for the analysis of the PAMAM-boc structure as it interacts with water. Only the analysis of the dendrimer portion of LDBC will aid in the analysis of the entire amphipathic structure, which will be discussed later in this thesis. The spectrum is useful because it allows a closer analysis of the spectrum and any changes that may have occurred can be more easily visualized.
The low energy end of the entire spectrum of Figure 4.1.2 is above and the shifts are minimal to none. The important stretches that occur in this region of the Raman spectrum that are relevant to this thesis are C-C stretches, C-N stretches, and C-O stretches. This region of the spectrum was expected to have no peak shift because hydrophobic C-H bonds should not affect neutral PAMAM-boc.
Movements were expected as the hydrophilic part of LDBC, PAMAM, affected the water droplet.
Theoretical Results and Data Analysis
Using the optimized structure of PAMAM-boc with low energy, the changes were analyzed in figure 4.1.4. After using Gaussian 09 and the optimized PAMAM-boc structure, the bump was found to be less intense. The activity around this frequency is C-H bending and stretching, and the surrounding water molecules forming a network around the PAMAM boc may explain the decrease in intensity.
Figures 4.2.3 and 4.2.4 show the theoretical Raman spectra of the optimized structures of PAMAM-boc in different energy ranges. The middle spectrum is the theoretical yield of the computationally optimized PAMAM boc with higher energy. The upper spectrum is the theoretical yield of the computationally optimized lower energy PAMAM-boc, the optimized structure used in this thesis to compare theoretical results with experimental results.
The two spectra could therefore be viewed under careful comparison and the differences between the three spectra were easier to visualize.
Wavenumber (cm -1 )
Discussion and Conclusions
This thesis investigates the effects of hydrogen bonding by water and pH on PAMAM-boc and PLA-PAMAM. One potential entry for PLA-PAMAM into the body is through the eye, which has a basic pH above 7. Comparison of Raman data of PLA-PAMAM and PAMAM-boc alone, in water, and in a basic pH solution illustrates the structural changes using Raman spectroscopy and computational methods.
The differences in the structure of PLA-PAMAM alone and in water are deduced to be very minimal from the experiment. There was no shift in spectral peaks between PLA-PAMAM and PLA-PAMAM surrounded by a drop of water. This research will provide basic foundational information for further research conducted using PAMAM-boc and PLA-PAMAM.
The study and analysis of this linear dendritic block copolymer is important for the scientific community, and PLA-PAMAM as an effective drug delivery system will be a great achievement in biomedical applications.