ASEAN Marketing Journal ASEAN Marketing Journal
Volume 7 Number 2 Article 1
November 2021
Application of Text Mining to Extract Hotel Attributes and Application of Text Mining to Extract Hotel Attributes and
Construct Perceptual Map of Five Star Hotels from Online Review:
Construct Perceptual Map of Five Star Hotels from Online Review:
Study of Jakarta and Singapore Five-Star Hotels Study of Jakarta and Singapore Five-Star Hotels
Arga Hananto
Department of Management, Faculty of Economics and Business University of Indonesia, [email protected]
Follow this and additional works at: https://scholarhub.ui.ac.id/amj Part of the Marketing Commons
Recommended Citation Recommended Citation
Hananto, Arga (2021) "Application of Text Mining to Extract Hotel Attributes and Construct Perceptual Map of Five Star Hotels from Online Review: Study of Jakarta and Singapore Five-Star Hotels," ASEAN Marketing Journal: Vol. 7 : No. 2 , Article 1.
DOI: 10.21002/amj.v7i2.5262
Available at: https://scholarhub.ui.ac.id/amj/vol7/iss2/1
This Research Article is brought to you for free and open access by UI Scholars Hub. It has been accepted for inclusion in ASEAN Marketing Journal by an authorized editor of UI Scholars Hub.
Application of Text Mining to Extract Hotel Attributes and Construct Perceptual Map of Five Star Hotels from Online Review:
Study of Jakarta and Singapore Five-Star Hotels
Arga Hananto1
The use of post-purchase online consumer review in hotel attributes study was still scarce in the literature. Arguably, post purchase online review data would gain more accurate attributes that consumers actually consider in their purchase decision. This study aims to extract attributes from two samples of five-star hotel reviews (Jakarta and Singapore) with text mining methodology. In addition, this study also aims to describe positioning of five-star hotels in Jakarta and Singapore based on the extracted attributes using Correspondence Analysis. This study finds that reviewers of five star hotels in both cities mentioned similar attributes such as service, staff, club, location, pool and food.
Attributes derived from text mining seem to be viable input to build fairly accurate positioning map of hotels. This study has demonstrated the viability of online review as a source of data for hotel attribute and positioning studies.
Keywords: text mining, correspondence analysis, hotel attribute, Jakarta, Singapore
Penggunaan ulasan konsumen di Internet dalam studi tentang atribut hotel masih relatif jarang ditemukan dalam literatur. Penggunaan data ulasan konsumen di Internet dapat menghasilkan atribut hotel yang lebih akurat menggambarkan atribut yang digunakan konsumen dalam keputusan pembelian mereka. Penelitian ini bertujuan untuk mengekstrak atribut hotel dari dua sampel ulasan hotel bintang lima (di Jakarta dan Singapura) menggunakan metodologi text mining. Selain itu penelitian ini juga bertujuan untuk menggambarkan positioning sejumlah hotel bintang lima di Jakarta dan Singapura menggunakan analisis korespondensi berdasarkan atribut yang diekstrak dari review online. Penelitian ini menemukan bahwa para reviewer hotel dari kedua kota menyebut atribut-atribut yang serupa, misalnya: pelayanan, staf, klub, lokasi, kolam renang dan makanan. Atribut yang diekstrak melalui text mining terbukti dapat menjadi sumber data untuk membuat peta positioning hotel. Penelitian ini telah menunjukkan bahwa ulasan di Internet dapat digunakan sebagai sumber data untuk penelitian tentang atribut hotel dan positioning hotel.
Kata Kunci: text mining, correspondence analysis, atribut hotel, Jakarta, Singapura
1 Department of Management, Faculty of Economics and Business University of Indonesia. Jl. Prof. Sumitro Djojohadikusumo, Depok, West Java 16424, Indonesia. Email: [email protected]
Introduction
In the past few years, online Word of Mouth Communication (WOM) has become very pervasive in marketing. Hospitality industry becomes a good example of online WOM pervasiveness over the Internet. For instance, a traveler can get numerous reviews and tips about hotels and attractions around the world from review sites such as Tripadvisor.com, Booking.com, or Expedia.com. In addition, there are many other types of online information available online, such as social media posts made by individuals.
The significance of social media and other online resources in marketing of hospitality and leisure industry has been documented in the literature. Xiang and Gretzel (2010) suggest that social media had increasingly become an important source of information for travelers as they search for information on line before making their travel purchase decision. Travel reviews are used during travel idea generation stage as well as during final purchase decision.
Most review readers perceived travel reviews help them in learning about travel products and destinations (such as accommodations or transportation), evaluating alternatives, and
avoiding undesirable places (Gretzel & Yoo, 2008). In support of Xiang and Gretzel (2010);
Callarisa, García, Cardiff, and Roshchina (2012) also report that online reviews in social network affected consumer travel decision.
Furthermore, they are considered more credible than other means of marketing communication.
Large amount of travel and accommodation information available onine and widely used by travel consumers provide research opportunity for hospitality industry and academic community. One area where analysis of on- line information is useful is in hotel industry.
According to Zhou, Ye, Pearce, and Wu (2014), online reviews could be used in hotel satisfaction studies to identify and rate aspects (attributes) of hotels that drive consumer satisfaction. Zhou et al. (2014) propose that internet-based hotel review offer efficient and data-rich alternative to survey based methods, which have some potential issues related to data collections such as biases, incomplete data, and expensive data collection process. In fact, the use of online consumer reviews in hospitality and travel research has become common practice in the last few years (see Table 1 for example of hospitality research involving online consumer reviews)
Even though it has full of potential to become rich source of research data, analysis of online WOM, such as travel reviews, can be challenging due to enormous quantity of unstructured consumer information. To deal with this, text mining technique can be used , as it is able to process large amount of data effectively to provide insights from text based e-WOM communication (Tang & Guo, 2013). Tang and Guo (2013) suggest that Information Extraction, a function in text mining could be used to identify important market terms and themes such as brand names and product features from online forums and social media. Netzer, Feldman, Goldenberg, and Fresko (2012) mentioned several past studies that applied text mining on product reviews, for instance to estimate consumer preferences, to reveal market structures and to predict firms’
stock performances..
Thus, the aim of this research is twofold.
First, to explore the viability of online hotel review as source of valid data regarding hotel attributes whereby the author would examine reviews of five star hotel reviews in two different locations from a travel review website
and then identify hotel attributes from the reviews using text mining methodology. Since this study is exploratory in nature, the author would compare the results with hotel attributes identified in past studies. In this regards, evaluation regarding similarity or differences between this study and past studies (that applied survey/ in-depth interview) can be made to prove the validity of attributes gained from text mining application. Second, the author would like to explore the viability of using attributes generated from text mining hotel reviews to construct positioning map of hotels from both cities via correspondence analysis. The author argues that positioning map generated through input from text mining of reviews can accurately reflect consumer perception, thus providing hotels with insights regarding their position relative to competitors.
Literature review
On-line word of mouth communication and hotel marketing
Online Word of Mouth Communication (WOM) has been reported to aid in consumer decision making and used by consumers as means to manage risk (O’Connor, 2010). Godes and Mayzlin (2004) report that WOM is often a prominent driver of consumer behavior such as decision to adopt a new technology, or decision to watch a new TV show. Gruen, Osmonbekov and Czaplewski (2006) propose that WOM have significant impact on consumer choice and post purchase product perceptions, as well as more effective than traditional marketing tools.
The Role of user generated contents and social networks in marketing have been documented. Decker and Trusov (2010) report that user generated contents such as consumer reviews can strongly influence decision making of potential buyers who search for information online prior to purchase. Similarly, Callarisa et al. (2012) report that online reviews in social network can affect consumer travel decision as well as considered to be more credible than other means of marketing communication.
Hotel and tourism sectors are also influenced by user generated contents. Social media is increasingly becoming important source of information for travelers as they search for information online before making their travel
Table 1. A Sample of Past Hospitality and Travel Research Utilizing Consumer Reviews
Author(s) Year Context Method
Xiang, Schwartz,
Gerdes, and Uysal 2015 Used 60,648 customer reviews of 10,537 hotels in 100 largest US Cities to reveal several dimensions of hotel guest experience. In addition, the authors tested the association between the dimensions of guest experience and satisfaction.
Data downloaded using web crawler and processed using text mining method. Subsequently, data were factor analyzed and the results used as input for ANOVA to test association between the dimensions and guest satisfaction Li, Law, Vu, Rong,
and Zhao 2015 Used 118,300 records from online reviews of 1740 hotels located in Hong Kong, Singapore, Shanghai, Bangkok and Sydney, the authors identified emergent hotel features
Text mining and specifically applied Emergent Pattern Mining to identify emerging patterns from the reviews.
Zhou, Ye, Pearce,
and Wu 2014 Used over 1000 user generated review of 4 and 5 star hotels in Hangzhou, China from Agoda.com website to identify 17 attributes influencing customer satisfaction, classified based on types of influence exerted.
Content analysis using two researchers to sample the comments and coded the review content into six broad themed categories
Xie, Zhang, and
Zhang 2014 Used consumer review data, management responses and hotel information from 843 hotels in five major hotel markets in Texas, USA downloaded from Tripadvisor.com
Using volume of review, valence of overall review, valence of individual attribute rating items, and review variation from
consumer review as input for linear regression analysis
Li, Ye, and Law 2014 Revealed attributes that determine customer satisfaction from 774 star rated hotel in China
Automated Text mining and Hierarchical Clustering Ye, Law, Gu and
Chen 2011 Used hotel bookings and review information of 1639 hotels in 10 randomly selected cities in China from Ctrip.com website to identify impact of online WOM on sales in the tourism and hotel industries. Valence and variance of online consumer generated review and number of online bookings were used as variables
Review and hotel booking data downloaded with web crawler were processed and then analyzed using Log-Linear Regression Model
O’Connor 2010 Used sample of 100 randomly selected hotels (from which five most current reviews were examined) in London from Tripadvisor.com website to identify factors that cause reviewer satisfaction and dissatisfaction
Content analysis supported by NVIVO7 software with two coders identifying the themes and coded the reviews into the themes
Ye, Zhang, and Law 2009 Used corpus of 591 negative reviews and 600 positive reviews of seven most popular US and Europe travel destinations downloaded from Yahoo.
com’s travel column, the authors compared three methods of sentiment analysis.
Sentiment analysis
purchase decision (Gretzel & Yoo, 2008; Xiang
& Gretzel, 2010). According to Gretzel and Yoo (2008), travel reviews are used during travel idea generation stage as well as during final purchase decision, moreover, most review readers perceive travel reviews help them to learn about travel products and destinations (e.g. accommodations), to evaluate alternatives, and to avoid undesirable places. Online travel review is also perceived as a way to reduce risk (Gretzel & Yoo, 2008) and to increase efficiency of travel planning (Hwang, Jani, & Jeong, 2013). Travelers tend to consider consumer reviews important for accommodations decision making, and in some cases, reviews by other travelers can change a person’s hotel preference (Gretzel & Yoo, 2008).
Due to the prevalence of online information search behavior amongst tourists, analysis of online consumer reviews is essential for hotels.
Callarisa et.al (2012) suggest that virtual environment (such as travel review sites) can be used to help hotel management to improve existing products, to create new products and to generate new business and differentiate in the market. By analyzing consumer reviews, hotel management can be informed of areas valued by their customers, and subsequently they can fine tune their hotel’s offerings to deliver exactly what customer wants.
In the past few years, there have been a number of hospitality and travel studies using online consumer reviews as their source of data, and some of them applied text mining methodology.
The studies are summarized in Table 1.
Online review can be used as alternative source of information to study hotel attributes and positioning. Past research has used this approach. For example, studies by Li, Law, Vu, Rong, and Zhao (2015); Li, Ye, and Law (2014);
Xiang and Gretzel (2010); Xiang, Schwartz, Gerdes, and Uysal (2015); Zhou et al. (2014);
Xie, Zhang, and Zhang (2014) extracted hotel attributes from reviews .
In hospitality industry, it is crucial to identify the correct set of attributes that consumers regard as relevant factor in their purchase decision making since product attributes play pivotal role in developing customers’ positive affective evaluation toward the product. For instance, Han (2013), reports that distinguishable attributes of a restaurant can help customers assign value to the product.
Furthermore, the attributes can influence customers to develop favorable affective evaluation and post-purchase intentions. Past research in hotel industry finds that hotel attributes influence hotel room rate (Zhang, Ye,
& Law, 2011), traveler’s hotel selection (Jones
& Chen, 2011) and guest satisfaction (Ogle, 2009). Understanding hotel attributes would in turn help hotel managers to develop and position their hotels in the market in accordance to attributes that matter for consumers.
The author argues that online review can be good source of attributes data. Hotel reviews are normally based on actual visit experience. Zhou et al., (2014) suggest to use online review as data source since it allows consumers freedom to report anything they deem relevant to their experience. This argument is also in line with consumer decision making process. For instance, Jones and Chen (2011) propose that customers use different attributes at different stages of the choice process, and accordingly, focusing on attributes used to evaluate purchase decision (after purchase/use experience) would likely yield more accurate and realistic picture of the attributes that affect the actual decision making. Thus, following Jones and Chen’s (2011) reasoning, the attributes extracted from online review would accurately reflect attributes relevant in hotel customer’s purchase decision.
The use of attributes mentioned in reviews can also fill some gaps in hotel attributes research.
Dolnicar and Otter (2003) report that most hotel attributes studies were focused on the “before purchase” attributes, and that future studies need to focus on attributes “during” and “after stay”. As for attributes from reviews, itcan be considered as attributes “after stay” since reviews are normally written after actual hotel stay.
Hotel attributes research
Research effort to study hotel attributes seemed to be very extensive during decades between 1980s and early 2000s. Dolnicar and Otter (2003) reviewed 21 studies published between 1984 and 2000 in hospitality, tourism research and business journals. They extracted 173 attributes categorized into nine categories (Image, Price/Value, Hotel, Services, Room, Marketing, Food and Beverages, Security, Location), and then identified 23 attributes (out of the initial 173 attributes) that were
used most frequently in past studies. Another study was conducted by Ogle (2009) who used email-based qualitative questionnaire sent to 29 General Managers of deluxe hotels in Asia Pacific area, asking a series of question, one of which was about General Managers’ perception of primary criteria used by business guests to evaluate the guests’ stay. Jones and Chen (2011) conducted an experiment involving 53 subjects which simulated a real search and selection of hotels in Las Vegas area for a given travel date for four nights, for a number of travelers, with a given amount of travel budget.
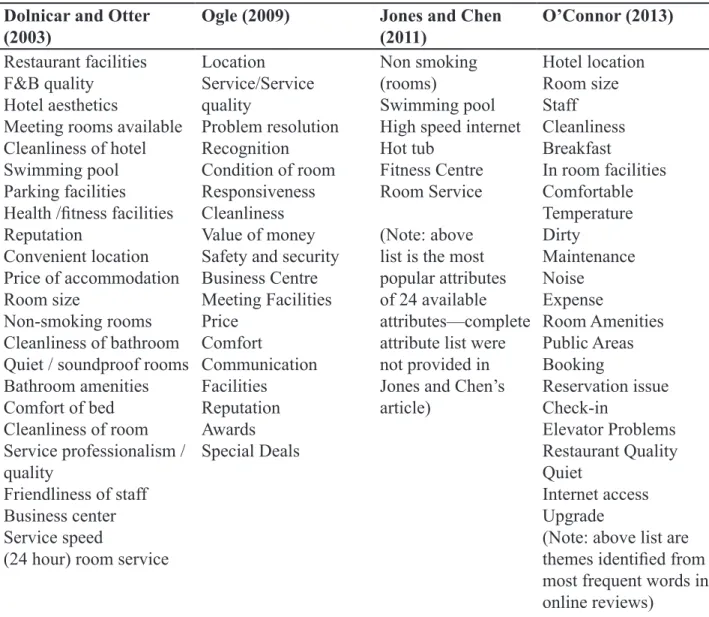
More recent study about hotel attributes focused on online review. O’ Connor (2013) employed content analysis on five most recent comments in TA website about 100 hotels in London. He identified important issues/
attributes that serve as most common causes of satisfaction and dissatisfaction among reviewers
Table 2. Hotel Attributes Identified from Past Research Dolnicar and Otter
(2003) Ogle (2009) Jones and Chen
(2011) O’Connor (2013)
Restaurant facilities F&B quality
Hotel aesthetics
Meeting rooms available Cleanliness of hotel Swimming pool Parking facilities Health /fitness facilities Reputation
Convenient location Price of accommodation Room size
Non-smoking rooms Cleanliness of bathroom Quiet / soundproof rooms Bathroom amenities Comfort of bed Cleanliness of room Service professionalism / quality
Friendliness of staff Business center Service speed
(24 hour) room service
Location
Service/Service quality
Problem resolution Recognition Condition of room Responsiveness Cleanliness Value of money Safety and security Business Centre Meeting Facilities Price
Comfort
Communication Facilities Reputation Awards Special Deals
Non smoking (rooms)
Swimming pool High speed internet Hot tub
Fitness Centre Room Service (Note: above list is the most popular attributes of 24 available attributes—complete attribute list were not provided in Jones and Chen’s article)
Hotel location Room size Staff Cleanliness Breakfast
In room facilities Comfortable Temperature Dirty
Maintenance Noise
Expense
Room Amenities Public Areas Booking
Reservation issue Check-in
Elevator Problems Restaurant Quality Quiet
Internet access Upgrade
(Note: above list are themes identified from most frequent words in online reviews)
based on most frequent words in the review. The attributes identified in the four aforementioned studies are displayed in Table 2.
Understanding which hotel attributes that matter for customers is important for hotel management so they can make optimal hotel development decision (Dolnicar & Otter, 2003).
Hotel attributes is important part of hotel selection criteria. Hotel attributes are important factors that might influence hotel room rate (Zhang, Ye, & Law, 2011), hotel selection (Jones & Chen, 2011) and guest satisfaction (Ogle 2009). Studies have found relationship between customer satisfaction and service quality, which include staff services quality and facilities (Choi & Chu, 2000). Past research about satisfaction and service quality suggest that hotel consumers form satisfaction evaluation based on their evaluation of attributes associated with the hotel (e.g. whether
consumer’s expectation of a certain attribute is fulfilled or not); and these attributes may be key factor that affect consumer’s decision for future repurchase (Choi & Chu, 2000).
Dolnicar and Otter (2003) classify hotel attributes research into three streams: (1) research focused on relevant hotel attributes prior to booking, (2) research focused on relevant attributes during the stay at hotel, and (3) research focused on relevant attributes after the hotel experience. In their review, Dolnicar and Otter (2003) report that a majority of past studies were focused on the first two streams, while the third stream is still lacking in number.
Amongst the studies focused on after visit experience (carried out by means of survey), it is found that staff/service qualities (e.g. related to staff friendliness, helpfulness, responsiveness), room quality (cleanliness, temperature control, quietness), value (e.g. room and food/beverages value for money, convenient location, brand), business facilities/services (e.g. meeting rooms, secretarial services), general amenities (e.g.
room service, laundry, etc), and security were amongst the top attributes (Choi & Chu, 2000;
Chu & Choi, 2000).
Methods
Scope of study
This study focuses on top ten five-star hotels in Jakarta, complemented with top five five- star hotels in Singapore (based on rankings in TripAdvisor website). The author is interested to limit the scope of study to a sample of five- star hotels located in Jakarta and complemented with a sample of hotels from Singapore to check external validity. The author intends to focus on five star hotels in Jakarta (as main sample) and Singapore (as additional sample to check external validity) because study that focuses on this type of hotel in the aforementioned cities in South East Asia is relatively scarce. The author argues that study on hotel attributes focused on five-star segment of hotel industry would be important as five-star hotels mostly cater the high-end corporate market and the wealthy tourism market (since these markets are most likely the only markets that can afford premium rate offered in five-star hotels). This market, although relatively small, represents lucrative market. In this kind of market, the way hotel
attributes are designed and executed may be much more critical to satisfy the consumers.
Jakarta and Singapore were selected as the focus of study since both are business cities as well as the center of each respective country’s government. In addition, both cities also offer some tourist attractions or serve as gateway to other tourism destinations, thus having potential to attract business travelers as well as leisure travelers. According to Statistics Indonesia, in 2014 Jakarta was visited by 2.3 million foreigners that came mostly from Malaysia, China, Japan, South Korea and USA (Pariwisata DKI Jakarta, 2015a). Meanwhile, during the same period, Singapore was visited by 15 million foreign visitors that mostly came from Asia, Americas and Europe (Singapore Tourism Board, 2015a, 2015b).
Research on five-star hotels in Jakarta is also warranted because five-star hotels tend to be more preferred by foreign visitors to Indonesia.
According to Statistics Indonesia (Pariwisata DKI Jakarta, 2015b), five-star hotels in Jakarta experience occupancy rate that varies between 50 and 60 percent during period of June and July each year, with ratio of foreign to domestic guests around 0.82 (approximately 8 foreign guests per 10 domestic guests), which is significantly higher incidence that that occurred in other classes of hotel (which varies between 0.02 in one-star hotel to 0.35 in four-star hotel). This indicates that five-star hotel is more preferred by foreign guests. Thus understanding which attributes are considered salient is imperative for five star hotels in Jakarta to attract its clientele, which consist of foreign visitors as well as wealthy Indonesia travelers.
Data collection and analysis methods
This study applies text mining method to analyze user-generated review from online review website. Netzer, Feldman, Goldenberg, and Fresko (2012) suggest that “text mining refers to the process of extracting useful, meaningful, and nontrivial information from unstructured text”. Text mining, which originated in computer science literature, has been used in marketing applications, for instance to study consumer preferences from product reviews, estimate demand for hotels and understanding market structure based on product attributes mentioned in reviews (Netzer et al., 2012).
Text mining process can be summed into of two phases, namely (1) Preprocessing and integration of unstructured data, and (2) Statistical analysis of the preprocessed data to extract content from the text (Francis & Flynn, 2010).
This study consists of several phases, namely data collection, preprocessing, content extraction and data analysis (attribute extraction and position map construction). The first phase involved getting the raw text data from the review website. In this study, the author focused on top ten five-star hotels in Jakarta according to TripAdvisor (TA) website as of June 2013.
Random samples were taken from each of the ten five-star hotels with help of Research Randomizer (Urbaniak & Plous, 2013), an online random number generator software. The number of sample size taken from each hotel varies according to its population (i.e. number of total reviews in a particular hotel). Sample size was calculated using online sample size calculator published by Australia National Statistical Service (“Sample size calculator,”
n.d.). The sample size was taken by considering confidence level and standard error desired.
In this study, the author used 95% confidence level and desired standard error of 0.05. Table 3 describes the five-star hotels (using their initials) and number of reviews sampled from the review website. In total, 662 reviews were included in Jakarta sample and 500 reviews in Singapore sample.
In order to establish external validity, (i.e., to demonstrate that text mining works in other location/data), second sample is needed. Thus, the author gathered sample of 500 reviews from
top five hotels in Singapore, which would be analyzed in a similar manner as the Jakarta sample. However, due to time constraint, the author had to resort to convenience sampling of the reviews whereby 100 most recent reviews (at the time of data collection) from each of the top five hotels (according to TA during the time of data collection) were taken. The author decided to use arbitrary figure of 100 reviews per hotel after comparing with the sample size figures generated by online sample size calculator published by Australia National Statistical Service. Using the same criteria as used in Jakarta sample (confidence level of 95% and standard error of 0.05), on average the sample size calculator prescribed sample size under 100 reviews per hotel. Thus, the author rounded the sample size upwards to 100 reviews per hotel. Selection of Singapore for comparison is due to a relative similarity between Jakarta and Singapore in terms of both being business cities located in South East Asia. The relatively close distance between Singapore and Jakarta also affects travel behavior of visitors, particularly those on business trips. Some travelers would tend to visit Jakarta and Singapore on the same business trip and the author argue that this might bring more similarity of perceived attributes between five star hotels located in both cities. The result from both samples would be compared to see whether common attributes can be found from both samples.
Reviews selected were limited only to reviews in English. Each review was put into separate text files and given unique identification code that allows identifying the hotel to which Table 3. List of Hotels and Sample Size (Jakarta sample and Singapore sample)
Jakarta Sample Singapore Sample
No Hotel Names Sample size No Hotel Names Sample size
12 34 56 78 910
MOD FSML RCPPSL RCMKKRT GHJWM
7457 7387 4678 6640 7368
12 34 5
RFLRCM SLFS PP
100100 100100 100
Total 662 500
the review belongs. Since the author focused on finding attributes (which is usually in form of unigrams belonging to noun word class), the reviews would be analyzed at word level.
Thus syntactic problems that may occur due to imperfect grammar or mixing English with non- English terms (e.g. in case of Singlish) would not be a problem. Any words not recognized as English word (or misspelled) were put aside from the analysis. In principle, text mining methodology could be carried out for texts written in non-English language. For instance, Chiu, Chiu, Sung, and Hsieh (2013) conducted opinion mining of hotel consumer-generated contents in Chinese Weblogs. Nevertheless, not all text mining software have the capability to directly handle non English texts.
One of the challenges in text mining is to handle word stemming (eliminating morphological endings and inflections from words (Feinerer, 2008). Some software such as GATE (General Architecture for Text Engineering), and KH Coder are reported to be able to handle texts written in non English languages such as Spanish, Chinese, Arabic, and Japanese (“Top 20 Free Software for Text Analysis, Text Mining, Text Analytics,” n.d.).
In R software (R Core Team, 2013) tm package (Feinerer & Hornik, 2013), by default handles English using Porter’s stemmer algorithm. But according to Feinerer (2008), other languages such as German or Russian can also be used with some modifications in the software and package’s syntax and settings, which may be cumbersome for R users with less experience and technical inclination.
After collecting the reviews, the next step was preprocessing the texts. The author followed guidelines from Zhao (2012) which included the following steps: building corpus from the collected text, removing undesirable characters (e.g. whitespace, punctuations, stop- words, numbers, etc) , changing all words into lowercase format and building term-document matrix. Preprocessing and subsequent process of data analysis was carried out using “tm: Text Mining Package” (Feinerer & Hornik, 2013) in R statistical software version 3.01 (R Core Team, 2013)
The content extraction phase was conducted on the aggregate data. In this study, the author analyzed data using count-based evaluation, which identifies terms with highest frequency
of occurrence. According to Feinerer (2008), words with highest occurrence frequencies in a text are deemed important. This kind of analysis, although simple, is commonly used in text mining and has advantage of being easy to interpret and computationally inexpensive (Feinerer, 2008).
The reviews from both sample sets were processed separately using tm package (Feinerer
& Hornik, 2013) in R statistical software (R Core Team, 2013). After preprocessing (changing all words to lower case, removing white spaces, removing punctuation, numbers and stop-words), separate Term-Document Matrix (TDM) for each sample was constructed.
The TDMs for both samples were calculated using TF-IDF (term frequency-inverse document frequency). TF-IDF is a means of normalizing term frequency data by taking into account the number of documents in which the term appears. TF-IDF is a popular weighting scheme used in text mining since it reduces the impact of irrelevant terms and highlights discriminative terms (Feinerer, 2008). Since each review has different length, a lengthy review would probably contain more of a certain term than a shorter review, consequently if a certain term got high raw frequency, there was a possibility that the high frequency came from a few lengthy reviews that repeatedly mentioned the term, not from many reviews.
Therefore the author suggest that calculating frequency of occurrence using TF-IDF may be more appropriate as it would adjust the term frequency by taking into account the document length.
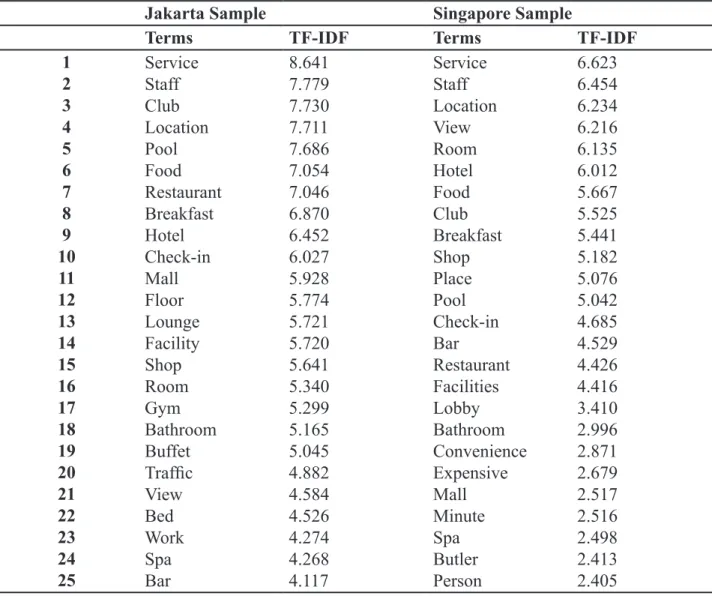
Data processing resulted in a list of terms.
Word Cloud in Figure 1 and Figure 2 display the terms found in review data for Jakarta and Singapore samples respectively. Please note that the words contained in Figure 1 and Figure 2 are stemmed words. In text mining, stemming is the process of removing word suffixes to retrieve their radicals; for words in English, stemming removes common morphological and inflectional endings (Feinerer, 2008).
Stemming is used so that words having different morphological and inflectional endings that belong to the same root are not counted as different words.
The terms contained in Word Cloud still needs to be further filtered to highlight hotel attributes. Judging from their part of speech,
attributes highlighted in past literature seems to be comprised of nouns. Thus, the next step involve identifying the part of speech that each word on the list of terms from text mining belong and then focus only on nouns, since they are more likely represent hotel attributes.
In order to do this process, the author first conducted stem completion using tm package (Feinerer & Hornik, 2013) in R version 3.01 (R Core Team, 2013), and then input the words into POS (part of speech) tagger provided online by University of Copenhagen’s Center for Sprogteknologi to identify the part of speech, and then using the results to build list of most frequently occurring nouns in each data set. Once the part of speech had been identified, adjectives and other words such as proper nouns are excluded from the analysis, since those terms are less likely represent hotel attribute. The author first classified the terms using POS (part of speech) tagger (“CST’s online tools,” n.d.),which is available online. After the classification, the author deleted terms other than nouns, including proper nouns (nouns that refer to names of specific people, places, organizations, and sometimes things). To make sure accuracy of categorization results, the author then rechecked each words with English dictionary from Merriam-Webster online dictionary (http://www.merriam-webster.com/). Table 4 displays the 25 most frequently mentioned nouns from the review data.
Results and Discussion
The author applied word cloud using packages in R software (R Core Team, 2013) to visualize terms occurring in the reviews (see Figure 1 and Figure 2). Word cloud offers fast and practical method to data mine and synthesize large amount of data to yield key and significant themes (Huynh & Wilson, 2014). Viégas and Wattenberg (2008) suggest that word cloud evolved from tag-cloud, a technique that saw wider use in 2001 by Fortune magazine when they mapped 500 largest corporations in the world in circular masses of text whereby each cloud representing companies in a particular country. Viegas and Wattenberg (2008) adds that subsequently, tag- clouds were used in various social media as a way to display popular tags or topics used by social media users; subsequently, this technique (which is now called “word cloud”) was then found its way to academic articles and books.
In business research, word cloud was also used, for instance in studies related to business intelligence (e.g. Ishikiriyama, Miro, & Gomes, 2015; Moro, Cortez, & Rita, 2015).
From the word cloud in Figure 1 and Figure 2, it could be seen that the reviews contain different kinds of words, such as nouns (e.g.
hotel, room, service) and adjectives (e.g. good, great) with words denoting location (e.g.
Jakarta and Singapore). In word clouds, terms with higher term frequency, appear larger in the Figure 1. World Cloud of Jakarta Hotels
Sample Figure 2. World Cloud of Singapore Hotels
Sample
word cloud. Note however that terms appearing in the word cloud are terms that are still in its stemmed form. To have a clearer sense of the terms appearing in the reviews, the stemmed words were returned back to its original form using tm package’s stem completion procedure.
The results are displayed in Table 4.
As could be seen from Table 4, location, staff, service, restaurant and food are five most frequently mentioned attributes in five- star hotels in Jakarta data set, while service, staff, location, view and room are the five most frequently mentioned attributes in Singapore data set. Apparently, terms mentioned by reviewers of Singapore and Jakarta Five- Star hotels are mostly similar, although with different rank. However, the two sets of sample seem to agree on top two terms, which were service and staff, respectively.
In terms of external validity, it seems that attributes identified in this study concurred with attributes that were reported on past studies
Table 4. List of 25 Most Frequently Mentioned Hotel Attributes in Jakarta and Singapore Samples
Jakarta Sample Singapore Sample
Terms TF-IDF Terms TF-IDF
12 34 56 78 109 1211 1314 1516 1718 1920 2122 2324 25
Service Staff ClubLocation PoolFood Restaurant Breakfast Hotel Check-in MallFloor Lounge Facility ShopRoom GymBathroom Buffet Traffic ViewBed WorkSpa Bar
8.641 7.779 7.730 7.711 7.686 7.054 7.046 6.870 6.452 6.027 5.928 5.774 5.721 5.720 5.641 5.340 5.299 5.165 5.045 4.882 4.584 4.526 4.274 4.268 4.117
Service Staff Location ViewRoom Hotel FoodClub Breakfast ShopPlace PoolCheck-in BarRestaurant Facilities Lobby Bathroom Convenience Expensive MallMinute SpaButler Person
6.623 6.454 6.234 6.216 6.135 6.012 5.667 5.525 5.441 5.182 5.076 5.042 4.685 4.529 4.426 4.416 3.410 2.996 2.871 2.679 2.517 2.516 2.498 2.413 2.405
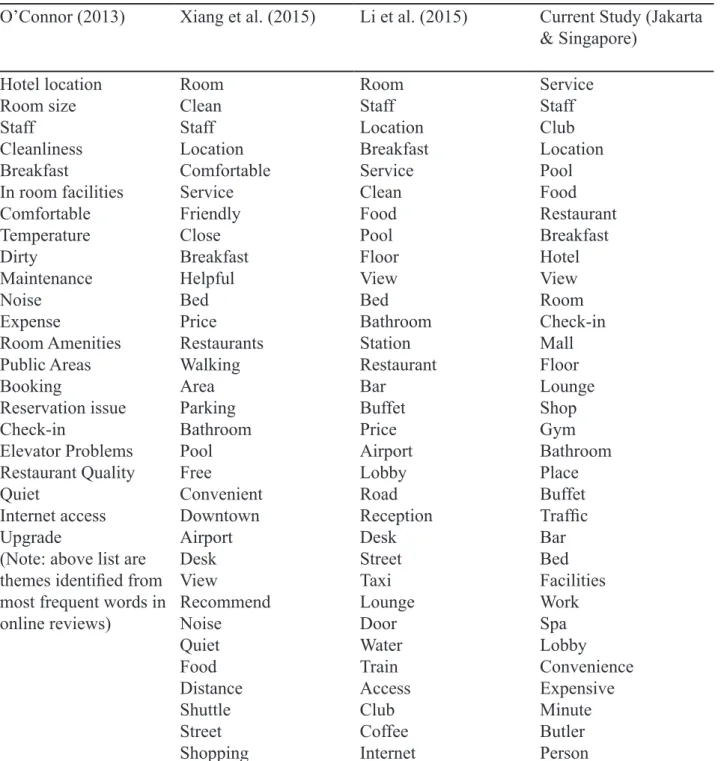
that also used user-generated review (see Table 5). Studies by Li et al. (2015) and Xiang et al.
(2015) reported similar set of attributes such as service, staff, room, location, etc. According to Xiang et al. (2015) , these terms can be classified into several groups, namely: (1) core product (example in this study:. “room”,“bed”, and “bathroom”); (2) hotel amenities (example in this study: “restaurant”, “pool”,etc); (3) hotel attributes (example in this study: “location”,
“convenience”, etc); (4) hotel staff-related descriptors (example in this study: “staff”);
(5) hotel service encounters (example in this study: “check-in”, “shopping”, etc), and ; (6) evaluation of experience (note: example from this study not included in top 25 most frequent words). It apparent from Table 4 that the top 10 terms in this were centered around the first three categories (core product, hotel amenities and attributes) proposed by Xiang et al.(2015).
Study by Xiang et al. (2015) focused on hotels located in US, while Li et al. (2015) focused
Table 5. Comparison of Attributes Found in Hotel Attributes Study Using Consumer Review as Data Source
O’Connor (2013) Xiang et al. (2015) Li et al. (2015) Current Study (Jakarta
& Singapore) Hotel location
Room size Staff Cleanliness Breakfast
In room facilities Comfortable Temperature Dirty
Maintenance Noise
Expense
Room Amenities Public Areas Booking
Reservation issue Check-in
Elevator Problems Restaurant Quality Quiet
Internet access Upgrade
(Note: above list are themes identified from most frequent words in online reviews)
RoomClean Staff Location Comfortable Service Friendly Close Breakfast Helpful BedPrice Restaurants Walking AreaParking Bathroom PoolFree Convenient Downtown Airport DeskView
Recommend Noise Quiet FoodDistance Shuttle Street Shopping
RoomStaff Location Breakfast Service Clean FoodPool Floor ViewBed Bathroom Station Restaurant BarBuffet Price Airport Lobby RoadReception DeskStreet TaxiLounge DoorWater Train Access ClubCoffee Internet
Service Staff ClubLocation PoolFood Restaurant Breakfast Hotel ViewRoom Check-in MallFloor Lounge ShopGym Bathroom Place Buffet Traffic BarBed Facilities WorkSpa Lobby Convenience Expensive Minute Butler Person
Note: Difference in rankings of terms may result from different weighting scheme used in analysis.
Some studies may have used raw term counts, while this study used TF-IDF weighting on hotels in Hong Kong, Shanghai, Bangkok
and Sydney (note: both were not focused on specific hotel class). This fact indicates that hotel consumers in different cities in the world seem to have same salient set of attributes that mark their experience.
Result from studies conducted using user generated reviews in Table 5 could also be compared to studies conducted using survey and other conventional data collection
method shown in Table 2. Despite of some differences in exact terms used in each study, some similarities of terms can be seen.
For example, Dolnicar and Otter (2003) reported convenient location, service quality, friendliness of staffs, and price as some of the important hotel attributes. Similarly, O’Connor (2013) found that room, breakfast, staff, location, bed and shower as some of the most frequently mentioned attributes.
Meanwhile, location and service were also
-0.5 0.0 0.5
-0.6-0.4-0.20.00.20.40.6
CA factor map
Dim 1 (38.08%)
Dim 2 (22.03%)
location shopping
mall
floor
club lounge
price
internet amenities
shower
view room bathroom
bed gym pool
facilities
restaurant bar
breakfast
buffet food
staff service
security check-in
MO FSD
ML
RCPP RCMKSL KRT
GH
JWM
identified in Ogle’s (2009) study. Apparently, location, service, room, staffs, and various hotel facilities such as gym and swimming pools are consistently reported from study to study. It seems that these factors may be critical factors that hotel managers need to pay close attention to, since these factors consistently appear in studies that conducted before purchase, during purchase and after purchase phase as highlighted by Dolnicar and Otter (2003) and Jones and Chen (2011).
Positioning of Five Stars Hotels using Correspondence Analysis
Once the attribute set had been derived from most frequently mentioned terms, the next step was performing correspondence analysis to analyze association between hotels and attributes. Correspondence analysis was conducted using FactoMineR package (Husson, Josse, Le, & Mazet, 2014) in R statistical software version 3.01 ( R Core Team, 2013). Input data for Correspondence Analysis were derived from raw term frequency of each hotel in both Jakarta and Singapore samples (analyses were run separately). The author used terms that were most frequently mentioned and developed contingency table as input data for correspondence analysis in FactoMineR (Husson et al., 2014).
Figure 3. Correspondence Map of Frequent Terms and Five-star Hotels (Jakarta sample)
Figure 4. Initial Correspondence Map of Frequent Terms and Five-star Hotels (Singapore sample)
For Jakarta sample, the raw term frequency was rescaled to account for disproportionate number of reviews for each hotel. This step follows suggestion from Kudlats, Money, and Hair (2014), who propose that rescaling is required since disproportionate number of reviews for each hotel would cause disproportionate mentions of attributes, which in turn might cause correspondence analysis result to be skewed toward hotels with more reviews. However, the same treatment was not carried out for the Singapore sample since there is already same number of reviews for each hotel. After rescaling the frequency of terms, correspondence analysis (CA) was carried out.
Once CA solution was obtained, the author checked the presence of outlier. According to Bendixen (1996), outliers could be found by examining rows and columns that have both high absolute coordinate values (more than +/- 1) and high contributions. There were outliers in both sample (“lobbies” in Jakarta sample and “butler” in Singapore sample). Presence of outlier could dominate the interpretation toward one or more of the axes and cause the remaining row and column points tightly clustered together and difficult to interpret. Thus, outlier terms were removed, and another CA was carried out without the offending terms.
Table 6. Summary of Correspondence Analysis Result Jakarta Sample (overall) Source
Table 7. Summary of Correspondence Analysis Result (Jakarta sample, row points) Dimension Singular
value Inertia Chi-
Square Sig Percent of inertia
Accounted for Cumulative 12
34 56 78 910 Total
0.230.17 0.150.11 0.080.07 0.060.05 0.040.23
0.051 0.029 0.021 0.013 0.006 0.006 0.003 0.002 0.002
00.133 996.35 0.00
38.08 22.03 15.80 9.524.61 4.212.60 1.721.42 0100%
38.08 60.11 75.91 85.44 90.05 94.26 96.86 98.58 100100 100%
Note: Square-root of total inertia: 0.365 with Chi-Sq 996.35 with df = (26-1)*(10-1) =225 yielding p-value <0.001
Attributes Mass Coordinates Inertia Contribution Cos2 Total
Dim 1 Dim 2 Dim 1 Dim 2 Dim 1 Dim 2
Amenities BarBathroom BedBreakfast Buffet Check-In ClubFacilities Floor FoodGym Internet Location Lounge MallPool Price Restaurant RoomSecurity Service Shopping Shower Staff View Active Total
0.017 0.010 0.034 0.023 0.050 0.022 0.009 0.030 0.015 0.023 0.051 0.027 0.017 0.042 0.030 0.032 0.042 0.024 0.051 0.179 0.029 0.098 0.034 0.010 0.084 0.018 1.000
-0.161 0.211 -0.045 0.149 0.177 0.295 -0.189 -0.064 -0.016 0.02-0.055 -0.345 0.142 -0.028 0.419 -0.769 -0.186 0.310.16 0.013 0.440.065 -0.349 0.22-0.045 -0.281
0.134 0.353 0.16-0.065 -0.009 -0.127 -0.123 -0.432 -0.017 -0.072 -0.019 0.102 -0.215 -0.034 -0.486 -0.272 0.093 0.216 0.172 0.061 -0.27 0.015 -0.148 0.345 0.173 0.048
0.002 0.005 0.004 0.003 0.003 0.004 0.001 0.008 0.002 0.002 0.000 0.005 0.004 0.002 0.013 0.023 0.006 0.009 0.005 0.003 0.009 0.001 0.007 0.006 0.004 0.003 0.134
0.848 0.850.133 1.007 3.079 3.799 0.654 0.241 0.007 0.017 0.301 6.425 0.677 0.067 10.231 37.738 2.842 4.513 2.530.059 10.954 0.828.094 0.913 0.337 2.864 100
1.018 4.137 2.977 0.334 0.013 1.206 0.4818.937 0.015 0.396 0.064 0.968 2.707 0.164 23.778 8.139 1.234 3.787 5.081 2.238 7.132 0.071 2.507 3.869 8.605 0.142 100
0.224 0.081 0.018 0.152 0.547 0.527 0.238 0.015 0.002 0.004 0.582 0.628 0.088 0.018 0.392 0.851 0.261 0.264 0.240.011 0.617 0.418 0.603 0.082 0.042 0.574
0.156 0.228 0.239 0.029 0.001 0.097 0.101 0.675 0.002 0.047 0.072 0.055 0.203 0.026 0.527 0.106 0.066 0.128 0.279 0.246 0.232 0.021 0.108 0.201 0.620.016
0.380.309 0.257 0.181 0.548*
0.624*
0.339 0.69*
0.004 0.051 0.654*
0.683*
0.291 0.044 0.919*
0.957*
0.327 0.392 0.519*
0.257 0.849*
0.439 0.711*
0.283 0.662*
0.59*
*Attributes that were well represented on two dimensional map (i.e Total Cos2 > 0.5)
Table 8. Summary of Correspondence Analysis Results (Jakarta sample, column points)
Table 9. Summary of Correspondence Analysis Result Singapore Sample (overall) Hotels Mass Coordinates Inertia Contribution Cos2
Dim 1 Dim 2 Dim 1 Dim 2 Dim 1 Dim 2 Total MOD
FSML RCPPSL RCMKKRT GHJWM
Active Total
0.042 0.044 0.048 0.041 0.056 0.040 0.059 0.100 0.350 0.218 1.000
0.078 0.141 0.034 0.237 -0.159 0.185 0.179 -0.09 -0.249 0.304
0.173 0.226 0.206 0.111 -0.342 -0.03 -0.011 0.352 -0.057 -0.12
0.008 0.008 0.007 0.006 0.016 0.006 0.009 0.020 0.025 0.028 0.134
0.511 1.730.109 4.539 2.779 2.713.728 1.593 42.765 39.535 100
4.332 7.668 6.988 1.726 22.323 0.120.024 42.272 3.898 10.65 100
0.033 0.105 0.009 0.372 0.087 0.214 0.222 0.040.868 0.716
0.164 0.269 0.315 0.082 0.405 0.005 0.001 0.611 0.046 0.112
0.197 0.374 0.324 0.454 0.492 0.219 0.223 0.651*
0.914*
0.828*
*Attributes that were well represented on two dimensional map (i.e Total Cos2 > 0.5)
Dimension Singular
value Inertia Chi- Square Sig Percent of inertia
Accounted for Cumulative 12
34 5Total
0.254 0.149 0.129 0.098 0.000
0.064 0.022 0.017 0.010 0.000
0.113 491.21 0.00
57.07 19.66 14.78 8.500.00 100%
57.07 76.72 91.50 100.00 100.00 100%
Note: Square-root of total inertia: 0.336 with Chi-Sq 491.21 with df = (23-1)*(5-1) = 88, yielding p- value <0.001
CA factor map of Jakarta sample is displayed in Figure 3 with corresponding output tables presented in Table 6 through Table 8, while the CA factor map of Singapore sample is displayed in Figure 4 with corresponding output tables presented in Table 9 through Table 11.`
From Table 6 and Table 9, total square root of inertia for Jakarta and Singapore samples were 0.365 and 0.336 respectively.
Thus, it could be concluded that in Jakarta and Singapore samples, CA results indicate significant association between rows and columns, since square root of inertia exceed 0.2 (Bendixen, 1996). After confirming significant row and column association, the second step is to determine the appropriate number of dimensions. Bendixen (1996)
suggest the appropriate number of dimensions could be determined by examining the percent of inertia accounted for by each dimension, and then compare those ratios with expected ratio that would occur if the data were purely random without significant row-column dependencies (for details see Bendixen, 1996).
Following Bendixen’s suggestion, in Jakarta sample, there are three dimensions that can be analyzed, but the author decided to take the first two dimensions since they account for most variance (both account for 60.11 percent variance). In Singapore sample, dimension 1 and 2 also account for most of the variance (76.72 percent), thus in Singapore sample dimension 1 and 2 will also be selected for analysis.
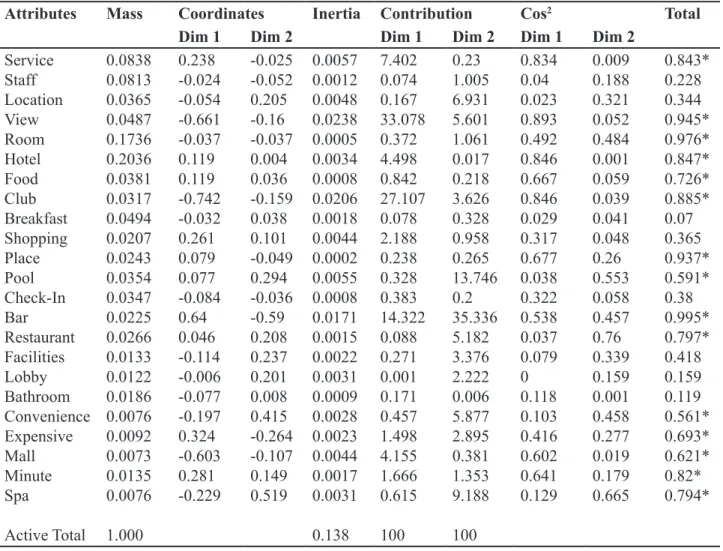
Table 10. Summary of Correspondence Analysis Result (Singapore sample, row points)
Table 11. Summary of Correspondence Analysis Results (Singapore sample, column points) Attributes Mass Coordinates Inertia Contribution Cos2 Total
Dim 1 Dim 2 Dim 1 Dim 2 Dim 1 Dim 2
Service Staff Location ViewRoom Hotel FoodClub Breakfast Shopping Place PoolCheck-In BarRestaurant Facilities Lobby Bathroom Convenience Expensive MallMinute Spa
Active Total
0.0838 0.0813 0.0365 0.0487 0.1736 0.2036 0.0381 0.0317 0.0494 0.0207 0.0243 0.0354 0.0347 0.0225 0.0266 0.0133 0.0122 0.0186 0.0076 0.0092 0.0073 0.0135 0.0076 1.000
0.238 -0.024 -0.054 -0.661 -0.037 0.119 0.119 -0.742 -0.032 0.261 0.079 0.077 -0.084 0.640.046 -0.114 -0.006 -0.077 -0.197 0.324 -0.603 0.281 -0.229
-0.025 -0.052 0.205 -0.16 -0.037 0.004 0.036 -0.159 0.038 0.101 -0.049 0.294 -0.036 -0.59 0.208 0.237 0.201 0.008 0.415 -0.264 -0.107 0.149 0.519
0.0057 0.0012 0.0048 0.0238 0.0005 0.0034 0.0008 0.0206 0.0018 0.0044 0.0002 0.0055 0.0008 0.0171 0.0015 0.0022 0.0031 0.0009 0.0028 0.0023 0.0044 0.0017 0.0031 0.138
7.402 0.074 0.167 33.078 0.372 4.498 0.842 27.107 0.078 2.188 0.238 0.328 0.383 14.322 0.088 0.271 0.001 0.171 0.457 1.498 4.155 1.666 0.615 100
0.231.005 6.931 5.601 1.061 0.017 0.218 3.626 0.328 0.958 0.265 13.746 0.235.336 5.182 3.376 2.222 0.006 5.877 2.895 0.381 1.353 9.188 100
0.834 0.040.023 0.893 0.492 0.846 0.667 0.846 0.029 0.317 0.677 0.038 0.322 0.538 0.037 0.079 00.118 0.103 0.416 0.602 0.641 0.129
0.009 0.188 0.321 0.052 0.484 0.001 0.059 0.039 0.041 0.048 0.260.553 0.058 0.457 0.760.339 0.159 0.001 0.458 0.277 0.019 0.179 0.665
0.843*
0.228 0.344 0.945*
0.976*
0.847*
0.726*
0.885*
0.070.365 0.937*
0.591*
0.380.995*
0.797*
0.418 0.159 0.119 0.561*
0.693*
0.621*
0.82*
0.794*
*Attributes that were well represented on two dimensional map (i.e Total Cos2 > 0.5)
Hotels Mass Coordinates Inertia Contribution Cos2 Total
Dim 1 Dim 2 Dim 1 Dim 2 Dim 1 Dim 2
FSSRCM SHLAPPS RFLS Active Total
FSSRCM SHLAPPS RFLS Active Total
0.168 -0.269 0.068 -0.218 0.412
0.166 -0.061 0.214 -0.072 -0.197
0.018 0.023 0.016 0.018 0.038 0.138
6.913 26.366 1.378 17.434 47.909 100
19.576 3.945 39.268 5.498 31.713 100
0.252 0.737 0.056 0.619 0.808
0.245 0.038 0.551 0.067 0.184
0.497 0.775*
0.607*
0.686*
0.992*
*Attributes that were well represented on two dimensional map (i.e Total Cos2 > 0.5) As can be seen in Figure 3 and Figure 4, the
hotels were mapped near attributes associated with them. The closer a hotel to attributes, the more they are associated. However, the resulting CA output still needed to be refined
to yield more meaningful interpretation. To get meaningful interpretation, there are several steps that needed to be carried out (Kudlats et al.,2014) . First, checking how well the row and column points are well represented
in the two dimensional map using total Cos2 value for row and column points. Second, interpreting the dimensions by examining the row points that contribute significantly to that dimension. This was carried out by inspecting the contribution of each (row or column) element and check if the contribution exceeded the level of contribution that can be expected if there were random distribution of row (or column) elements over the axes (Bendixen, 1996). Third, interpreting the meaning of association between hotels and dimensions. The association was examined based on quality of representation indicators (Cos2 values) for column points (Table 8 and Table 11 for Jakarta and Singapore samples, respectively). If a particular hotel receive higher Cos2 value on a certain Dimension, then the hotel tend to be associated with the Dimension. For instance, in Jakarta sample,
Table 12. Significant Terms on Dimension 1 and Dimension 2 (Jakarta sample)
Table 13. Significant Terms on Dimension 1 and Dimension 2 (Singapore sample) Dimension 1
Terms on the left side Terms on the right side
Mall (37.74%) Shopping (8.1%) Gym (6.43%)
Lounge (10.23%) Security(10.95%) Price (4.51%) Dimension 2
Terms on top half perceptual map Staff (8.6%)
Restaurant (5.08%) Price (3.79%) Bar (4.14%) Shower (3.87%)
Terms on lower half of perceptual map Mall (8.14%)
Lounge (23.78%) Security (7.13%) Club (18.94%)
Dimension 1
Terms on the left side Terms on the right side
View (33.08%)
Club (2.11%) Bar (14.32%)
Service (7.40%) Hotel (4.50%) Dimension 2
Terms on top half perceptual map Pool ((13.75%)
Spa (9.19%) Location (6.93%) Convenience (5.88%)
Terms on lower half of perceptual map Bar (35.34%)
View (5.60%)
MO have Cos2 value of 0.03 for Dimension 1 and 0.16 for Dimension 2, then MO tend to be more associated with Dimension 2. Lastly, interpreting the association of row points and column points graphically. Greenacre (2007) recommended that correspondence map should be interpreted starting from the horizontal axis then move toward vertical axis. Positions of hotels in the map indicate their relationship to each other as well as the association of hotels relative to the significant terms/attributes (cf.
Kudlats et al., 2014).
Table 12 and Table 13 displays summary of significant terms on Dimension 1 and Dimension 2 for Jakarta and Singapore sample respectively, while Figure 5 and 6 display the final correspondence map that depict only significant attributes and hotels. In subsequent paragraphs, these graphs and figures will be analyzed in more detail.