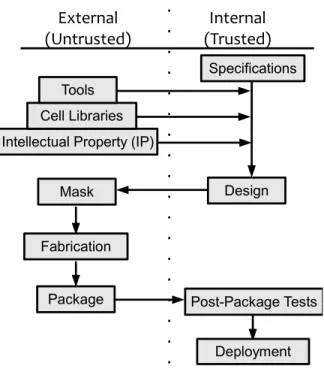
When designing an integrated circuit, there are several opportunities for adversaries to make malicious modifications or insertions into a design. During the design phase, an adversary can hide malicious functionality within a third-party design block, disguising it as an Intellectual Property (IP) watermark.
Research Contributions
Before the design stage, the most malicious input would be limited to deliberate sabotage of the overall design. During the fabrication phase, an attacker at a fabrication facility could have free rein to modify the circuit, and the original designer would likely never know.
Organization of Dissertation
This modified model can then be examined after testing to identify signs of possible Trojan circuitry hidden in the unknown circuitry. This allows chip designers to identify suspect chips in a crowd, even without access to known safe copies of chips, or "golden" chips.
What can we Trust?
In-House
Out-of-House
In the previous example of a pacemaker, there is a high degree of design risk due to the catastrophic effects of their device failure. Commercial-grade chips would almost certainly have trouble operating in the harsh environments required by rocketship computers.
How do we Trust?
- Verification
- The State Explosion Dilemma
- State Machines or Finite State Automata
- Design Verification
Regardless, all of these methods aim to reduce the complexity of the problem of testing every possible input when matching two designs. Another advantage of this type of testing is that it can be performed without a digital or symbolic representation of the circuit.
Background and Risk
One of the most insidious ways to attack a circuit is to maliciously modify its hardware. This feature was then reportedly used to disable Syrian radars for the short duration of the attack.
Insertion
This is especially the case when it comes to the steps involving fabrication due to the sky high cost of modern fabrication facilities. One of these fabrication facilities could easily make changes to the layout prior to fabrication, and the purchasing company would have no way of identifying such a change, other than removing the packaging and subjecting it to expensive and destructive imaging processes.
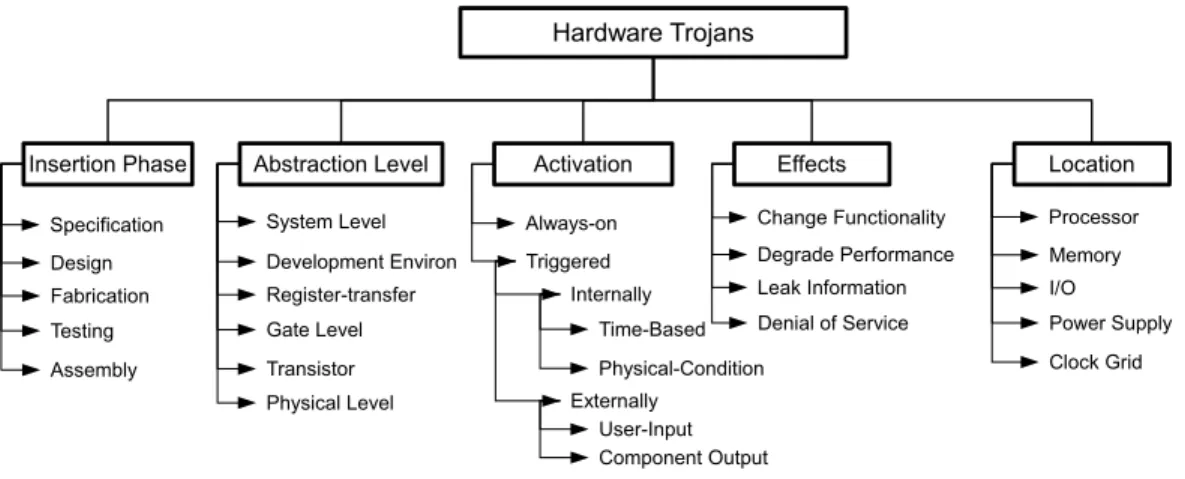
Taxonomy
- Activation Characteristics
- Effect/Payload
- Leak Information
- Degrade Performance
- Changing Functionality
This type of Trojan is difficult to identify due to the lack of switching features; some Trojan detection schemes rely on recognizing trigger behavior as a sign of a Trojan horse [33]. Sometimes this type of trojan can connect to a fuse or something important in a circuit and cause permanent damage.
Specification
Protocols
If a protocol with an inherent security flaw is included in the design, it could introduce a method to subvert the design in the future. If we had implemented a secure protocol in the first place, this would not have happened.
Design
- Third-Party Intellectual Property (IP)
- Electronic Design Automation (EDA) Tools
- Cell Library
- Device and Component Models
- Hardware Description Languages
Another example of an external resource used during the design phase is that of the tools used to create the design. Another external resource commonly relied on during circuit design is that of an external cell library.
Fabrication
- Masking
- Fabrication
- Wafer Probe
- Dice & Package
The first step in the fabrication process is the creation and implementation of the photolithographic masks used to fabricate the integrated circuits. Even if the designer could request and receive a copy of the masks, there is no guarantee that it will match the masks used for manufacture.
![Table 4-1: 2011 Top-10 Semiconductor Foundries [1]](https://thumb-ap.123doks.com/thumbv2/123dok/10731417.0/38.918.277.695.134.372/table-4-1-2011-top-10-semiconductor-foundries.webp)
Testing
Test Equipment
While an organization can provide its own test vectors for a design, it is more difficult to design and supply their own test equipment. On the other hand, designs that require a certain degree of trust require certain steps to be taken to reduce the threat posed by each of these steps.
Specification
For most models, many of these attack vectors can be ignored because they pose only a small risk and because of the difficulty of implementing an attack through such a vector. Furthermore, most of these options represent good design practices, so there is little waste in implementing them.
Design
- Third-Party IP
- Tools
- Cell Libraries and Models
- Hardware Description Languages
However, this technique is limited to pipeline modules and memory units, and only checks for triggered attacks that modify the output functionality of the module in question. Unlike third-party IP, the functions of these cells and models are clearly stated, without hiding any hidden functionality.
Fabrication
- Confounding Factors
- Side-Channel Measurements
- Current/Power analysis
- Timing/Delay Analysis
- Circuit Trust through Hardening
- Circuit Trust through Obfuscation
One of the first studies implementing this type of technique was by Agrawal et al. 50] study, the effective area of the chip during tests reduces the effect of process variations on side channel measurements.
Testing
Although it is not always possible to prevent changes to a design, or even to identify the changes to a design, one option to prevent the inclusion of hardware Trojans is to make it difficult for attackers to identify the function of the design. The main concept behind this method is to only rely on the external fab for the lowest layers of the chips.
Summary
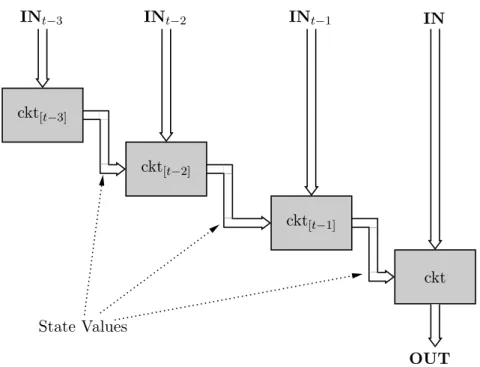
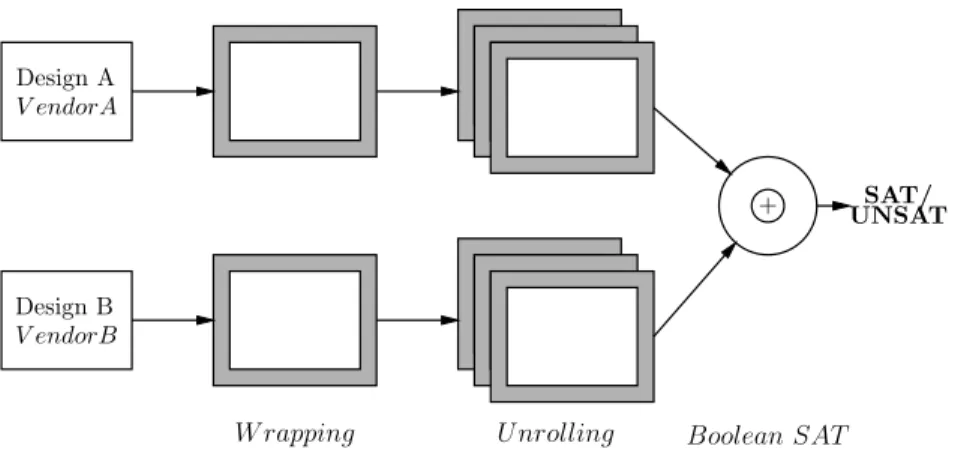
This process is effective despite the fact that neither design is reliable. The two processing steps are to: (1) flip the two designs to match their functionality, and (2) unroll all the internal state components, so that the design can be completely expressed in terms.
Design Comparison
- Wrapping
- Unrolling
- Boolean Satisfiability
- Detection Scope for Design Comparison
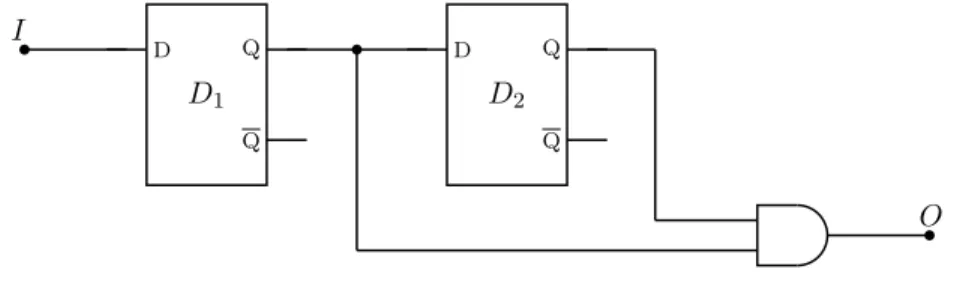
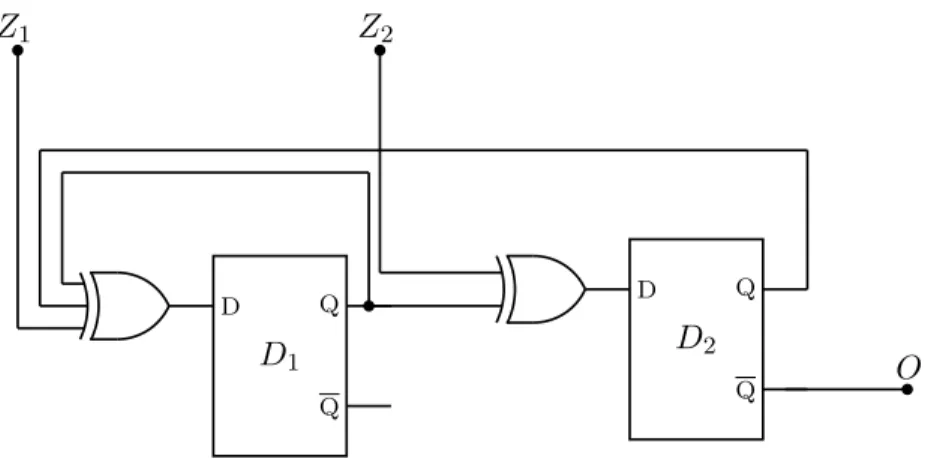
In return, wherever a value is pulled from a state component (ie, the Q gate in a D flip-flop), the value is instead taken from the value of the value stored in the next circuit down the line (ie, gate D in a D flip-flop). If the change is considered to be a false positive, then the wrapper can be modified.
Evaluating Trustworthiness with Design Comparison
False Positives
One of the main limitations of this technique is that it focuses entirely on logic Trojans. However, it is important to carefully investigate such a positive result due to the similarity between such watermarks and Trojans.
False Negatives
Such Trojans will not raise flags using this technique unless it is detected during the unfolding step. This scenario facilitates the detection of the Trojan by techniques focused on identifying suspicious circuits, such as those presented in [73].
Experimental Methodology
Wrapping
The main concern with a false negative is that a Trojan has too long of an implementation time to fit within the window formed by the rollout depth. For this reason, it is wiser and simpler to look for similar designs to test.
Unrolling Tools
If key logic that is ignored by the wrapper is to be called in the final design, then it must be included in the wrapper.
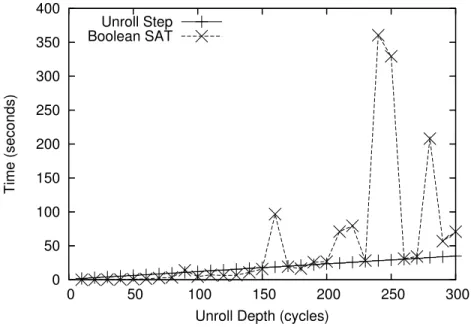
Boolean Satisfiability
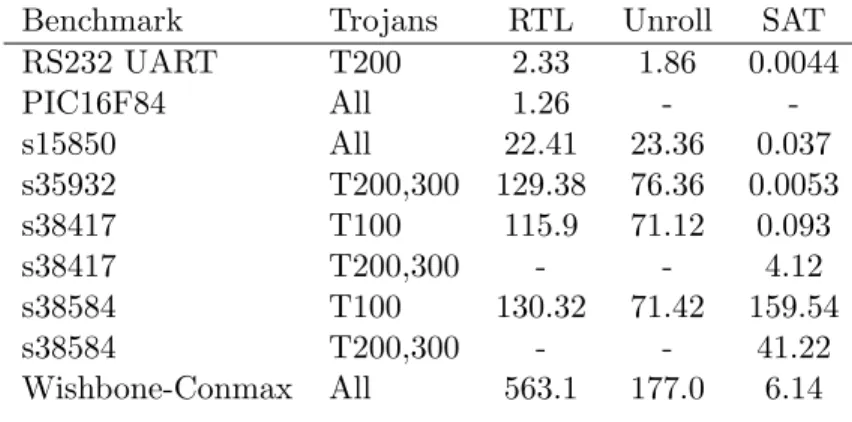
In this case, AIGER services are used to convert the problem expressed in SMV in terms of graphs and inversion, and then converted to the conjunctive normal form (CNF) so that it can be directly fed into the selected SAT solver. namely the rails. Unfortunately, this process must be repeated for each output, so circuits with a significantly large number of outputs take a long time to test if every single output needs to be tested.
Testing and Results
- RS-232 Universal Asynchronous Receiver/Transmitter
- PIC16F84 8-bit Microcontroller
- Wishbone Conmax IP Core
- ISCAS ’89 Benchmarks
- Limitations
For these circuits, the first use of SMEV will cause a segmentation fault and fail simply due to the size of the circuit. This was probably the reason why s38417-T100 and T200 Trojans went undetected, i.e. the deployment depth was limited by the toolkit and could not be expanded much at all.
Summary
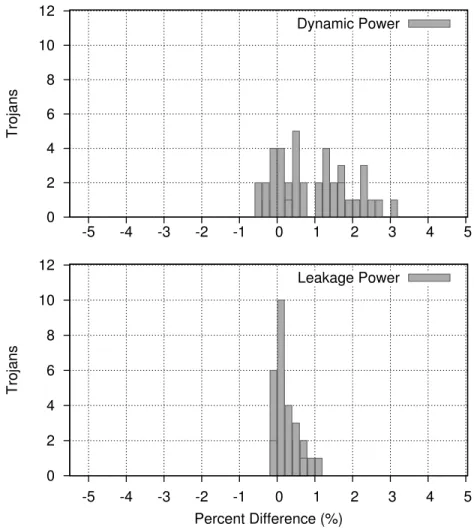
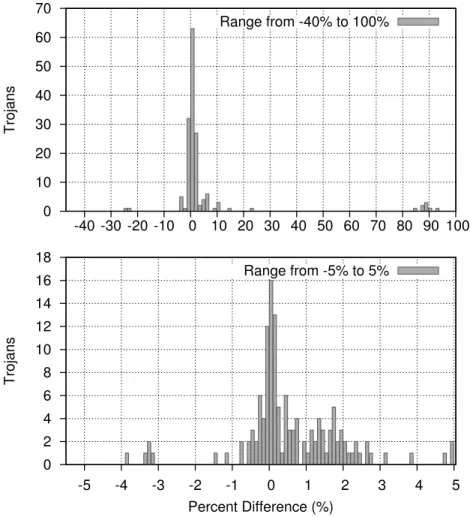
This problem is magnified when examining multiple circuits, where 90% of Trojans had an impact on display area of less than 2.5%, an impact on dynamic power of less than 6%, and an impact on flow power of less than 3.3%. To make matters worse, half of the Trojans tested were ten times smaller, with an average surface area impact of less than 0.18%, an impact on dynamic power consumption of less than 0.7%, and an impact on leakage power less than 0.17 %.
Benchmark Analysis
Benchmark Suite Composition
To identify the impact of Trojan circuits on a host design, we examine more than 60 Trojans in the Trust-Hub repository. Furthermore, some of the Trojans supplied, such as the wide variety of RS232 Trojans, did not have an accompanying Trojan-free version, making it difficult to accurately measure the impact that the Trojan logic had on the original circuit.
Methodology
Impact Within a Design
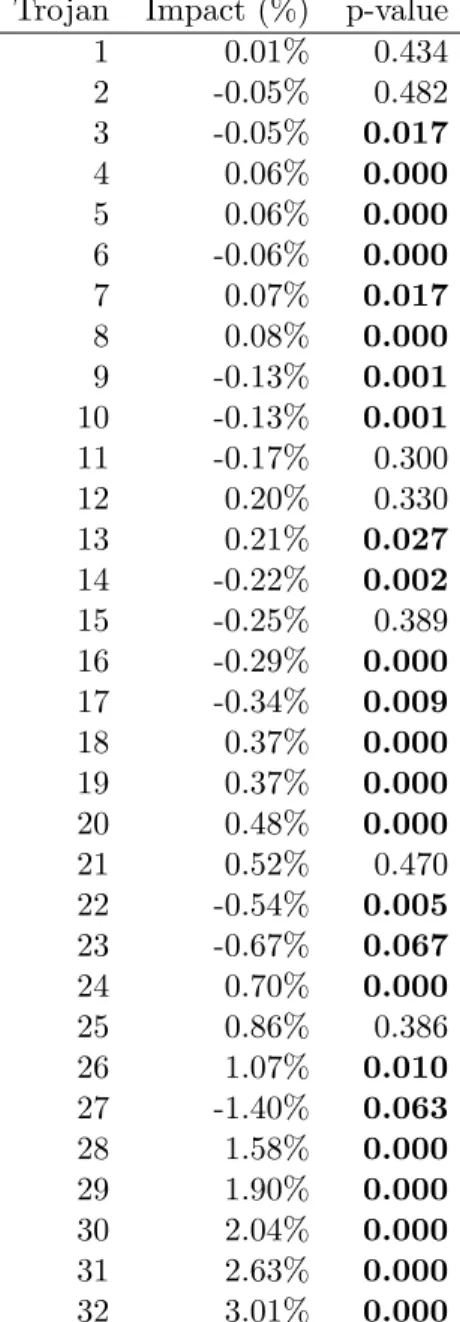
The main difference is that Trojans have a larger overall impact on the circuit's dynamic power consumption, with a mean value of 0.96% and a standard deviation of 0.97%. In fact, 42% of the synthesized Trojan circuits affected the dynamic power consumption of the AES circuit by 0.5% or less.
Impact Across Different Designs
Impact on Area
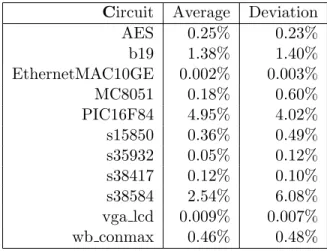
One of the key factors influencing the total Trojan impact on the area was the host circuit being attacked. For some of the tested circuits, such as in the PIC16F84 microcontroller, the impact on area was identified as incredibly large, with an average of 4.95% change in area of the entire circuit.
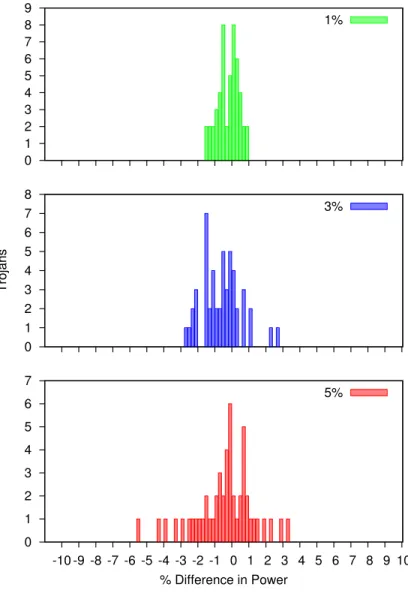
Impact on Power
In all circuits, both the mean difference and the standard deviation of the difference are consistently larger than those observed for the surface impact. The question then becomes to what extent the impact of a Trojan horse depends on the size of the host circuit.
Limitations
Summary
After each test, the parameters of the components within the replacement gold copy are changed based on the input vectors and the corresponding differences observed between the transient responses of the two chips. After this training cycle has run for a large number of tests, the internal parameters of the replacement gold copy represent useful benchmarks for identifying suspicious trends in the untrusted chip.
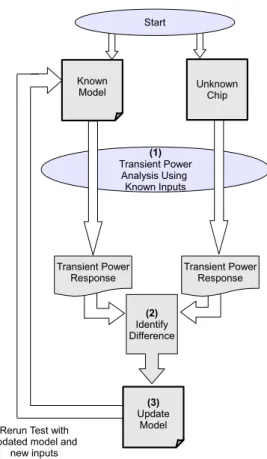
Testing Process
- Process Variation
- Representing a Trojan Circuit
- Training
- Algorithm
Multiply difference by scalarKL for change in gate length Multiply difference by scalarKT for change in threshold voltage. Subtract average change from transistor gate length Add average change to transistor end threshold voltage.
Results
Limitations
Because this test was performed using a digital case study, some confounding variables were not addressed, such as transient power differences caused by chip and wire packaging. This is directly related to (2) the fact that this test was performed using a digital representation of the physical chip instead of the actual physical chip.
Summary
While cyber security and attacks on software designs are rampant and making headlines, the production path of integrated circuits also provides vectors to attack the hardware designs. The aim of this thesis is to reduce this risk and offer developers a safe alternative to relying only on reliable IP providers and reliable manufacturing plants.
Detection in third-party IP
As modern integrated circuits become increasingly complex in both structure and function, the risk of hidden malicious operation cannot be ignored. This risk is compounded with each new iteration of fabrication technology, driving the cost of building modern manufacturing plants ever higher.
Assessment of Trojan impacts on area and power
Identification of Trojans in fabricated chips
Opportunities for Future Work
Katkoori, "A new method for watermarking sequential circuits," in IEEE International Symposium on Hardware-Oriented Security and Trust (HOST pp. Makris, "Hardware trojan detection using path delay fingerprinting," in IEEE International Workshop on Hardware-Oriented Security and Trust (HOST pp.