This internship report has been prepared and submitted by Darmansyah Yudi in partial fulfillment of the requirements for the degree of Bachelor in the Faculty of Engineering, has been reviewed and meets the requirements for a report suitable for examination. Schott Igar Glass, in partial fulfillment of the requirements for the degree of Bachelor in the Faculty of Engineering. Quality is the most important aspect that can achieve customer satisfaction for the product they have consumed or used.
- Background
- Problem Statement
- Objectives
- Scope and Limitation
- Assumption
- Research Outline
SIG, during the production quality labor record many defective product of ampoule itself, and it is becoming a big problem for this company. Related to this research that has several scope and limitations, it is because the short time in doing this research and also the limitation of the resources. This research will discuss about the quality of the ampoule and also the identification of defects causing it.
History of the Company
Vision and Mission
- Vision
- Mission
- Objectives
Organizational Chart
Core Organization Activities
Product & Service
Review on the organization growth and trend
Pareto Chart and Analysis
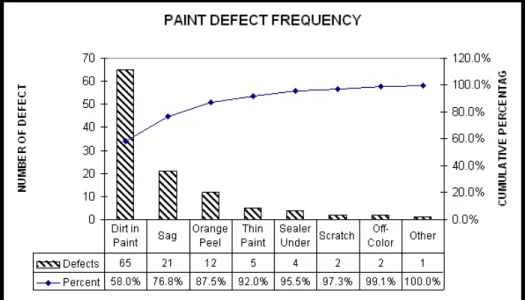
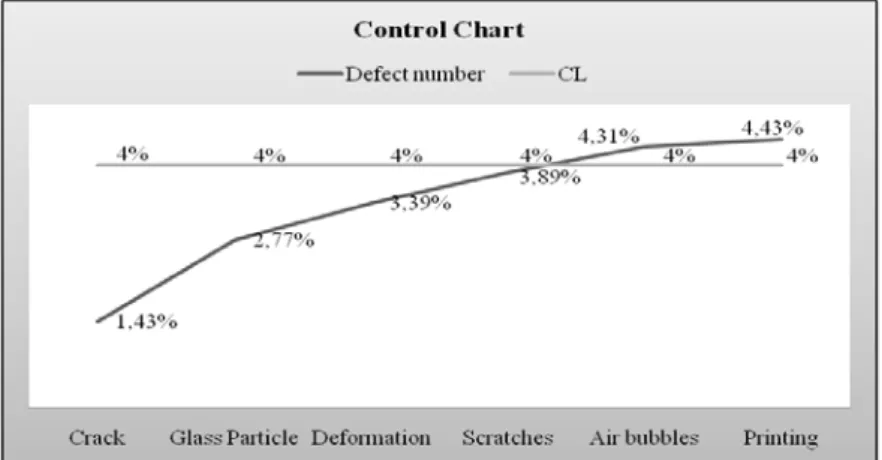
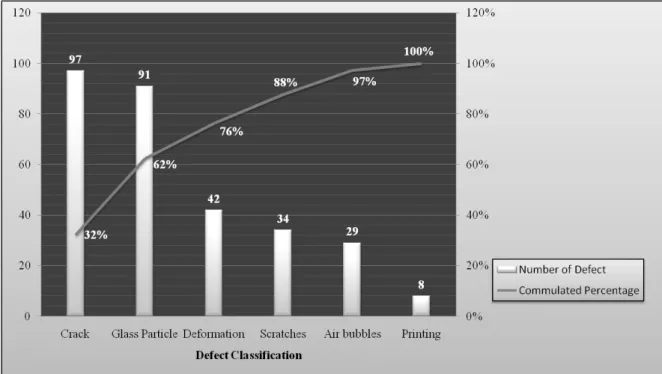
Pareto chart is a type of chart whose purpose is to emphasize the most important among a set of factors by representing individual values of a set of factors in descending order (Frank M. Gryna, 2007). In the Pareto Chart, there are two types of graphs that represent the relationship between the value of each individual and the cumulative percentage of the factors that exist, they are bar graph and line graph. The bar graph shows the individual values of the factors in the graph, while the line graph shows the cumulative percentage of the factors.
Since two types of graphs exist in Pareto chart, there also exists two value information which is on the x-axis of both sides of the Pareto chart's graph, the left x-axis shows the frequency of occurrence or the individual value of each factor and the right x-axis shows the value of the cumulative percentage of the factors. When creating the Pareto chart, it is mandatory to order the factors from the one with the largest individual value to the smallest. While Pareto analysis is a systematic technique used to solve a problem by solving the cause of the problem based on the individual value (the one with the greater value is more important to be solved first).
Failure Mode and Effect Analysis (FMEA)
- Benefits of FMEA
- FMEA Process
- Risk Priority Numbers in FMEA
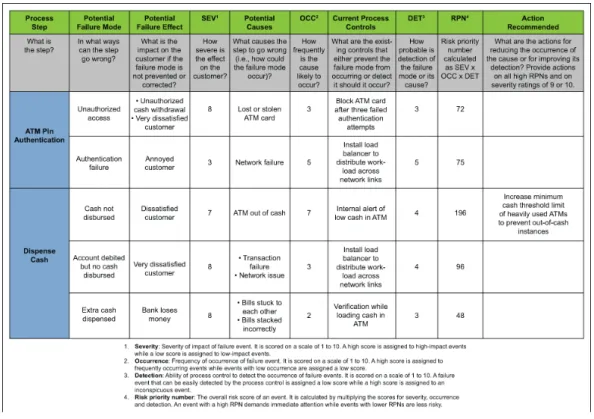
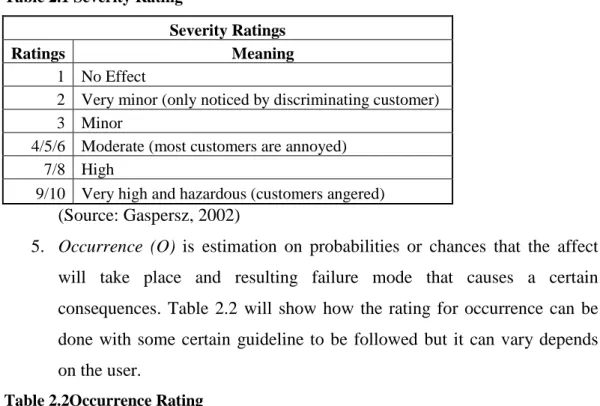
Failures, identify the known and potential failures that may prevent or reduce the performance of the item or process to perform as it's function. Current control, examines the control mechanism available to eliminate or minimize the occurrence of the failure. All the three criteria of FMEA have several values in which the values indicate the rate of the severity, occurrence and detection of the fault that happens in the system.
The third step is to identify the effects of the failure, which is the result of the failure. Once the failure effect is identified, the failure severity rating is given. Severity ratings are ranked using a scale of one to ten, where one equals the least severe and ten equals the most severe.
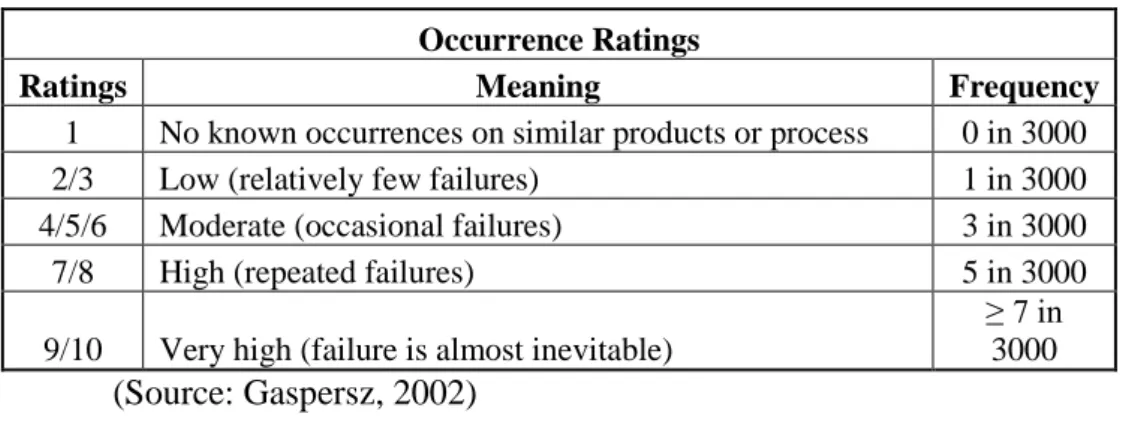
The ranking of the occurrence ratings is to use the scale from one to ten, where one is equal to no occurrence of similar errors in other processes or products, and ten is for very high occurrence of errors. When evaluating the detection ratings, the scale from one to ten scales is used, where one is equal to the error that will definitely be detected, and ten is for the identification of the error will be passed on to the customer undetected, or the customer will not realize that the error occur in the process or product. After the risk priority number is obtained, the next step is to respond to the result of the risk priority number by resolving the failure condition of a product or process that has the highest risk priority number result.
After an action to react to the failure, a recalculation of the RPN should be performed to confirm whether the risk of failure has been reduced.
Fishbone Diagram
Initial Observation
Problem Identification
Literature Study
Data Collection and Calculation
- Data Collection
- Data Tabulation and Calculation
Analysis
Conclusion and Analysis
Data Collection
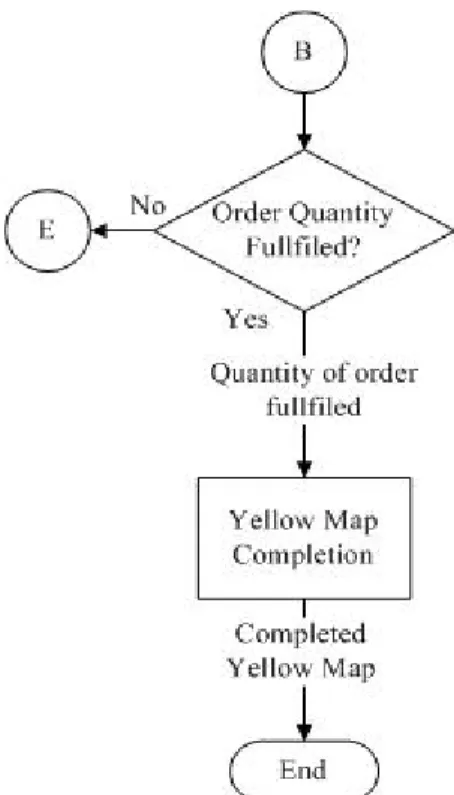
First of all, it begins with flow process diagram to know the step in the production of this product which is an ampoule, the flow process diagram shown in figure 4.1. The production process starts with preparing the material tools and the extended yellow card, and then the machine setup by setup man until the machine is ready to use for mass production, the process starts with loading the material which is the tube glass into machine by the operator, the operator must follow the procedure of Standard Operational Procedure (SOP) to check BFT and also for in process control by sampling. If the ampoules are not in the specification, the operator should inform the setup man to reset the machine, but if the ampoules are still in the specification, the production should continue and the One Point Cut (OPC) and Dot Dimension will be checked and also automatically inspected by the TM 95 Camera of Quality Engineering staff.
The inspection of ampoule again visually by Packer Inspector (PI) on the line before PI put it in the inner box, and it is called pre-pack stage, if the visual aspect is not in specification, the ampoule is rejected and see the cumulative rejection if more than the target that the packer the selector must inform the operator the cumulative rejection must also be less than the target and the operator informs the setup worker to reset the machine, but if not more than the target, the packer inspector prepares the inner box for QC inspection by the controlling QC, then if the defect is greater than AQL, so the ampoules in the inner box are rejected and will not be issued. 30 If the ampoule defect is still in line, the QC controller will inform the packager inspector that defect in line and do the visual check and also inform the installation person, but if the inner reject box is out of line, then set on the red palette for re-selection by the packer inspector, after that the QC controller will re-inspect the re-selected ampoules. The quantity of ampoules is released in scale, if the order quantity is fulfilled, so the Yellow Card has already been completed by the operator, packer inspector, packer, QC controller and production supervisor, it means that the production flow is completed, but the quantity of order is not filled, then the mass production of ampoules must be repeated to meet the demand.
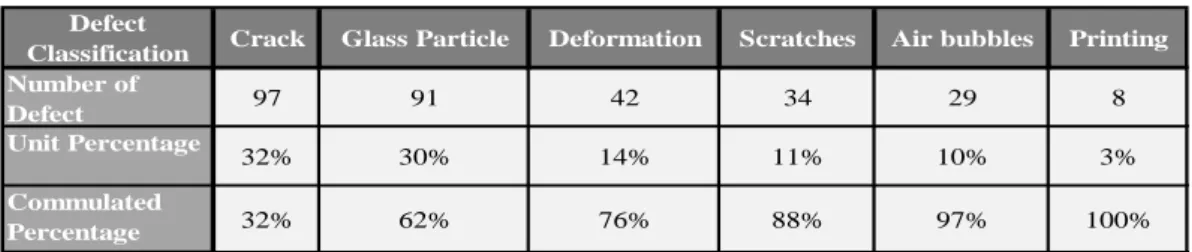
31 After the production process is completed and the product is delivered to customers, the product of ampoules will be inspected again by customer, if they find defect on the product, they will direct a complaint letter to the management complaint department of PT. SIG and the complaint management staff will record the data of complaint based on the letter received, the data shown in table in appendix. Based on the data of complaints that the author returns in table 4.1 above, data is derived from the customer complaints and non-conformity or defect list since January, 1st 2014 to July, 28th 2014, and in total 6794 products of ampoules have been produced in the meantime.
Based on the data, the cracking problem is a defect problem that can be detected visually, maybe many ampoules cracked during shipping, and it may be caused by the annealing process is not good.
Data Analysis
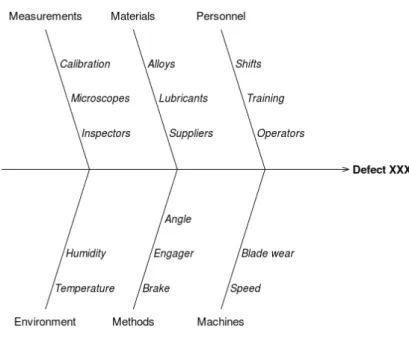
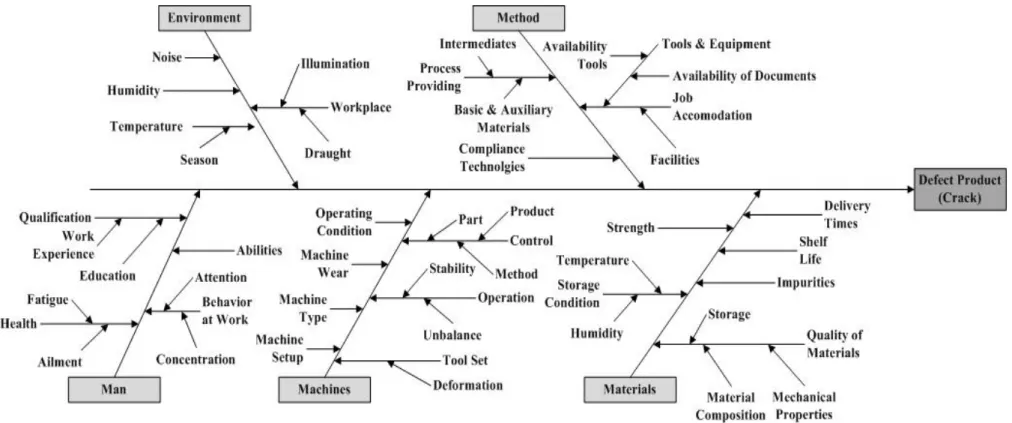
As shown in the figure above, the fisheye diagram shows the main potential problem that created the Defect product. In this case, the material quality and storage condition will become a point of concern to find the main problem of the product defect. In this category, there are some indicators related to machine configuration, machine type, machine wear, operating condition, which control is related to product, part and method, the other one is operation which is related to stability and machine imbalance, then the tool set. indicators related to deformation.
In this category there are several indicators related to the health of the operator, which relate to fatigue and also suffering, qualifications, which relate to work experience, also education, then abilities and operator behavior, which relate to the attention of the operator himself during the operating time. and also the concentration. In this case, there are several indicators that relate to noise from the workplace, humidity, temperature, which relates to the season, and also workplace, which relates to drafts and lighting of the workplace. After classifying the possible main problem of a defective product, the FMEA analysis will be carried out to know the quantitative assessments at the foundation of the main problem.
This method allows us to determine the main problem in a defective product as our main concern to improve for next action. To determine the main problem of defective product, FMEA will be conducted. Then, when performing the FMEA, there are several rankings that should be determined based on the table ranking shown in chapter two, which are the severity in Table 2.1, the occurrence rating in Table 2.2, and the detection rating in Table 2.3.
Finally, after assessing and calculating the causes in the FMEA table, the highest RPN will become the main problem of defective product, which is 294, which belongs to machine cause.
Conclusion
Recommendation
38 lack of quality of material and human resources by finding a new supplier of the material, also check the material before use, and increase the quality of human resources despite giving regular training but also educating them strictly to their personal awareness in the workplace.
Table of Defect Data Products