NO. 584
CHARACTERIZATION OF CORAL COMMUNITIES AT KINGMAN REEF IN THE REMOTE CENTRAL PACIFIC OCEAN
BY
JEAN C. KENYON,JAMES E. MARAGOS, AND CASEY B. WILKINSON
ISSUED BY
NATIONAL MUSEUM OF NATURAL HISTORY SMITHSONIAN INSTITUTION
WASHINGTON, D.C., U.S.A.
DECEMBER 2010
THE REMOTE CENTRAL PACIFIC OCEAN
BY
JEAN C. KENYON,1 JAMES E. MARAGOS,2 AND CASEY B. WILKINSON1
ABSTRACT
Kingman Reef, an atoll in the northern Line Islands of the central Pacific, is among the last of the remote locations in the U.S. Pacific to be scientifically explored underwater, and previously published surveys of its benthic reef communities have been limited to the seaward- facing fore-reef habitat. Here, we apply multivariate statistical analyses to data acquired in 2004 from several complementary survey methods that operate at different scales of spatial and taxonomic resolution to characterize the coral communities in 5 habitats, 3 of which are further stratified by geographic sector or depth zone. Coral cover is highest in the small lagoon pool inside the southeast vertex of the perimeter reef, followed by the fore reef, patch reefs, reef flat, and lagoon slope. Benthic communities are more highly variable on the fore reef, but the coral cover and colony abundances are less dominated by a few key genera than in other habitats. While the relative representation of coral taxa varies among habitats, Porites, Fungia, Pocillopora, Sinularia, Turbinaria, Acropora, and Favia all contribute
> 10% of the total coral cover in at least one habitat. We provide a list of 188 anthozoan and hydrozoan corals observed at Kingman Reef during survey activities since the year 2000. Coral diversity at Kingman is similar to that at Palmyra Atoll to the south but is high compared to other adjacent atolls and reef islands to the south and west (Phoenix and Line Islands) where data are available. Our spatially widespread surveys that generate independent metrics of benthic cover and coral abundance collectively provide the most comprehensive description of coral communities at Kingman Reef produced to date and also provide an important record by which to monitor the response of this community to changing ocean conditions.
___________________________________________________________________
1 Joint Institute for Marine and Atmospheric Research and NOAA Pacific Islands Fisheries Science Center Coral Reef Ecosystem Division, 1125B Ala Moana Blvd., Honolulu, Hawai`i 96814, USA;
Email: [email protected]
2 Pacific Reefs National Wildlife Refuge Complex, U.S. Fish and Wildlife Service, 300 Ala Moana Blvd., Honolulu, Hawai`i 96850, USA
Manuscript received 10 November 2010; revised 1 December 2010.
INTRODUCTION
Kingman Reef (6o24′ N, 162o 24′W), located near the northern end of the Line Island submarine ridge in the central Pacific (Fig. 1), is an atoll reef that encloses a deep lagoon but lacks emergent land. First discovered in 1798, Kingman was named after an American captain who next recorded its occurrence in 1853. Claimed over the following 80 years by businesses with interests in fishing and guano, Kingman Reef was placed under the control of the U.S. Navy in 1934, which in turn transferred the atoll to the U.S. Fish and Wildlife Service in 2001. Managed as a National Wildlife Refuge (NWR) with boundaries extending to 12 nautical miles (nm) offshore, Kingman Reef NWR was included within the Pacific Remote Islands Marine National Monument established by President George W. Bush in January 2009, with monument boundaries extending 50 nm from the mean low water line (U.S. Fish and Wildlife Service, 2010).
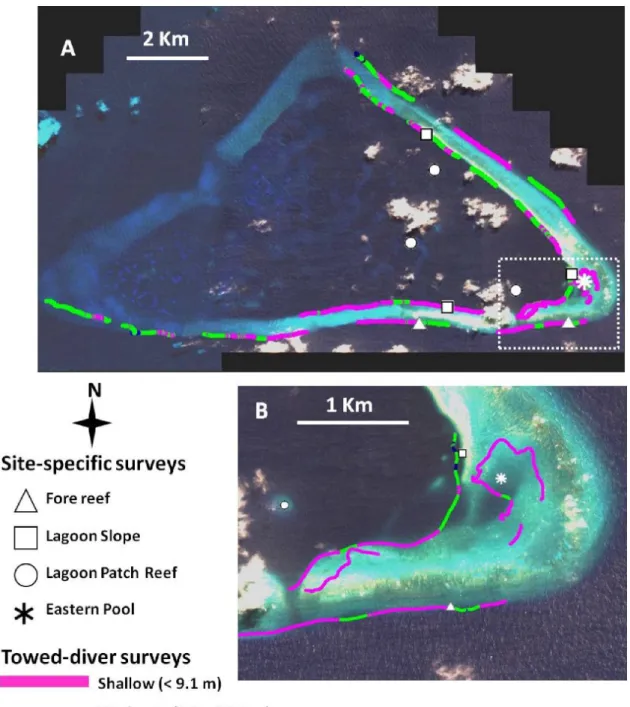
Roughly triangular in shape, the reef perimeter’s longest axis extends ~ 20 km in an east-west direction with its acute eastern vertex facing into windward seas (Maragos et al., 2008). The shallow (~ 3 m) eastern reef crest gradually deepens (~ 20 m) to the west, and two small (~1–2 acre) emergent coral rubble ridges periodically shift contours atop the eastern reef crest. About two dozen known pinnacles with patch reefs rise from the lagoon floor in the shallower east and central area to within several meters of the surface (Friedlander et al., 2010). Inside the southeastern vertex, a small (~ 0.14 km2 ), shallow (maximum ~ 11 m) elliptical lagoon pool (Fig. 2b) hosts a dense assemblage of giant clams and fungiid corals.
While known to support diverse and healthy marine communities, the absence of habitable emergent land, coupled with its distance from human population centers, have rendered Kingman Reef among the last of the remote locations in the U.S. Pacific to be scientifically explored underwater. In 2000, reef assessment and monitoring activities were initiated at Kingman Reef by the NOAA, Pacific Islands Fisheries Science Center’s Coral Reef Ecosystem Division (CRED) in collaboration with scientists from the U.S.
Fish and Wildlife Service as part of a larger multidisciplinary effort to assess and monitor coral reef ecosystems in the U.S. Pacific Islands (Brainard et al., 2008). Broad-scale towed-diver surveys were initiated to provide a spatial assessment of the composition and condition of shallow-water benthic habitats coupled with site-specific surveys to assess species composition, abundance, percent cover, size distribution, and general health of salient benthic organisms including corals. Beginning in 2002, biennial surveys by CRED and its partners have continued to monitor major biotic and abiotic features characterizing Kingman’s nearshore ecosystems so as to document temporal changes and infer the processes underlying reef dynamics. Multidisciplinary studies of benthic and fish assemblages in 2005 and 2007, led by the Scripps Institute of Oceanography, of the fore - reef habitat at four atolls in the Line Islands experiencing varying degrees of population density concluded that reef communities with relatively intact food webs such as those at Kingman are the best available baselines for Pacific reefs (Sandin et al., 2008).
Several additional authoritative reports documenting the near-pristine nature of the coral reef ecosystem at Kingman Reef have been provided by Brainard et al. (2005), Miller et al. (2008), and Maragos et al. (2008).
The main aims of the present study are to (1) describe the community structure of the shallow-water (< 19 m) corals in 5 habitats at Kingman Reef, based on broad- scale and site-specific quantitative surveys conducted in 2004, and (2) provide an updated species lists of anthozoan and hydrozoan corals, based on surveys conducted between 2000 and 2010. In describing community structure, we applied survey
methods that operate at different scales of spatial and taxonomic resolution to generate independent metrics of community abundance. For each method and metric we applied statistical analyses developed for use with multivariate ecological data to determine spatial differences and their underlying taxonomic basis. The summarized results are then integrated with the results of other studies that have examined coral communities at Kingman Reef. Our study, which presents a detailed and spatially widespread
multivariate analysis of the coral communities at Kingman Reef, serves as an important baseline from the early years of the 21st century, which can serve as an important and useful standard for future generations of scientists, managers, and other stakeholders.
MATERIALS AND METHODS Benthic Surveys
Towed-diver surveys were conducted in 2004 (2–4 April) according to the methods of Kenyon et al. (2006a) in the fore-reef slope, lagoon slope, reef flat, and eastern lagoon pool habitats (Figs. 2; 3a,b,c,e). Modifications to these methods included the use of a digital still camera (Canon EOS-10D, EF 20-mm lens) in a customized housing with strobes to photograph the benthos automatically at 15-sec intervals. Site- specific belt-transect surveys to assess coral colony abundance and size class were conducted by two divers (J. Kenyon and J. Maragos) from 2 to 4 April 2004, according to the general methods described by Maragos et al. (2004) for the 2002 Rapid Ecological Assessments. Two sites were surveyed on the fore-reef slope, 3 on the lagoon slope, 3 on hard-bottom patch reefs in the lagoon, and 1 in the eastern lagoon pool (Figs. 2; 3d,f).
Two, 25 x 2 m transect belts were surveyed at each site except for the eastern lagoon pool, where only a single transect belt was surveyed as a result of the high density of coral colonies. Each coral whose colony center fell within a 1- m-wide strip on each side of the lines was classified to genus and its maximum diameter binned into one of seven size classes (Mundy, 1996): 0–5 cm, 5–10 cm, 10–20 cm, 20–40 cm, 40–80 cm, 80–160 cm, or >160 cm. To determine percent cover of benthic components, 12 (35 cm x 50 cm) photoquadrats were concurrently photographed with a Sony DSC P-9 digital still camera with spatial reference to the same two 25-m transect lines: 3 photoquadrats at randomly selected points along each transect and 3 at points 3 m perpendicular from each random point in the direction of shallower water (i.e., 6 photoquadrats per transect; Preskitt et al., 2004; Vroom et al., 2005). Locations of site-specific surveys were determined on the basis of (1) maximizing spatial coverage within the allotted number of survey days;
(2) establishing depths that allowed three dives per day per diver; (3) working within constraints imposed by other ship-supported operations; and (4) sea conditions.
Species lists of anthozoan corals, hydrozoan corals, and miscellaneous anthozoans were compiled in the course of field surveys conducted between 2000 and 2010. Corals were identified in situ to species (by the second author). Photographs were also taken in situ for most species to verify taxonomic assignments and to resolve uncertainties using published guidebooks. In rare circumstances, samples of some corals were also collected to assist in identifications.
Figure 2 . (a) Location of towed-diver and site-specific surveys at Kingman Reef in 2004. Tow track lines are color coded according to the depth zone of the photographs sampled for image analysis. (b) Enlarged view of the southeast corner better showing the eastern lagoon pool and reef flat survey areas.
5
Data Extraction and Analysis
Digital photographs from towed-diver surveys were sampled at 30-sec intervals and quantitatively analyzed for benthic percent cover by a single analyst (C. Wilkinson), using point-count software (Coral Point Count with Excel Extension; Kohler and
Gill, 2006) and using 50 stratified random points per frame. Benthic classification categories included hard coral, soft coral, macroalgae, coralline red algae, non-coral macroinvertebrates, sand, rubble, and pavement. Hard corals were subclassified morphologically as branching, digitate, encrusting, massive, free-living (mushroom) and plate-like. Laser-projected dots used to calibrate image size did not appear on photographic imagery because of mechanical problems; consequently, scaling data from imagery recorded throughout the Northwestern Hawaiian Islands with the same
A B
C D
E F
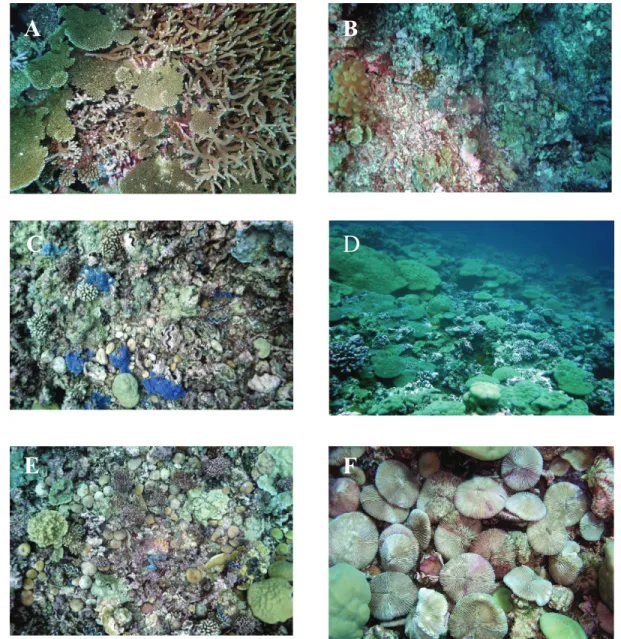
Figure 3 . Benthic communities in 5 habitats at Kingman Reef. (a) Fore-reef slope (b) Lagoon slope (c) Reef flat (d) Lagoon patch reef (e, f) Eastern lagoon pool. Photos a, b, c, e acquired by towed-divers;
photos d, f acquired by roving divers.
methods (Kenyon et al., 2006b, 2007a, 2007b, 2008a, 2008b) were used to calculate average benthic area in captured frames. Survey distances were calculated using a global positioning system (GPS) and ArcView GIS 3.3. The depth of each captured frame was determined by matching the time stamp of the image with that of temperature/pressure data recorded by an SBE 39 recorder (Sea-Bird Electronics, Inc.) mounted on the habitat towboard. For statistical analysis, each frame was categorized in one of 11 strata defined a priori by the concatenation of 3 factors: habitat (fore reef, lagoon slope, reef flat, or eastern lagoon pool), sector (northeast or south, where the southern margin of the eastern lagoon pool was used to separate north from south) and depth zone (shallow [< 9.1 m] or moderate [9.1–18.2 m]). Of 1581 frames, 66 (4.2%) were in depths > 18.2 m and were eliminated from analysis as they were dispersed among 4 habitat sectors and may not have sufficiently represented the spatially extensive deeper strata. The eastern lagoon pool was not stratified by depth because of the small sample size (n = 12 frames), but data were retained in statistical analyses because of the small area (~ 0.14 km2) of the pool. Thus, frames from towed -diver surveys that spanned more than one habitat, sector, or depth zone were parsed into separate strata using the time stamp that linked GPS position and depth to recorded imagery.
Photoquadrats were analyzed for benthic percent cover by a single analyst
(J. Kenyon), using Coral Point Count with Excel Extensions (Kohler and Gill, 2006) and using 50 stratified random points per digital image. Anthozoans were identified to genus, while algae were categorized as Halimeda, other macroalgae, and coralline red algae.
Site locations and tracks of towed-diver surveys georeferenced with nondifferentially corrected GPS units (Garmin® model 12) were mapped using ArcView GIS 3.3.
All statistical analyses were conducted using PRIMER-E®, version 6 (Clarke and Warwick, 2001; Clarke and Gorley, 2006). For towed-diver surveys, benthic percent cover data from each survey frame were treated as individual replicates within a stratum.
Two separate matrices were created. One matrix included percent cover data of all benthic categories to examine differences in overall benthic composition among the strata. A second matrix included only coral data, standardized as percent of total coral cover, to examine differences in relative abundance of coral growth forms among the strata. Square-root transformations were performed on the data matrices to lessen the influence of prevalent benthic components and increase the weight of rare benthic components, and Bray-Curtis resemblance matrices were created from transformed data. To explore atoll-wide spatial distributional patterns, one-way analyses of similarity (ANOSIM; maximum permutations = 9999) were conducted on each matrix to determine if differences existed among strata. When ANOSIM detected global differences, R
values from pairwise tests were examined to determine where major differences existed.
SIMPER (similarity percentages routine) analyses using nontransformed data explored the contribution of individual benthic components or coral groups to the dissimilarities.
To visually depict the relationships of strata to each other based on benthic community structure, data were averaged by stratum, and a Bray-Curtis similarity matrix (with square-root transformations) was generated to create a cluster diagram (group average cluster mode) and nonmetric multidimensional scaling (nMDS) ordinations (number of restarts = 50).
Site-specific photoquadrat and coral belt-transect surveys were conducted within the moderate -depth zone except for the eastern lagoon pool where surveys were conducted at shallow depths (6.4–7.6 m). Percent cover data from each photoquadrat image were treated as individual replicates within sites. Treatment of photoquadrat percent cover data including all benthic categories was similar to that described for towed-diver survey percent cover data. From a matrix including only coral data, ranked cumulative abundance (k-dominance) curves were constructed from nonstandardized data, and ANOSIM was conducted on a matrix of distances generated by DOMDIS (dominance distance) between the dominance curves in the 4 habitats. To explore the relative abundance of coral genera using the numbers of colonies rather than percent cover as a metric, k-dominance curves were constructed from nonstandardized colony count data, and ANOSIM was conducted on a separate matrix of distances generated by DOMDIS between the k-dominance curves in the 4 habitats. R values in pairwise tests were examined for both coral percent cover and colony count data to determine where major differences existed. SIMPER analysis on nontransformed data explored average similarities and dissimilarities among samples and the contribution of individual taxa to the dissimilarities.
To examine differences in size-class structure among habitats of the two most numerically abundant genera, Porites and Fungia, the number of colonies of each genus was standardized and then cumulated for each transect at each site and a resemblance matrix based on Euclidean distance was created for each genus. A one-way ANOSIM was conducted for each genus to determine if the size-class distributions differed among habitats.
RESULTS Towed-diver Surveys
Survey Effort. The distance between frames sampled at 30-sec intervals from benthic tow imagery depends on the tow speed; the average interframe distance ranged from 17.0 m to 30.6 m (mean = 21.2 m, n = 21 tows). The average benthic area captured in laser-scaled frames from the Northwestern Hawaiian Islands and applied to the Kingman tows was 0.583 m2 (SE 0.01, n = 6398 frames). Towed divers surveyed 33.1 km of benthic habitat (Table 1, Fig. 2), from which 1515 frames were analyzed. Given the 3:4 aspect ratio of the captured frames and extrapolating to the total number of consecutive, nonoverlapping still frames that compose the benthic imagery, this benthic analysis area (1515 frames x 0.583 m2/frame = 883 m2) samples a total survey area of 29,194 m2 (Table 1).
Survey effort, assessed by the area analyzed in sampled frames, was somewhat greater on the fore-reef slope than the lagoon slope (434 m2 and 360 m2, respectively;
Table 1). Compared to shallow depths, survey effort at moderate depths was 2.5 times greater on the fore-reef slope and 1.7 times greater on the lagoon slope. Of the 11 strata, survey effort was greatest at moderate depths on the south fore-reef and northeast lagoon slopes (186 m2 and 185 m2 analyzed in sampled frames, respectively).
Spatial Analyses of Benthic Cover and Composition. Percent cover estimates of benthic components from analysis of towed-diver survey imagery exhibited 39% average similarity among all fore-reef slope samples (n = 745), 48% average similarity among all lagoon slope samples (n = 618), 52% average similar among all reef flat samples (n = 140), and 54% average similarity among all eastern lagoon pool samples (n = 12) (Table 1). Average dissimilarity among the 4 habitats was quite consistent, ranging from 62% (between the fore-reef slope and lagoon slope) to 68% (between the lagoon slope and the reef flat). The fore-reef slope and eastern lagoon pool were dominated by coral (39% and 62% of cover, respectively) (Table 1), while the lagoon slope was dominated by turf-covered pavement (47% of cover) and the reef flat by coralline algae (49%
of cover). Average similarity within the 11 strata ranged from 34% to 62%, with the lowest similarity found among shallow-depth south fore-reef samples and the highest among shallow-depth northeast fore-reef samples (Table 1). On the fore-reef slope, the highest coral cover (44%) was found in the shallow-depth south stratum, and the highest coralline algal cover (49%) in the shallow-depth northeast stratum. On the lagoon slope, the highest coral cover (25%) was found in the shallow-depth northeast stratum, and the highest coralline algal cover (26%) in the shallow-depth south stratum.
One-way ANOSIM of towed-diver survey data revealed percent cover of benthic components to be significantly different among the 11 strata (global R = 0.255,
p = 0.0001). Of the 55 pairwise tests, the greatest differences were found between the eastern lagoon pool and the shallow northeast fore-reef strata (R = 0.65) and between the southern lagoon slope and the northeast fore-reef strata at moderate depths ( R = 0.60) (Fig. 4a). SIMPER tests on untransformed data revealed that a large suite of benthic components contributed to the dissimilarities between the habitats, with turf-covered pavement and coralline algae making the largest contributions.
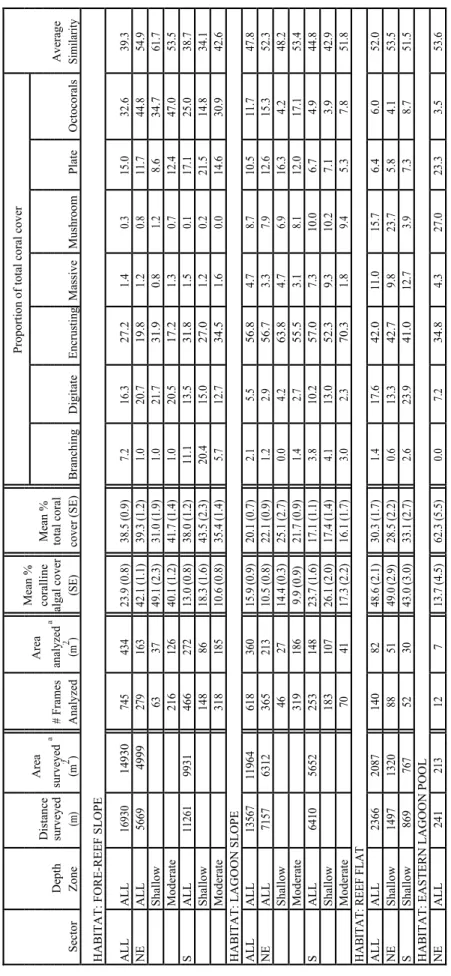
Table 1. Survey effort, coralline algal and coral cover, and average similarity of benthic composition in sampled frames from towed-diver surveys conducted at Kingman Reef, 2004. Shallow: < 9.1 m; Moderate: 9.1–18.2 m
Mean %Proportion of total coral cover AreaArea DistancecorallineMean % surveyeda analyzeda Depthsurveyed# Framesalgal covertotal coralAverage SectorZone(m)(m2 )Analyzed(m2 )(SE)cover (SE)BranchingDigitateEncrustingMassiveMushroomPlateOctocoralsSimilarity HABITAT: FORE-REEF SLOPE ALLALL169301493074543423.9 (0.8)38.5 (0.9)7.216.327.21.40.315.032.639.3 NEALL5669499927916342.1 (1.1)39.3 (1.2)1.020.719.81.20.811.744.854.9 Shallow 633749.1 (2.3)31.0 (1.9)1.021.731.90.81.28.634.761.7 Moderate 21612640.1 (1.2)41.7 (1.4)1.020.517.21.30.712.447.053.5 SALL11261993146627213.0 (0.8)38.0 (1.2)11.113.531.81.50.117.125.038.7 Shallow 1488618.3 (1.6)43.5 (2.3)20.415.027.01.20.221.514.834.1 Moderate 31818510.6 (0.8)35.4 (1.4)5.712.734.51.60.014.630.942.6 HABITAT: LAGOON SLOPE ALLALL135671196461836015.9 (0.9)20.1 (0.7)2.15.556.84.78.710.511.747.8 NEALL7157631236521310.5 (0.8)22.1 (0.9)1.22.956.73.37.912.615.352.3 Shallow 462714.4 (0.3)25.1 (2.7)0.04.263.84.76.916.34.248.2 Moderate 3191869.9 (0.9)21.7 (0.9)1.42.755.53.18.112.017.153.4 SALL6410565225314823.7 (1.6)17.1 (1.1)3.810.257.07.310.06.74.944.8 Shallow 18310726.1 (2.0)17.4 (1.4)4.113.052.39.310.27.13.942.9 Moderate 704117.3 (2.2)16.1 (1.7)3.02.370.31.89.45.37.851.8 HABITAT: REEF FLAT ALLALL236620871408248.6 (2.1)30.3 (1.7)1.417.642.011.015.76.46.052.0 NEShallow14971320885149.0 (2.9)28.5 (2.2)0.613.342.79.823.75.84.153.5 SShallow869767523043.0 (3.0)33.1 (2.7)2.623.941.012.73.97.38.751.5 HABITAT: EASTERN LAGOON POOL NEALL24121312713.7 (4.5)62.3 (5.5)0.07.234.84.327.023.33.553.6 a Area is based on average area of laser-scaled frames sampled at 30-sec intervals.
Spatial Analyses of Coral Cover and Composition. Mean total coral cover on the fore-reef slope was 38.5% (SE 0.9, n = 745), 20.1% on the lagoon slope (SE 0.7, n = 618), 30.3% on the reef flat (SE 1.7, n = 140), and 62.3% in the eastern lagoon pool (SE 5.5, n = 12) (Table 1). Estimates of coral growth form relative abundance derived from analysis of towed-diver survey imagery exhibited 39% average similarity among all fore- reef slope samples, 47% average similarity among all lagoon slope samples, 40% average similarity among all reef crest samples, and 56% average similarity among all eastern lagoon pool samples. Average dissimilarity between samples from the 4 habitats ranged from 57% to 68%, with the greatest average dissimilarities in coral growth form relative abundance between the fore-reef slope and both the reef flat and the eastern lagoon pool (data not shown).
On the fore-reef slope, octocorals dominated the northeast sector at both shallow and moderate depths, while encrusting corals dominated the south sector in both depth zones. Of the scleractinian corals on the northeast fore-reef slope, encrusting growth forms were also the most abundant at shallow depths, but digitate forms were the most abundant at moderate depths. The highest abundance of branching corals (primarily Acropora) was found on the shallow south fore-reef slope. Massive and solitary mushroom corals were rare on the fore-reef slope.
On the lagoon slope, encrusting corals dominated all exposures and depths, accounting for more than half of the total coral cover. The next most abundant coral growth form varied among each of the 4 strata of the lagoon slope (Table 1). Branching corals were rare on the lagoon slope.
Encrusting corals were the most abundant growth form on the reef crest and in the eastern lagoon pool. Solitary mushroom corals were the next most abundant growth form in the eastern lagoon pool and on the northeast portion of the reef flat, but on the south portion of the reef flat digitate corals were the second most abundant growth form.
Species Inventory of Corals and other Anthozoans
A total of 188 species of stony, soft, and hydrozoan corals and 11 other
anthozoans were recorded between 2000 and 2010 (Table 2). Within the class Anthozoa, four taxonomic orders are represented. Within the stony coral order Scleractinia, 13 families containing 35 genera and 173 species are represented.
Site-specific Surveys: Photoquadrats
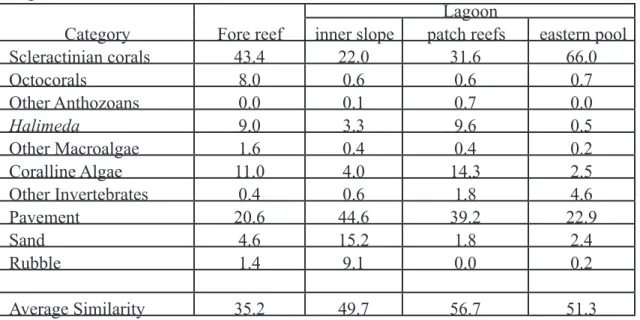
Spatial Analyses of Benthic Cover and Composition. Percent cover estimates of benthic components from analysis of photoquadrat imagery exhibited 35% average similarity among all fore-reef samples (n = 24) and 47% average similarity among all lagoon samples (n = 84), but average dissimilarity between fore-reef and lagoon samples was 65%. Average similarity within the 4 habitats ranged from 35% to 57%, with the lowest similarity found among fore-reef samples and the highest among lagoon patch reef samples. Scleractinian coral dominated the fore-reef slope and eastern lagoon pool habitats, while pavement covered with turf algae dominated the inner lagoon slope and lagoon patch reefs (Table 3).
11
Figure 4. Nonmetric multidimensional scaling (nMDS) ordination depicting relationships of benthic communities based on percent cover data. (a) Towed-diver surveys. Each symbol represents the average of data derived from analysis of imagery captured at 30-sec intervals. Stratum key represents Habitat_Sector_
Depth, where FS = fore-reef slope, LS = lagoon slope, RF = reef flat, and PO = eastern lagoon pool for habitat; S = south and NE = northeast for sector; S = shallow and M = moderate for depth.
(b) Photoquadrats. Each symbol represents a site where data from analysis of 12 photoquadrats were averaged. LP = lagoon patch reefs.
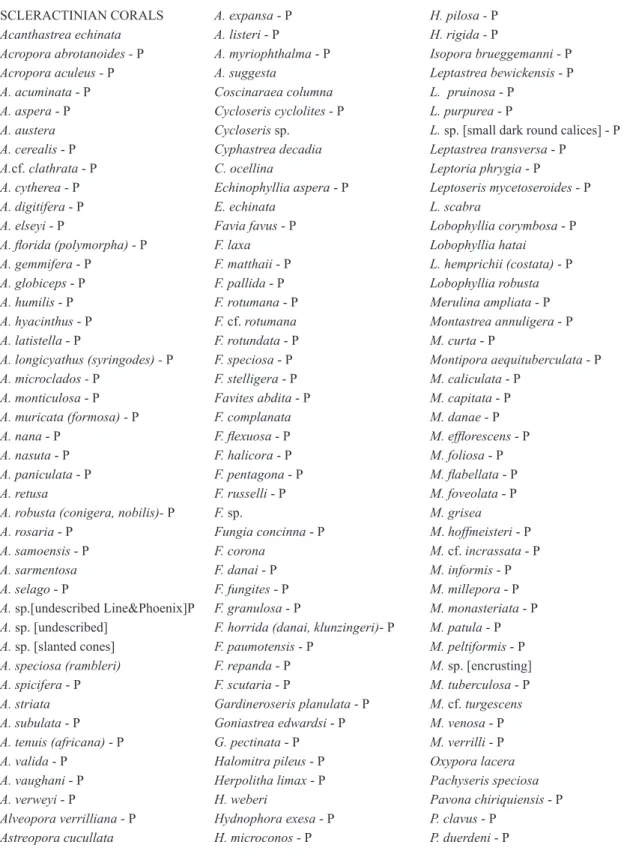
Table 2. Scleractinian corals, octocorals, hydrozoan corals, and other Anthozoa at Kingman Reef from 2000 to 2010 surveys and photos. Species assignments follow Veron et al.
(1977) and Veron (2000) except where there were conflicts with Hoeksema (1989) and Wallace (1999) or contrary preferences of the authors (+). P = at Palmyra Atoll (Williams et al. 2008)
SCLERACTINIAN CORALS A. expansa - P H. pilosa - P
Acanthastrea echinata A. listeri - P H. rigida - P
Acropora abrotanoides - P A. myriophthalma - P Isopora brueggemanni - P
Acropora aculeus - P A. suggesta Leptastrea bewickensis - P
A. acuminata - P Coscinaraea columna L. pruinosa - P
A. aspera - P Cycloseris cyclolites - P L. purpurea - P
A. austera Cycloseris sp. L. sp. [small dark round calices] - P
A. cerealis - P Cyphastrea decadia Leptastrea transversa - P
A.cf. clathrata - P C. ocellina Leptoria phrygia - P
A. cytherea - P Echinophyllia aspera - P Leptoseris mycetoseroides - P
A. digitifera - P E. echinata L. scabra
A. elseyi - P Favia favus - P Lobophyllia corymbosa - P
A. florida (polymorpha) - P F. laxa Lobophyllia hatai
A. gemmifera - P F. matthaii - P L. hemprichii (costata) - P
A. globiceps - P F. pallida - P Lobophyllia robusta
A. humilis - P F. rotumana - P Merulina ampliata - P
A. hyacinthus - P F. cf. rotumana Montastrea annuligera - P
A. latistella - P F. rotundata - P M. curta - P
A. longicyathus (syringodes) - P F. speciosa - P Montipora aequituberculata - P
A. microclados - P F. stelligera - P M. caliculata - P
A. monticulosa - P Favites abdita - P M. capitata - P
A. muricata (formosa) - P F. complanata M. danae - P
A. nana - P F. flexuosa - P M. efflorescens - P
A. nasuta - P F. halicora - P M. foliosa - P
A. paniculata - P F. pentagona - P M. flabellata - P
A. retusa F. russelli - P M. foveolata - P
A. robusta (conigera, nobilis)- P F. sp. M. grisea
A. rosaria - P Fungia concinna - P M. hoffmeisteri - P
A. samoensis - P F. corona M. cf. incrassata - P
A. sarmentosa F. danai - P M. informis - P
A. selago - P F. fungites - P M. millepora - P
A. sp.[undescribed Line&Phoenix]P F. granulosa - P M. monasteriata - P A. sp. [undescribed] F. horrida (danai, klunzingeri)- P M. patula - P
A. sp. [slanted cones] F. paumotensis - P M. peltiformis - P
A. speciosa (rambleri) F. repanda - P M. sp. [encrusting]
A. spicifera - P F. scutaria - P M. tuberculosa - P
A. striata Gardineroseris planulata - P M. cf. turgescens
A. subulata - P Goniastrea edwardsi - P M. venosa - P
A. tenuis (africana) - P G. pectinata - P M. verrilli - P
A. valida - P Halomitra pileus - P Oxypora lacera
A. vaughani - P Herpolitha limax - P Pachyseris speciosa
A. verweyi - P H. weberi Pavona chiriquiensis - P
Alveopora verrilliana - P Hydnophora exesa - P P. clavus - P
Astreopora cucullata H. microconos - P P. duerdeni - P
Table 2 (continued)
SCLERACTINIAN CORALS SCLERACTINIAN CORALS HYDROZOAN CORALS
P. explanulata - P P. vaughani - P Distichopora violacea - P
P. maldivensis - P P. sp. [smooth fingercoral] Millepora platyphylla - P
P. minuta - P P. sp. [large calices] Pennaria sp.
P. varians - P Psammocora haimeana - P Stylaster gracilis
P. venosa - P P. nierstraszi - P Unidentified hydrozoan coral
Platygyra contorta P. profundacella - P
P. daedalea (esperi) - P P. stellata - P Miscellaneous ANTHOZOA
P. lamellina - P P. superficialis Aplexidiscus sp. (Corallimorpharia)
P. pini - P Sandalolitha robusta - P Cryptodendrum adhaesivum (Actinaria)
P. ryukyuensis - P Scapophyllia cylindrica Discosoma sp. - P (Corallimorpharia)
P. sinenis- P Stylocoeniella armata Heteractis magnifica - P (Actinaria)
Plerogyra sinuosa Stylophora pistillata - P H. crispa (Actinaria) - P Pocillopora brevicornis - P+ Turbinaria frondens - P H.malu (Actinaria)
P. capitata - P Turbinaria reniformis - P Phymanthus strandesi (Actinaria)
P. eydouxi - P T. stellulata - P Palythoa [large polyps] (Zoanthidea)
P. meandrina - P P. tuberculosa - P (Zoanthidea)
P. verrucosa - P OCTOCORALLIA CORALS Rhodactis howesii - P (Corallimorpharia)
P. zelli - P Cladiella pachyclados Stichodactyla mertensii (Actinaria)
Porites australiensis - P Dendronephthya mirabilis Zoanthus sp. (Zoanthidea)
P. evermanni - P Lobophytum sp.
P. lichen - P L. sp. B
P. lobata - P Pachyclavularia violacea - P
P. lutea - P Sarcophyton sp. - P
P. rus - P Sinularia sp. - P
P. pukoensis -stephensoni Stereonephthya unnicolor
P. solida - P Subergorgia suberosa
P superfusa - P+
Table 3. Mean percent cover of benthic components, derived from photoquadrat imagery at Kingman Reef, 2004.
Lagoon
Category Fore reef inner slope patch reefs eastern pool
Scleractinian corals 43.4 22.0 31.6 66.0
Octocorals 8.0 0.6 0.6 0.7
Other Anthozoans 0.0 0.1 0.7 0.0
Halimeda 9.0 3.3 9.6 0.5
Other Macroalgae 1.6 0.4 0.4 0.2
Coralline Algae 11.0 4.0 14.3 2.5
Other Invertebrates 0.4 0.6 1.8 4.6
Pavement 20.6 44.6 39.2 22.9
Sand 4.6 15.2 1.8 2.4
Rubble 1.4 9.1 0.0 0.2
Average Similarity 35.2 49.7 56.7 51.3
One-way ANOSIM revealed percent cover of benthic components to be significantly different among the 4 habitats (global R = 0.351, p = 0.0001). For all 6 pairwise comparisons, 0.278 ≤ R ≤ 0.410, indicating weak to moderate separation of benthic components among habitats, with the strongest differences found between the fore-reef slope and lagoon patch reefs, and between the eastern lagoon pool and the 2 other lagoon habitats (Fig. 4b). SIMPER tests on untransformed data confirmed that a large suite of benthic components contributed to the dissimilarities between the habitats, with Porites and turf-covered pavement making the strongest contributions.
Spatial Analyses of Coral Cover and Composition. Mean total coral cover in the 4 habitats ranged from 22.6% on the lagoon slope to 66.7% in the eastern lagoon pool (Table 4). Estimates of coral relative abundance derived from analysis of photoquadrat imagery exhibited 28% average similarity among all fore-reef samples and 51% average similarity among all lagoon samples, but average dissimilarity between fore-reef and lagoon samples was 74%.
Fifteen scleractinian and 4 alcyonacean genera (the octocorals Cladiella, Lobophytum, Pachyclavularia, and Sinularia) were scored in photoquadrats (Table 4). In addition, the cnidarians Heteractis, Palythoa, and Stichodactyla were seen in photoquadrat imagery but did not occur beneath randomly generated points. Average similarity of coral relative abundance within the 4 habitats ranged from 28% to 57%
(Table 4), with the lowest similarity found among fore-reef samples and the highest among lagoon slope samples. Cumulative ranked abundance (k-dominance) curves (Fig.
5a) demonstrated lower dominance (greater equitability) of coral genera in the fore-reef habitat relative to the three lagoon habitats. ANOSIM revealed significant differences among the k-dominance curves in the 4 habitats (global R = 0.507, p = 0.002), with the greatest pairwise difference between the fore-reef and the lagoon slope habitats (R = 0.75) and the least between the lagoon slope and eastern lagoon pool (R = 0.1). SIMPER revealed that Porites and Pocillopora together accounted for ~ 50% of the average dissimilarity between the fore- reef and each of the 3 lagoon habitats, while Porites and Fungia together accounted for ~ 63% of the average dissimilarity between each of the lagoon habitats.
In all 4 habitats, Porites was the most highly ranked coral genus, with its highest relative abundance on the lagoon slope and eastern lagoon pool (Table 4). Pocillopora, Sinularia, and Acropora each accounted for a substantial proportion (> 10%) of the total coral cover on the fore reef but were rare or absent in photoquadrat imagery in lagoon habitats. Turbinaria was the second most abundant coral genus on the lagoon slope but was absent from photoquadrat imagery in other habitats. Fungia was the second most abundant coral genus on the lagoon patch reefs and the eastern lagoon pool. All other genera accounted for < 10% of the total coral cover in all habitats.
Table 4. Relative abundance of coral genera, expressed as percent of mean total coral cover, derived from photoquadrat imagery at Kingman Reef, 2004.
Lagoon
Genus Fore reef inner slope patch reefs eastern pool
Acropora 13.0 0.0 0.0 0.0
Cladiella 0.0 0.0 0.4 0.0
Cyphastrea 0.2 0.2 1.9 0.0
Favia 4.3 0.2 2.6 2.3
Favites 0.2 0.0 0.9 0.5
Fungia 1.2 2.5 24.5 12.1
Gardineroseris 0.0 1.0 0.0 0.0
Goniastrea 0.0 0.0 0.6 0.0
Leptastrea 0.4 0.0 0.7 0.0
Lobophyllia 8.3 0.0 0.0 0.0
Lobophytum 0.0 2.5 0.7 0.5
Montastrea 0.0 0.0 0.4 0.0
Montipora 3.3 0.2 4.3 6.9
Pachyclavularia 1.4 0.0 1.1 0.3
Pavona 1.2 0.0 0.0 1.3
Platygyra 0.0 0.0 0.3 0.0
Pocillopora 18.3 3.5 0.0 0.3
Porites 34.2 75.3 61.7 75.6
Sinularia 14.2 0.0 0.0 0.2
Turbinaria 0.0 14.5 0.0 0.0
Mean (SE) coral cover,
% 51.4 (5.2) 22.6 (3.4) 32.2 (3.3) 66.7 (3.4)
Average Similarity 28.1 57.5 48.8 52.8
Figure 5. Cumulative ranked abundance curves (k-dominance curves) for corals in 4 habitats at Kingman Reef. (a) Based on percent cover data from photoquadrats. (b) Based on colony counts in belt transects. FS
= fore-reef slope, LS = lagoon slope, LP = lagoon patch reefs, and PO = eastern lagoon pool.
Table 5. Relative abundance of coral genera, expressed as percent of total number of coral colonies, derived from belt-transect surveys at Kingman Reef, 2004.
Lagoon
Genus Fore reef inner slope patch reefs eastern pool
Acropora 4.4 0.1 0.9 0.2
Astreopora 0.0 1.9 0.7 0.0
Cladiella 5.6 0.2 0.9 0.1
Coscinaraea 0.1 0.0 0.0 0.0
Echinophyllia 0.2 0.8 0.5 0.0
Favia 11.4 4.7 9.3 2.4
Favites 2.0 0.9 2.3 1.0
Fungia 9.4 30.6 37.8 84.7
Gardineroseris 0.4 0.4 0.1 0.0
Goniastrea 0.0 0.0 0.2 0.0
Halomitra 0.1 0.0 0.0 0.0
Herpolitha 0.4 1.0 0.1 0.0
Hydnophora 1.3 0.5 0.1 0.1
Leptastrea 0.0 1.2 0.4 0.0
Leptoseris 0.1 0.0 0.1 0.1
Lobophyllia 0.7 0.0 0.0 0.0
Merulina 0.0 0.0 0.2 0.0
Millepora 0.0 0.0 0.1 0.0
Montastrea 0.3 0.9 1.3 0.2
Montipora 1.4 5.1 4.4 2.7
Pavona 2.7 0.5 1.5 0.3
Platygyra 1.6 0.2 0.3 0.1
Pocillopora 22.1 0.7 1.0 1.6
Porites 22.5 30.6 29.7 3.9
Psammocora 0.1 1.0 0.6 0.0
Sarcophyton 3.2 7.0 2.3 0.0
Sinularia/Lobophytum 7.1 9.3 4.5 2.6
Stylaster/Distichopora 0.2 0.0 0.0 0.0
Stylophora 0.6 0.0 0.0 0.0
Turbinaria 2.0 2.6 1.1 0.0
Total colonies
enumerated 941 1643 1930 1358
Average Similarity 59.7 51.9 49.5 —
Site-specific Surveys: Coral Belt Transects
Coral Colony Relative Abundance. A total of 5872 colonies belonging to at least 25 scleractinian, 3 alcyonace¬an (the octocorals Cladiella, Sarcophyton, and Sinularia/
Lobophytum), and 2 hydrozoan genera were recorded in belt-transects (Table 5). Average similarity within the 3 habitats with multiple transects ranged from 50% to 60% (Table 5), with the lowest similarity found among lagoon patch reef samples and the highest among fore-reef samples.
Cumulative ranked abundance (k-dominance) curves (Fig. 5b) demonstrated lower dominance (greater equitability) of coral genera in the fore -reef habitat relative to the 3 lagoon habitats. ANOSIM revealed significant differences among the k-dominance curves in the 4 habitats (global R = 0.470, p = 0.001), with the greatest pairwise differ- ence between the fore-reef and the eastern lagoon pool habitats (R = 0.98). Large R val- ues, indicative of spatial differences in relative abundances of different coral taxa, were also characteristic of the lagoon slope in comparison to both the eastern lagoon pool and the fore -reef slope (R = 0.64 and 0.74, respectively). SIMPER revealed that Fungia and Porites accounted for the greatest contributions to the dissimilarities between habitats.
At the 2 south fore-reef sites (Fig. 2), three genera — Porites, Pocillopora, and Favia — accounted for more than half (56%) of all the colonies enumerated (Table 5, Fig. 5b). In the lagoon, Porites and Fungia accounted for more than 60% of all the colonies enumerated in each of the slope and patch reef habitats, while Fungia numerically dominated the eastern pool, accounting for 85% of enumerated colonies. All other genera accounted for < 10% of the total number of colonies in all habitats.
Coral Size-class Distributions. Size-class distributions of Porites varied
significantly among the 4 habitats (global R = 0.332, p = 0.008) (Fig. 6). In pairwise tests, the largest R value was associated with the comparison between the eastern lagoon pool and the lagoon slope (R = 0.96). Inspection of size-class histograms for the 4 habitats (Figs. 6a– d) reveals that less than 10% of the Porites colonies enumerated on the lagoon slope had a maximum diameter > 40 cm, whereas more than 20% of Porites colonies were in larger size classes (> 40 cm) in the other 3 habitats.
Inspection of size-class histograms for Fungia colonies suggests that the popula- tion on the lagoon patch reefs was more strongly skewed towards smaller size classes than populations in other habitats (Figs. 7a –d), but this trend was not statistically signifi- cant (global R = 0.01, p = 0.40). All Fungia colonies had a maximum diameter < 40 cm.
19
(a) Porites, Fore-reef Slope (b) Porites, Lagoon Slope
60 60
n = 212
40 40
20 20
0 0
0‐5 5‐10 10‐20 20‐40 40‐80 80‐160 > 160
n = 502
0‐5 5‐10 10‐20 20‐40 40‐80 80‐160 > 160
(c) Porites, Lagoon Patch Reefs (d) Porites, Eastern Lagoon Pool
60 n = 574 60
40 40
20 20
0 0
0‐5 5‐10 10‐20 20‐40 40‐80 80‐160 > 160
n = 53
0‐5 5‐10 10‐20 20‐40 40‐80 80‐160 > 160
Figure 6(a–d). Size -class (cm) distributions of Porites in 4 habitats at Kingman Reef. The x-axis is maximum diameter (cm); the y-axis is percent of Porites colonies enumerated in each habitat.
(a) Fungia, Fore-reef Slope (b) Fungia, Lagoon Slope
60 n = 88 60
40 40
20 20
0 0
0‐5 5‐10 10‐20 20‐40 40‐80 80‐160 > 160
n = 503
0‐5 5‐10 10‐20 20‐40 40‐80 80‐160 > 160
(c) Fungia, Lagoon Patch Reefs (d) Fungia, Lagoon Eastern Pool
60 60
n = 729
40 40
20 20
0 0
0‐5 5‐10 10‐20 20‐40 40‐80 80‐160 > 160
n = 1150
0‐5 5‐10 10‐20 20‐40 40‐80 80‐160 > 160
Figure 7(a–d). Size -class (cm) distributions of Fungia in 4 habitats at Kingman Reef. The x-axis is maximum diameter (cm); the y-axis is percent of Fungia colonies enumerated in each habitat.
DISCUSSION
Previous quantitative descriptions of benthic community structure and coral cover at Kingman Reef are limited to the fore-reef slope habitat, based on surveys
conducted in 2005 at 10 sites (Sandin et al., 2008). Here, we apply multivariate statistical analyses to data acquired in 2004 from several complementary survey methods that operate at different scales of spatial and taxonomic resolution to characterize the benthic communities at Kingman Reef in relationship to strata defined by habitat, geographic sector, and depth zone. Analysis of imagery recorded during broad-scale surveys conducted by towed divers provide a spatially extensive assessment of benthic communities in the fore-reef slope, lagoon slope, reef flat, and eastern lagoon pool habitats at a relatively coarse level of taxonomic resolution, while site-specific surveys using photoquadrats and belt transects in the fore-reef slope, lagoon slope, lagoon patch reef, and eastern lagoon pool habitats enable finer resolution of corals to the genus or species level. In the following discussion, the diverse metrics generated by these three methodologies are synthesized to provide a baseline description of coral communities at Kingman Reef.
The separation of benthic assemblages among the 4 habitats surveyed by each methodology is graphically demonstrated by nonmetric multidimensional scaling (nMDS) plots, based on data extracted from towed-diver survey and photoquadrat imagery (Fig.
4). For both methodologies, a large suite of benthic components contributed to the dissimilarities among habitats, rather than being driven by a few components. Benthic communities in the fore-reef habitat were distinguished from those in other habitats by the lowest among-sample similarities (i.e., highest variabilities) generated from both broad-scale and photoquadrat survey data. Site-specific photoquadrat and belt-transect surveys demonstrated that coral assemblages on the fore-reef slope had lower dominance (i.e., greater equitability) of coral genera than assemblages in the 3 lagoon habitats (slope, patch reefs, eastern pool). Thus, while the fore-reef samples showed the greatest dissimilarity to each other, the fore-reef coral assemblage was less dominated by a few principal genera than was the case in other habitats. Mean coral cover in the 4 fore-reef strata surveyed by towed divers was 38.5%.
Of the 11 strata surveyed by towed divers, the lowest similarity (34.1%) was found among samples representing the shallow south fore reef. The shallow south fore reef was also distinguished from other fore-reef strata by hosting the highest mean coral cover (43.5%). The highest abundance of branching corals (primarily Acropora, data not shown) was on the shallow south fore reef. Sandin et al. (2008) also noted the abundance of branching corals on the fore reef, especially Acropora. Nonetheless, encrusting corals were the most abundant growth form on the south fore reef at both shallow and moderate depths.
Sandin et al. (2008) report a mean scleractinian (stony) coral cover ~ 42% from image analysis of photoquadrats at 10 fore-reef sites between depths of 10 and 12 m in the south and northeast sectors at Kingman Reef. In contrast, mean scleractinian coral cover from towed-diver surveys between depths of 10 and 12 m on the fore reef (n = 175 frames) was 26.1% (SE 1.4) (data not shown). Estimates of coral cover derived from site-
specific surveys generally exceed those derived from towed-diver surveys (Kenyon et al., 2006b, 2007a,b, 2008 a,b), because site-specific surveys target hard-bottom communities, whereas broad-scale surveys include more variable substrate. Our estimate of coralline algal cover from towed-diver surveys between depths of 10 and 12 m on the fore reef (18.8%, SE 1.5) also differs from that reported by Sandin et al. (2008), ~ 29%. In the present study, coral cover reported from photoquadrats at 2 sites on the south fore reef at moderate depths was 51.4%, whereas coral cover from broad-scale surveys in this stratum was 35.4%. While the capacity to distinguish among coral taxa in photoquadrats is superior to that in towed-diver survey imagery, the much larger area analyzed from towed-diver surveys suggests that this method generates the more accurate estimate of total coral cover over broad spatial scales. In the present study, nearly twice as many coral genera were recorded in fore-reef belt-transect surveys (25) than in photoquadrats (13), which is not unexpected given the comparative areas surveyed (200 m2 vs. 4.2 m2).
The two northeast fore-reef strata were most unlike other strata in terms of overall benthic composition (Fig. 4a). Octocorals dominated the northeast fore-reef slope in both depth zones, accounting for more than a third of the total coral cover (Table 1).
Estimates of coral cover from broad-scale surveys of the lagoon slope ranged from 16.1% in the south sector at moderate depths to 25.1% in the northeast sector at shallow depths, with a habitat-wide average of 20.1%. In all lagoon slope strata, encrusting coral was the most dominant growth form (Table 1). Estimates of coral cover from photoquadrat imagery in the lagoon slope habitat (22.6%, Table 3) are in good agreement with those from broad-scale surveys. Porites made the greatest contribution to total coral percent cover (75.3%; Table 4, Fig. 5a) and, with Fungia, co-dominated the coral assemblage in regards to the number of colonies (Table 5, Fig. 5b). Despite the abundance of Porites in the lagoon slope habitat, the population was distinguished from congeneric populations in other habitats by a smaller proportion of colonies in large (>
40 cm maximum diameter) size classes (Fig. 6b). Turbinaria was the next most abundant coral genus in terms of percent cover (14.5%) but accounted for less than 3% of the total number of colonies enumerated. Average similarity values among lagoon slope samples acquired by different methodologies were quite consistent, ranging from 48% (Table 1) to 52% (Table 5), with the exception of higher average similarity (i.e., less variability) of coral relative abundance samples from photoquadrats (58%; Table 4). A general statement by Maragos et al. (2008) that “corals are more abundant and varied on seaward [fore- reef] slopes vis-à-vis lagoon slopes” is supported by percent cover data (Tables 1, 3) and k-dominance curves (Fig. 5) in the present study.
To date, the shallow reef flat has only been surveyed with the use of towed-diver surveys. This method is well suited to assess habitat that may be difficult for roving divers to survey due to strong surge or currents. Coral cover was relatively high in this habitat, averaging 30.3% over the 2.4 km surveyed (Table 1). The most dominant coral growth form was encrusting, with mushroom corals abundant on the northeast reef flat adjoining the eastern lagoon pool.
Benthic components in samples from lagoon patch reefs showed the highest among-sample similarity (56.7%) of the 4 habitats surveyed with photoquadrats.
Mean coral cover was 32.2%, and mean coralline algal cover was greater in this
habitat than the other habitats surveyed by roving divers (14.3%). Porites made the greatest contribution to coral percent cover (61.7%, Table 4) and accounted for ~30%
of the colonies enumerated in this habitat, with moderately sized colonies (20–40 cm maximum diameter) as the most abundant size class. Fungia was the most abundant genus in terms of the number of colonies (37.8% of total) and also accounted for nearly a quarter of the total coral percent cover, although few Fungia colonies exceeded 20 cm maximum diameter. Coral dominance patterns were intermediate between those demonstrated in the fore-reef slope and eastern lagoon pool habitats.
Of the 5 habitats surveyed, mean coral cover was highest in the eastern lagoon pool, with good agreement between values generated from broad-scale surveys (62.3%, Table 1) and from photoquadrats (66.7%, Table 3). Encrusting corals were the most dominant growth form in broad-scale survey imagery, followed by mushroom corals (34.8% and 27.0% of coral cover, respectively). Porites only accounted for 3.9% of the total number of colonies enumerated (Table 5), but made the greatest contribution to percent cover (75.6%; Table 4). Conversely, Fungia accounted for 84.7% of the colonies enumerated at the site surveyed by roving divers (Fig. 2b, Table 5), yet only contributed 12.7% of the total coral cover (Table 4). Maragos et al. (2008) also note the large number of Fungia colonies in the eastern lagoon pool. Colony abundance, derived from belt transects, and percent cover, derived from photoquadrats, are two independent metrics of coral relative abundance. A taxon with a small number of large colonies may contribute substantially to total coral cover but only account for a small proportion of the total number of colonies in a coral assemblage. A quarter of all the Porites colonies enumerated in the eastern lagoon pool were very large (80–160 cm maximum diameter;
Fig. 6d) which helps to explain the disparity between the number of colonies and percent cover. Similarly, the lack of correspondence in Fungia between relative abundance as indexed by percent cover and by proportion of colonies is driven by the comparatively small size of Fungia colonies (Fig. 7d). Both percent cover and colony abundance are important metrics. Percent cover, along with growth morphology, shapes the physical structure of the benthic environment experienced by organisms such as fish and other invertebrates (Jones et al., 2004; Idjadi and Edmunds, 2006), while colony abundance influences density-dependent processes including disease transmission by infectious vectors, the probability of fertilization during sexual reproduction, and habitation for commensal organisms that occupy different coral taxa.
Of 199 cnidarian taxa reported from Kingman Reef in this study, 147 (73.9%) have also been reported from Palmyra Atoll (Williams et al., 2008; J. Maragos, unpubl.
data), centered at 5o52′N, 162o06′W to the south. Conversely, of 198 cnidarian taxa reported from Palmyra by Williams et al. (2008) and Maragos (unpubl. data), 141 (71.2%) are reported in this study. Four scleractinian genera observed at Kingman Reef (Acanthastrea, Coscinaraea, Plerogyra, Stylocoeniella) have not been reported from Palmyra, and 6 cnidarian genera including 5 scleractinian genera observed at Palmyra (Balanophyllia, Ctenactis, Plesiastrea, Symphyllia, and Tubastraea) have not been reported from Kingman. Kingman and Palmyra lie predominantly in the North Equatorial Countercurrent (NECC), a warm, eastward flowing surface countercurrent that seasonally varies in position and strength. During the boreal spring (February–April), the NECC is