Augmented Reality for Cultivating Computational Thinking Skills in Mathematics Completed with Literature Review, Bibliometrics, and Experiments for
Students
Lilis Marina Angraini1,*, Aay Susilawati2, Muchamad Subali Noto3, Reni Wahyuni1, Dedek Andrian1
1Department of Mathematics Education, Universitas Islam Riau, Indonesia
2Department of of Science Education, Universitas Pendidikan Indonesia, Indonesia
3Department of Mathematics Education, Universitas Swadaya Gunung Djati, Indonesia
*Correspondence: E-mail: [email protected]
A B S T R A C T A R T I C L E I N F O
The research problem centered around the need to enhance students' computational thinking (CT) ability, which is crucial for their success in the present and future. This study aims to examine the efficacy of Augmented Reality (AR) in improving the CT abilities of seventh-grade junior high school students.
The study utilized a quasi-experimental design with a control group and an experimental group to meet the research aims.
The control group was provided with conventional mathematical instruction through established teaching methods, while the experimental group was exposed to mathematics learning enhanced by AR media. The study involved 160 students from four junior high schools located in one of the cities in Indonesia. A five-question CT ability test was employed as the research instrument. The mean difference test was used to analyze the data and compare the performance of the control and experimental groups. The research findings indicated that the effective application of AR media significantly enhanced the CT skills of seventh- grade adolescents in middle school. The results aid in creating new teaching approaches and emphasize the possibilities of AR technology in math education.
© 2024 Tim Pengembang Jurnal UPI
Article History:
Submitted/Received 14 Des 2023 First Revised 30 Jan 2024 Accepted 19 Feb 2024
First Available online 21 Feb 2024 Publication Date 01 Apr 2024
____________________
Keyword:
Augmented reality, Computational thinking, Junior high school, Learning media.
Indonesian Journal of Science & Technology
Journal homepage: http://ejournal.upi.edu/index.php/ijost/
1. INTRODUCTION
Technological advancements in the era of Digital Society 5.0 progress swiftly and have the potential to enhance human lives. Many reports regarding this development for supporting society 5.0. have been well-documented (Damayanti et al., 2022; Shaffiyah et al., 2022).
Technology has transformed education from being passive and reactive to participatory and proactive. Education is crucial in an academic setting and is intended to stimulate students' attention. Technology can help pupils understand and remember things more easily (Siregar, 2023). The use of technology, especially online educational resources, significantly influences the field of education. The generation raised with internet access and technological progress relies significantly on online resources for information and creating a virtual learning environment. Students find many online instructional resources, including YouTube, enjoyable and believe they help improve their skills. Although technology provides great help, it is essential to highlight that the teacher's function as a mentor and companion for students during the learning process remains crucial.
Moreover, the inherent drive, passion for acquiring knowledge, and self-assurance of students are crucial elements that impact the effectiveness of learning using technology.
Integrating technology in school enhances learning quality, but requires instructors' active participation for optimal outcomes (Adijaya, Armawan & Kristiantari, 2023; Yuliani, Kaur &
Jageer Singh, 2023; Pratiwi, Amumpuni, Fikria & Budiastuti, 2023; Hudriati, Yunus & Arham, 2023; Nur, Widodo & Putro, 2023). Regarding the significance of technology in education today, technology holds an extremely significant educational role in schools and learning today, particularly in mathematics learning (Valtonen et al., 2020).
Augmented reality (AR) is an innovative technology that combines digital information with the physical world (Hsiao & Chang, 2016; Bangkerd and Sangsawang, 2021; Albar, 2021;
Castañeda et al., 2018). It incorporates virtual elements like photos, movies, and three- dimensional (3D) objects into the physical environment. AR is a technology that enables the interactive display of three-dimensional virtual objects in the real world (Dutta et al., 2022).
AR media can be applied in schools.
The implementation of AR into the learning process has great profits (Patzer et al., 2014;
Almenara & Vila, 2019): It can enhance students' willingness to learn and their ability to comprehend material because of the varied and interactive visual representations it offers (Iatsyshyn et al., 2020). Based on research by Chang & Hwang (2018), it incorporates virtual elements like photos, movies, and three-dimensional (3D) objects into the physical environment. AR is a technology that enables the interactive display of three-dimensional virtual objects in the real world.
AR integrates additional elements into a physical environment to enrich the user's perception of reality. It necessitates a setting and a suitable camera included in our gadgets like cellphones, tablets, or PCs. AR contains three main characteristics outlined by Azuma (1997):
(i) it merges the actual and virtual environments to offer users novel and distinct experiences related to their actions;
(ii) it enables real-time interactivity, delivering an interactive experience, and (iii) it is rendered in 3D.
AR should be integrated into all disciplines in schools, particularly those perceived as challenging by pupils, rather than being limited to certain subjects. Mathematics is one of those challenging courses. (Dinayusadewi & Agustika, 2020). AR technology in mathematics education improves information visualization, with marker-based AR being more prevalent than non-marker-based AR. The majority of AR applications are created using Unity 3D with
the Vuforia software development kit (SDK) (Ahmad & Junaini, 2020). Unity is a software application utilized for processing images, visuals, sound, input, and other elements to create games or similar products like AR applications (Putra & Putra, 2021; Pramuditya et al., 2022).
Unity 3D is a sophisticated and completely integrated development platform that offers pre- built tools for developing interactive 3D content. Vuforia is an SDK created for cellphones to help develop AR experiences. The Vuforia AR Extension for Unity is a specialized extension of the Vuforia SDK made expressly for use with Unity. Vuforia is a software development kit (SDK) developed by Qualcomm for creating AR apps on iOS and Android mobile devices (Putra
& Putra, 2021). The Vuforia SDK serves as a central connection interface between the virtual realm and the actual realm (X. Liu et al., 2018).
AR media can enhance students' engagement in learning mathematics and reduce boredom (Syafril et al., 2021; Nurvitasari, & Sulisworo, 2023). Many have researched and developed learning media based on AR in mathematics learning, as done by Dinayusadewi &
Agustika (2020), where it may be inferred AR technology can be used as a tool for learning mathematics on geometric concepts in schools. Dinayusadewi & Agustika (2020) Outlined challenges faced by teachers while creating AR-enhanced learning materials and methods, such as difficulties in meeting essential hardware and software needs and having restricted access to various sources of information, whether they be human, online, or in print. Teachers have taken steps to address these issues by gradually upgrading laptops, seeking references in foreign languages, and establishing a learning community.
Computational thinking (CT) is an essential skill needed in the 21st century (Curzon et al., 2009). CT is a crucial talent for all students. (Vinayakumar et al., 2018; Deng et al., 2020;
Mohamed et al., 2019; Araujo et al., 2019; Y.-C. Liu et al., 2021; Repenning et al., 2016; Li et al., 2020; Silva et al., 2018; Tofel-grehl & Richardson, 2018; Mitrayana and Nurlaelah, 2023; Valovičová et al., 2020; Voogt et al., 2015; Yang et al., 2020). CT is a demonstrated skill that involves two main steps: abstracting the problem and automating the answer (Israel et al., 2015; Park & Green, 2019). CT is a method of thinking that utilizes abstraction, generalization, decomposition, algorithmic reasoning, and debugging (Kale et al., 2018; Lee et al., 2023; Angeli et al., 2016). Critical thinking is the systematic process of examining, evaluating information and evaluating information to solve complex problems using a structured approach (Anderson, 2016; Barr et al., 2011).
CT skills are crucial for problem-solving and have particular relevance within the realms of science, engineering, and mathematics (Taslibeyasz et al., 2020). CT has occurred likened to mathematical reasoning involves beliefs, problem-solving, and justification (Rich et al., 2020;
Shute et al., 2017). Mathematics activities are closely connected to CT as they emphasize skills and processes (Nordby et al., 2022; Mohaghegh & Mccauley, 2016). Mathematics education focuses on three key parts of CT: problem-solving, cognitive processes, and transposition (Kallia et al., 2021; Urhan, 2022).
Proficiency in mathematical critical thinking is essential since it provides students with problem-solving skills, logical reasoning, and the capacity to analyze and interpret mathematical topics. It enables students to approach complex mathematical problems systematically and develop strategies to find solutions. Additionally, CT is crucial in multiple disciplines like as mathematics, science, engineering, and computer programming. The mathematical CT ability of students is low attributed to several factors. These factors can include a lack of exposure to problem-solving tasks, limited opportunities to engage in critical thinking activities, inadequate instructional approaches that focus solely on memorization rather than understanding, and insufficient practice in applying CT strategies. Low mathematical CT ability may manifest as students struggling to analyze problems, find
multiple solution paths, make connections between different mathematical concepts, and apply logical reasoning in their problem-solving process.
Current traditional learning methods may not adequately support the development of CT skills. Traditional instruction often emphasizes rote memorization and procedural knowledge, rather than promoting conceptual understanding and problem-solving strategies. As a result, students may struggle to transfer their mathematical knowledge to real-life situations and encounter difficulties in applying CT skills. Geometry content was chosen for this research because it offers opportunities to develop and apply CT skills. Geometry involves spatial reasoning, visualizing objects and relationships, and using logical reasoning to solve geometric problems. These activities align well with the cognitive processes related to CT, like pattern recognition, abstraction, and deconstruction, and algorithmic reasoning.
AR media was selected as a tool for enhancing mathematics learning because it provides unique advantages. AR integrates digital information into reality, enabling students to engage with virtual objects and visualize mathematical concepts more engagingly and interactively.
AR media can present three-dimensional representations, interactive visualizations, and simulations, which can facilitate students' understanding, exploration, and problem-solving in geometry. Compared to other media, AR provides a more engaging and participatory educational experience, enabling students to connect abstract mathematical ideas with practical real-world uses. While other media, such as textbooks or digital simulations, can also support mathematics learning, utilizing AR media adds a layer of interactivity and realism. By overlaying virtual objects in the real world, AR enhances students' spatial understanding, visualization, and engagement. This makes AR a promising tool for promoting CT skills, as it provides a unique and dynamic learning experience that enhances pupils' problem-solving skills, critical thinking, and conceptual understanding in mathematics.
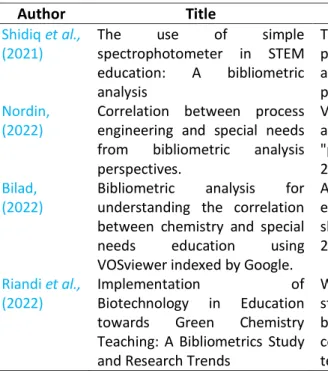
This research aims to examine how using AR media can improve the critical thinking (CT) skills of junior high school pupils. The research data gathered pertains to the student's mathematical CT skills, specifically in the context of geometry. We also added bibliometric analysis since it can describe the current research situation. Detailed information regarding previous research in bibliometrics is demonstrated in Table 1.
Table 1. Previous studies on bibliometric.
Author Title Result
Shidiq et al., (2021)
The use of simple
spectrophotometer in STEM education: A bibliometric analysis
The study, which made use of the VOSviewer program, found that modified spectrophotometers are frequently used in chemistry and STEM teaching, providing prospects for future research.
Nordin, (2022)
Correlation between process engineering and special needs from bibliometric analysis perspectives.
VOSviewer, a process engineering tool for mapping analysis, experienced a decrease in publications on
"process engineering special demands" between 2017 and 2021.
Bilad, (2022)
Bibliometric analysis for understanding the correlation between chemistry and special needs education using VOSviewer indexed by Google.
An analysis of articles on chemistry and special education using VOSviewer and Publish or Perish showed a decline in publications in 2017 and a rise in 2021.
Riandi et al., (2022)
Implementation of
Biotechnology in Education towards Green Chemistry Teaching: A Bibliometrics Study and Research Trends
With journals being the most prevalent source, the study bibliometric analysis of research trends on biotechnology in education revealed four study concept potentials, underscoring the significance of teaching green chemistry in schools.
Table 1 (Continue). Previous studies on bibliometric.
Author Title Result
Nordin, (2022)
A bibliometric analysis of computational mapping on publishing teaching science engineering using VOSviewer application and correlation.
A study that examined teaching, science, and engineering research using the VOSviewer and Perish applications found a significant drop because of pandemic conditions.
Wirzal &
Putra, (2022)
What is the correlation between chemical engineering and special needs education from the perspective of bibliometric analysis using VOSviewer indexed by Google Scholar?
Utilizing the VOSviewer software, a research study on the relationship between chemical engineering and special needs examined 800 pertinent papers between 2018 and 2022.
Nandiyanto
& Al Husaeni, (2021)
A bibliometric analysis of materials research in Indonesian journal using VOSviewer
A bibliometric assessment of research on Indonesian materials was conducted using VOSviewer, and the results showed that "acid" received the most attention from 2016 to 2021, with 43 publications and 8 foreign linkages.
Maryanti et al., (2022)
Sustainable development goals (SDGs) in science education:
Definition, literature review, and bibliometric analysis.
The bibliometric analysis, a vital instrument in science education, offers a thorough grasp of the subject, underscoring the important role it plays in facilitating research on the SDGs.
Nandiyanto
& Al Husaeni, (2021)
A bibliometric analysis of chemical engineering research using VOSviewer and its correlation with covid-19 pandemic condition.
Despite a decline in research since 2019, chemical engineering uses VOSviewer software for bibliometric analysis, which provides useful information on research trends and themes.
Al Husaeni, (2022)
Computational bibliometric analysis of research on science and Islam with VOSviewer:
Scopus database in 2012 to 2022.
In a study on science and Islamic research, VOSviewer was used for bibliometric analysis, which revealed a drop in research, particularly in Indonesia and Malaysia. This study also provided excellent reference materials for future research.
Al Husaeni, (2022)
Bibliometric analysis of briquette research trends during the Covid- 19 pandemic.
A review of 973 pertinent papers on briquettes was analyzed using VOSviewer, bibliometric analysis, and data mapping; the results showed a decline in research over the previous three years as a result of the COVID-19 pandemic.
Ragadhita &
Nandiyanto, (2022)
Computational bibliometric analysis on publication of techno-economic education.
A study on science and Islamic research that employed data from the Scopus database from 2012 to 2022 and VOSviewer for bibliometric analysis found a reduction in research, mainly in Indonesia and Malaysia.
Al Husaeni
&
Nandiyanto, (2022)
Bibliometric computational mapping analysis of publications on mechanical engineering education using VOSviewer
A study that used VOSviewer to chart the development of nano propolis research over the last ten years found a spike in research on nanoparticles and propolis.
Febriandi et al., (2023)
Research on algebraic thinking in elementary school is reduced:
a bibliometric analysis
VOSviewer, a bibliometric approach, was used to analyze 996 articles from 2012–2021, revealing a decline in research on algebraic thinking skills and providing valuable insights for future research.
Supriyadi et al., (2023)
Global trend of ethnoscience research: a bibliometric analysis using Scopus database
An analysis of the Scopus database showed that ethnoscience research has significantly increased over the past 50 years.
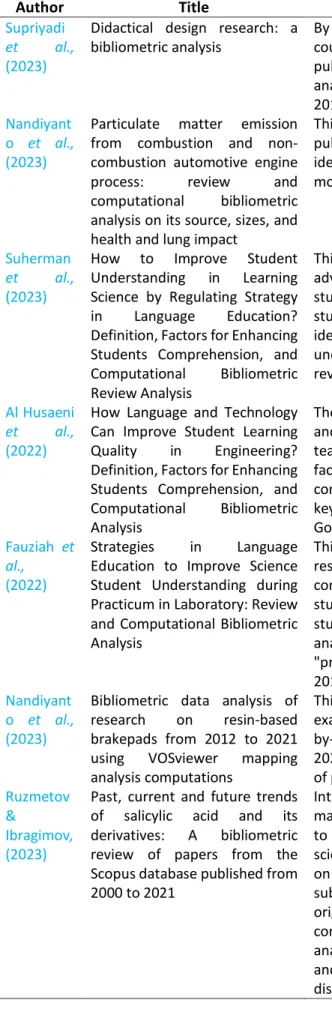
Table 1 (Continue). Previous studies on bibliometric.
Author Title Result
Supriyadi et al., (2023)
Didactical design research: a bibliometric analysis
By identifying research topics, authors, sources, countries, affiliations, and most-cited papers in DDR publications, Scopus offers bibliometric analysis. This analysis showed a large growth in DDR initiatives from 2015 to 2022.
Nandiyant o et al., (2023)
Particulate matter emission from combustion and non- combustion automotive engine process: review and computational bibliometric analysis on its source, sizes, and health and lung impact
This study discusses the growth trend of scientific publications on the topic of particulate matter identified based on several categories such as the most cited, publisher, author, country, and affiliation.
Suherman et al., (2023)
How to Improve Student Understanding in Learning Science by Regulating Strategy in Language Education?
Definition, Factors for Enhancing Students Comprehension, and Computational Bibliometric Review Analysis
This study intends to clarify research on the advancement of language education to improve students' understanding of science education. This study analyzes the definition of these methods, identifies components that improve students' understanding, and does a computational bibliometric review analysis.
Al Husaeni et al., (2022)
How Language and Technology Can Improve Student Learning Quality in Engineering?
Definition, Factors for Enhancing Students Comprehension, and Computational Bibliometric Analysis
The project aims to investigate progress in language and technology research to improve the efficiency of teaching and learning in engineering. An analysis of factors impacting the teaching and learning process is conducted using a bibliometric study utilizing the keywords "Language" and "Engineering Learning" on Google Scholar from 2020 to 2022.
Fauziah et al., (2022)
Strategies in Language Education to Improve Science Student Understanding during Practicum in Laboratory: Review and Computational Bibliometric Analysis
This study aims to elucidate the progress of language research in scientific education to enhance students' comprehension during laboratory practicums. This study investigates the characteristics that enhance student comprehension and does a bibliometric analysis focusing on the terms "language",
"practicum", "laboratory", and "science" between 2015 and 2021.
Nandiyant o et al., (2023)
Bibliometric data analysis of research on resin-based brakepads from 2012 to 2021 using VOSviewer mapping analysis computations
This work aims to thoroughly and methodically examine bibliometric data using VOSViewer in a step- by-step manner. Analyzed 88 documents from 2017- 2021 on predetermined subjects based on the number of publications collected.
Ruzmetov
&
Ibragimov, (2023)
Past, current and future trends of salicylic acid and its derivatives: A bibliometric review of papers from the Scopus database published from 2000 to 2021
Interest in salicylic acid and its derivatives has markedly increased over the last two decades, leading to a surge in academic research on this topic. Many scientometric investigations have concentrated solely on a particular characteristic of the subject substances. No discussions are held regarding the origin and future potential of SA and its related compounds. This study conducts a bibliometric analysis of 2010 publications published between 2000 and 2021 that were included in Scopus in the sub- discipline of salicylic and salicylates.
2. LITERATURE REVIEW 2.1. Augmented Reality
AR is a technology that combines the physical environment with the virtual world by displaying two or three-dimensional virtual things, creating a seamless integration with reality. Utilizing learning media through AR can stimulate critical thinking among learners, encouraging problem-solving and aiding in visualizing abstract concepts for comprehension and model structuring (Romalee et al., 2023; Urlings et al., 2022; Mahrou et al., 2021). AR employs digital elements such as images, text, 3D models, or computer-generated videos to deliver additional information or virtual objects. Integration of AR takes place in the real- world environment, encompassing classrooms, books, whiteboards, or other physical objects.
AR establishes a bridge between the tangible world and digital elements. Devices like smartphones, tablets, or AR glasses serve to project digital elements into the real world. Users observe their physical surroundings through the device screen, enriched with digital overlays.
An integral aspect of AR is the active interaction users have with digital elements, involving touch screens, physical gestures, or voice commands for manipulation or accessing extra information (Zafar & Zachar, 2020; Mladenovic et al., 2022).
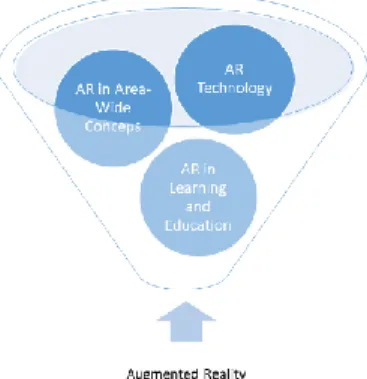
The educational concept of AR aims to enrich students' understanding, engagement, and interaction with learning materials. Digital elements presented can include illustrations, animations, or supplementary information supporting the learning content. By delivering additional content visually and interactively, AR enhances students' learning experiences, making the material more captivating and easily comprehensible (Lima, Walton & Owen, 2022; Amantini et al., 2020). AR facilitates the presentation of information in a context relevant to the surrounding environment. For instance, it can showcase a 3D model of human body organs during a biology lesson. The AR concept is versatile and applicable across various subjects like mathematics, science, history, and language, introducing a more dynamic approach to learning. AR provides flexibility in accessing learning material, enabling students to use AR devices at their convenience. Some AR applications even foster collaboration and shared learning experiences, supporting team-based learning and social interaction (see Figure 1) (Sharmin et al., 2022; Jeon, Oh & Son, 2021).
AR empowers students to directly visualize and manipulate 3D shapes. They can explore the surface and volume of three-dimensional objects and correlate them with the concept of unit area. AR devices allow students to interactively measure area, placing virtual measuring tools on a surface as if measuring it right before their eyes. AR can simulate how the unit area concept is applied in everyday scenarios, such as designing a garden or planning room layouts.
Students can compare areas between different geometric shapes in AR, understanding the differences in a 3D visual context (Mladenovic et al., 2019; Mladenovic et al., 2020; Llena et al., 2018). Table 2 shows the applications of AR in various fields.
Figure 1. Applications of AR.
Table 2. Application of AR in various fields.
Fields Application of AR
Education AR can provide a simulated laboratory environment, enabling students to do experiments without using actual equipment. This fosters an engaging and secure learning environment.
Interactive Educational Maps: Utilizing AR in maps or educational materials can supply supplementary information as students delve into the topography, history, or culture of specific locations.
Science and Technology
Physics Modeling Simulation: Within the realm of science, AR can be employed to showcase simulations of intricate physical phenomena, such as the laws of motion, gravity, or wave interference.
Medical Training and Anatomy: In the healthcare domain, AR is harnessed to deliver interactive 3D anatomy simulations, enabling medical students or healthcare professionals to gain a deeper understanding of the body's structure.
Industry and Engineering
Assembly and Machine Maintenance: In manufacturing environments, AR can aid workers in assembling or maintaining machinery by offering step-by-step guidance on physical objects.
Design and Prototyping Simulation: Design and engineering teams can leverage AR to create and test product prototypes in a virtual setting before moving to physical production.
Real Estate and Interior Design
Virtual Property Tours: In the real estate sector, AR is employed to provide virtual property tours, allowing potential buyers to virtually explore rooms.
Virtual Furniture Arrangement: AR enables users to position virtual furniture in their space and visualize how the arrangement complements the interior design.
Gaming and Entertainment
AR Games: AR games, such as Pokémon GO seamlessly Integrate real-world aspects with virtual gaming features, resulting in a more immersive and interactive gaming experience.
Concerts and Entertainment Events: Within the entertainment industry, AR can be integrated to enhance visual effects during concerts or performances, creating memorable experiences.
Commerce and Marketing
Virtual Product Try-On: AR empowers consumers to virtually "try on" products, such as clothing or accessories, before making online purchases.
Interactive Advertising: Advertising campaigns leverage AR to offer interactive experiences to consumers, including scanning ad images for additional information or special offers.
Tourism and Mapping
Virtual Tour Guides: Within the tourism sector, AR serves as a virtual tour guide at historical or tourist locations, providing additional information as tourists explore the site.
Interactive Navigational Maps: AR map applications can assist users in navigating new cities or environments by displaying information about surrounding objects.
Health Virtual Surgical Simulations: Doctors and surgeons can utilize AR for virtual surgical simulations as a preparation step before actual procedures, contributing to improved accuracy and skills.
Medical Training Enhancement: AR is incorporated into medical training to provide supplementary information during medical procedures and to train clinical skills like blood sampling or intravenous placement.
2.2. Computational Thinking
CT in the realm of mathematics and science education denotes an individual's capacity to amalgamate components of problem-solving, logic, and algorithms, akin to the cognitive processes of computers. It encompasses a comprehension of how information can be structured, processed, and harnessed to formulate solutions or decisions. Regarding the
study of mathematics and science, CT may encompass the proficiency to devise a methodical approach to resolving mathematical or scientific quandaries. This involves delineating the problem, arranging information coherently, and formulating systematic steps to attain solutions (Acevedo-Borrega et al., 2022; Wang, Shen & Chao, 2022; Weintrop et al., 2016).
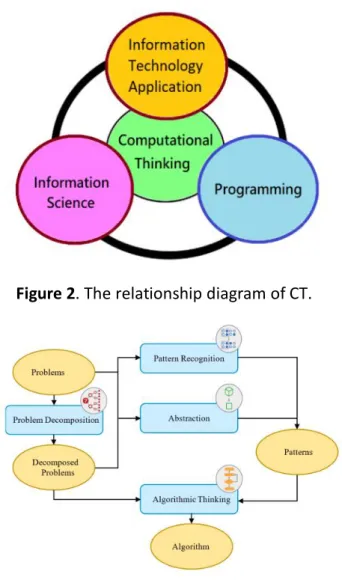
The relationship in diagram form (Huang et al., 2023) is presented in Figure 2.
CT encompasses the following aspects: (1) decomposition, i.e., the capacity to divide (complicated) data, breaking down processes, problems, or tasks into smaller components or manageable activities. Pattern recognition refers to the ability to identify similarities or distinctions in patterns, trends, and consistencies within data which will subsequently be employed in generating predictions and presenting data; (3) abstraction, i.e., generalizing and recognizing the universal principles that produce patterns, trends, and regularities; and (4) algorithm, which involves providing step-by-step troubleshooting instructions for others to use in addressing the same issue (Harimurti et al., 2019; Huang et al., 2023). Furthermore, these four aspects are presented in Figure 3.
Figure 2. The relationship diagram of CT.
Figure 3. The thought processes of CT.
In geometry education, CT plays a pivotal role by aiding students in honing critical thinking skills, surmounting challenges in comprehending geometric principles, and augmenting their grasp of the nexus between geometry and science. CT empowers students to visualize and comprehend geometric concepts more interactively and visually, encompassing alterations in object shapes and their interrelationships (Presser et al., 2023; Shin et al., 2022; McCormick
& Hall, 2021). Within the domain of geometry education, CT equips students to engage in
critical deliberation and grapple with intricate geometric predicaments. Furthermore, CT in geometry education facilitates students in discerning the interplay between geometry and science, particularly in the dynamics of physical systems involving alterations in form and structure. The process of learning geometry involves crafting algorithms and scrutinizing computational data, which are fundamental for nurturing proficiencies in the realms of technology and science.
2.3. Augmented Reality and Computational Thinking Research Trends
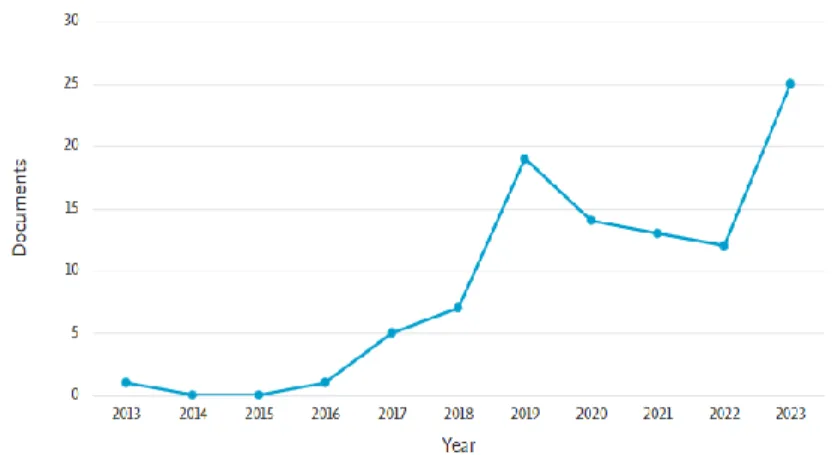
Analyzing research data on AR and Computer Tomography (CT) from 2013 to 2023 shows clear patterns and trends (Figure 4). Comprehensive instructions for utilizing bibliometric data are available in another location (Al Husaeni and Nandiyanto, 2022; Azizah et al., 2021). The following is an overview and analysis of the data (97 documents in Scopus): In 2013, there was one publication, indicating early interest or introduction to AR and CT in research. For the years 2014-2015, there were no publications recorded, possibly due to various factors such as a lack of attention or focus on the topic during that period.
Figure 4. AR and CT research trends.
Figure 4 shows that the emergence of one publication in 2016 signaled renewed interest, potentially contributing to the reinitiation of research in the field. In 2017, the number of publications increased to five, reflecting a growing interest and recognition of the significance of AR and Computer Tomography (CT) in the study literature. The growth trend continued in 2018, with seven publications, underscoring the increasing attention to this topic as a crucial research area. The year 2019 saw a significant spike with 19 publications, indicating substantial exploration and heightened interest in the field of AR and CT. Although there was a decrease in 2020 compared to the previous year, with 14 publications, the number remained high, suggesting sustained interest and research in this field. In 2021, there were 13 publications, maintaining relative stability and indicating the ongoing relevance of AR and CT as research focuses. Despite a slight decrease in 2022, with 12 publications, the number remained considerable, signifying sustained interest among researchers. The peak was observed in 2023 with 25 publications, highlighting the zenith of interest and research activities in this field. The data indicates a substantial increase in research interest related to AR and CT over the years. The surge in publications in 2019 may reflect advancements in technology and an improved understanding of the potential applications of AR and CT.
Despite fluctuations in some years, the overall trend suggests a sustained rise in interest and focus on this topic. The peak in 2023 may signify the ongoing growth of literature and the exploration of new concepts in AR and CT.
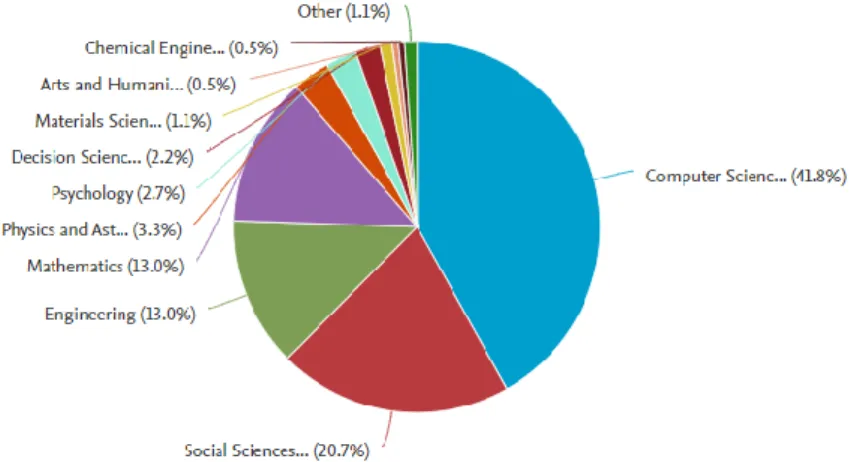
Figure 5 shows the description and analysis of AR and CT research data based on the subject area. Chemical Engineering = 1 publication: Having only one publication, the field of Chemical Engineering indicates a limited interest in implementing AR and CT in this domain.
Arts and Humanities = 1 publication: The solitary publication in Arts and Humanities implies that the integration of AR and CT in this field is still constrained and may not have garnered primary attention. Materials Science = 2 publications: Two publications in Materials Science suggest a slightly increased interest but still depict a relatively restricted application of AR and CT in this subject. Decision Sciences = 4 publications: The four publications in Decision Sciences signify an interest in applying AR and CT to decision-making processes. Psychology = 5 publications: With five publications in Psychology, there is an endeavor to comprehend the impact of AR and CT on psychological aspects. Physics and Astronomy = 6 publications: Having six publications, Physics and Astronomy display significant interest in deploying this technology in the realms of physics and astronomy. Mathematics = 24 publications: The substantial number of publications in Mathematics underscores the profound impact of AR and CT in the field of mathematics. Engineering = 24 publications: Matching the number of publications in Mathematics, Engineering suggests that AR and CT are extensively utilized in the engineering domain. Social Sciences = 38 publications: With 38 publications, Social Sciences emphasize the critical role played by AR and CT in the context of social sciences.
Computer Sciences = 77 publications: The abundance of publications in Computer Sciences highlights the dominance of AR and CT in the realms of computer science and information technology.
Figure 5. AR and CT research trends by subject area.
The dominance of Computer Sciences in terms of the number of publications indicates the substantial influence of AR and CT on the field of information technology. Mathematics and Engineering also exhibit significant contributions, reflecting the successful application of this technology in these fields. Certain areas, such as Chemical Engineering and Arts and Humanities, exhibit limited contributions, suggesting that the acceptance or adoption of AR and CT may not be widespread in those domains.
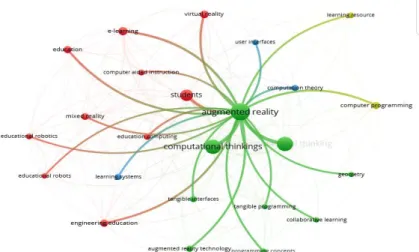
Figure 6 shows that the keywords "augmented reality" and "computational thinking"
highlight the central theme of this research. The largest circle emphasizes that both these concepts are pivotal to the research article. This underscores that the central topic of discussion revolves around the application of AR within the realm of CT. The inclusion of the keyword "student" specifically underscores a focus on students' learning experiences and their responses to the integration of AR to enhance CT skills. This indicates that the research doesn't solely concentrate on technical aspects but also delves into its impact on student
learning. The incorporation of these primary keywords in the largest circle underscores a distinct and unified emphasis on AR and CT. The presence of the keyword "student" signifies a comprehensive approach, taking into account various facets of students' learning experiences. This mirrors the research's recognition of technology's influence on student understanding and responses, encompassing not only technical dimensions but also educational and learning perspectives.
Figure 6. AR and CT research trends by VOSviewer.
2.4. The Relation Between Augmented Reality, Geometry and Science
Utilizing AR in geometry education can assist students in visualizing abstract concepts and gaining a deeper understanding. AR allows students to grasp geometric concepts, such as changes in object shapes, from diverse perspectives, enhancing their understanding of spatial concepts and spatial perception. AR can visualize geometry concepts, including points, lines, planes, and their relationships, aiding students in comprehending the structure and connections between geometric concepts. AR implemented on Android devices can serve as a three-dimensional learning tool for mathematics, enabling students to observe and understand geometric objects in three dimensions (Zhang et al., 2014). The integration of AR into learning media development, merging the real and virtual worlds, helps students grasp geometry concepts more visually and interactively. Consequently, AR enhances students' visual and interactive comprehension of geometry, fostering increased interest and engagement in learning (Peng & Ou, 2014; González, 2015; Gargrish, Mantri & Kaur 2020).
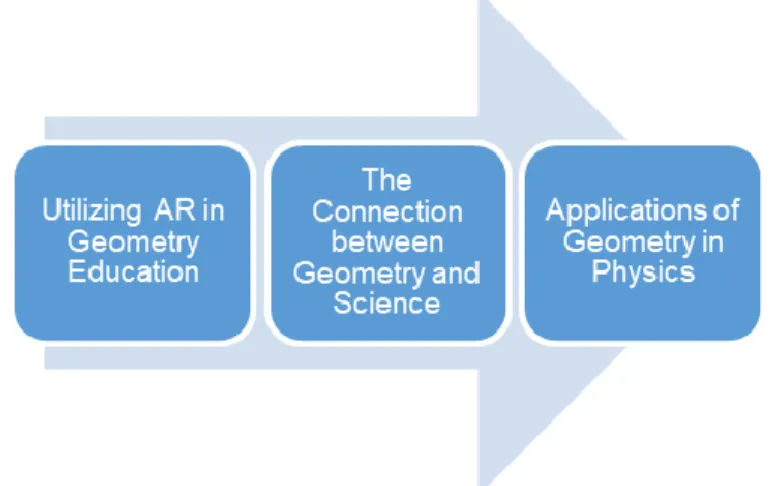
Figure 7. Relation between AR, geometry, and science.
The close connection between geometry and science is evident, with geometry being a branch of mathematics studying relationships within space, allowing an understanding of space through its fundamental characteristics. Modern geometry has strong links to physics, such as the relationship between pseudo-Riemannian geometry and physics. Geometry finds applications in various scientific fields, including mechanics, astronomy, crystallography, geodesy, aerodynamics, and navigation. In education, geometry serves as a tool to visualize scientific concepts like molecular structures and planets, and it is employed in developing science teaching materials using simple geometric media for middle school students. Thus, geometry and science are closely intertwined, with geometry acting as a tool to visualize scientific concepts and being utilized across diverse scientific fields (Liou et al., 2016; Yeh &
Liao, 2014).
Geometry's application in physics, especially in mathematical physics, is multifaceted.
Geometry aids in solving problems related to area, length, and volume measurement, crucial for depicting and understanding the behavior of physical systems. It is employed to measure physical bodies and discern the dominating properties when representing surrounding objects. Hyperbolic geometry, utilizing Euclidean geometry's theorems and axioms but substituting Euclidean parallelism postulates with hyperbolic parallelism postulates, finds applications in theoretical physics, notably in general relativity. Differential geometry applies calculus and linear algebra methods to analyze physics-related issues, such as the behavior of physical systems, econometrics, and bioinformatics. Algebraic geometry involves constructing mathematical objects and examining their relationships with known structures, with applications in physics, particularly in understanding the behavior of physical systems involving changes in shape and structure. Thus, geometry is an essential tool in physics for comprehending and predicting the behavior of physical systems and developing theories and methods in theoretical physics (Loizeau et al., 2011).
2.5. Benefits of Geometry in Science
The utilization of geometric techniques can be employed for reducing dimensionality with shape supervision when analyzing physical features through geometric moments. Geometry facilitates the extraction of visual information associated with the shape and structure of objects (Kumar & Taber, 2020; Thiagarajan & Shapiro, 2018). In the scientific realm, this may involve recognizing and scrutinizing geometric patterns linked to physical phenomena.
Dimensionality reduction serves as a method to simplify data while retaining crucial information. In this context, the incorporation of geometry aids in condensing the dimensions of intricate physical data into a more straightforward and easily understandable representation. Geometry allows for the identification of pertinent physical features within a system or object. The analysis of physical features might encompass the measurement and modeling of geometric properties that reflect specific physical characteristics. Geometric moments can offer profound insights into the distribution of mass or other physical properties within an object. This comprehension can serve as a foundation for subsequent analyses related to dynamics, kinematics, or other physical properties. Through the lens of geometry, a visual understanding of intricate physical phenomena can be amplified. Visualizing geometric shapes, distributions, and interactions supports scientists and researchers in envisioning and detailing complex physical processes (Jin, Xie & Xiao, 2019; Atrevi et al., 2017). Figure 8 show the benefits of geometry in science.
The application of geometry in dimensionality reduction can bolster the efficient optimization and modeling of physical data. This aids in crafting simpler yet still information- rich mathematical models for scientific analysis. Geometry emerges as an essential tool for
delineating, analyzing, and comprehending the shapes and physical features involving distributions in a given space (Taber et al., 2018; Khan et al., 2022; Khan et al., 2022).
Geometry aids in comprehending the concepts of kinetics and dynamics. Applying geometry concerning the motion and positioning of objects facilitates the construction of detailed models depicting how these objects interact and move within space. The application of geometry aids in visualizing physics concepts, assisting in planning and analyzing the outcomes of physics experiments, thereby bringing a systematic approach to data collection and interpretation (Marshall, 2013).
Figure 8. Benefits of geometry in science.
3. METHODS
3.1. Research Design
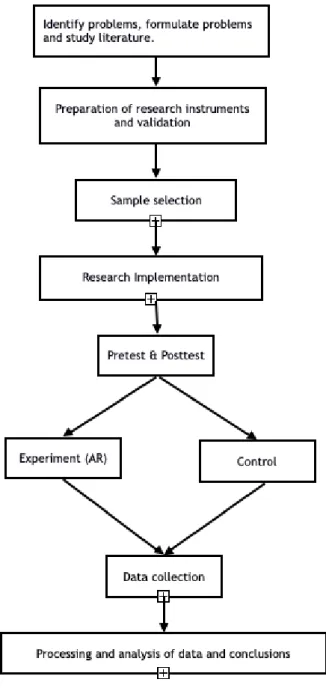
The study utilized a quasi-experimental methodology to examine the effectiveness of implementing learning using AR media compared to traditional teaching methods using PowerPoint media in enhancing students' CT abilities in the context of learning triangles and quadrilaterals. The study aimed to determine the success rate of applying AR media in enhancing CT skills. The research flow in Figure 9 describes the initial steps before researching until conclusions are obtained.
Figure 9 shows that the research process comprises the subsequent stages: Problem Identification, Problem Formulation, and Literature Review: In the initial stage, researchers pinpoint and articulate the research issue. They craft research inquiries and explicit hypotheses, followed by an exhaustive review of literature pertinent to the research domain.
Preparation of Research Instruments and Validation: This phase involves devising research tools. These tools then undergo a validation process to guarantee their dependability and validity in gauging the intended variables. Sample Selection: Researchers opt for a representative sample for the study. The selection procedure may encompass particular criteria to ensure that the chosen sample is apt for addressing the research questions.
Research Implementation: This stage involves executing the prepared research plan. The formulated methodology and protocols are put into action, and experiments or interventions are carried out based on the designs of the experimental and control groups. Pretest-Posttest conducted on experimental and control classes with participants in both groups undergoing pretests to set up a baseline. Following the intervention or experiment, posttests are administered to gauge the alterations or effects stemming from the applied treatment or intervention.
Figure 9. Research procedure.
Data Collection: Throughout and after the execution of the research, data is systematically collected. This may encompass diverse methods such as documentation, experiments, and interviews. Data Processing and Analysis, and Conclusions: The collected data undergoes processing and analysis using parametric statistical methods. The outcomes are elucidated, and conclusions are drawn based on the findings. This phase also encompasses a discourse on the ramifications of the results, the constraints of the study, and suggestions for future research. In summary, these stages furnish a methodical and systematic approach to executing research, ensuring lucidity in defining the problem, methodological precision, and the generation of meaningful conclusions.
3.2. Data collection and Participants
The research involved a total of 160 seventh-grade students randomly selected from four junior high schools in the Marpoyan Damai sub-district during the academic year 2022-2023.
The students were split into two groups: one received AR-based learning, while the other
received conventional Power Point-based instruction. The selection of students and schools was done randomly to ensure a representative sample. Before the treatment, All students participated in a pre-test to evaluate their first CT skills. This enabled us to set a standard for comparison. After the treatment, both groups took a post-test to assess their final cognitive performance following the therapies.
The subjects in the study were 12-13 years old, taught by the same teachers, and provided with the same learning materials and practice questions. They had equal learning opportunities from the teacher. The experimental group received instruction using AR media, while the comparison group used PowerPoint media. Both interventions aimed to enhance students' CT skills. The study consisted of six sessions, with each session lasting 2 x 45 minutes, including the pretest and posttest. The CT ability test was utilized instrument for data collection. The test was validated by experts and lecturers to ensure its validity and reliability in measuring CT skills. The validation process involved reviewing the test items for relevance, clarity, and alignment with the intended learning outcomes. Table 3 shows questions/problems included in the instrument used to measure students' CT abilities.
Overall, the study used a quasi-experimental design with pre-test and post-test measurements. The devices utilized were the CT ability test, which was validated by specialists, to evaluate pupils' talents. The research process included carrying out interventions throughout six sessions and assessing the data using t-test values to assess the impact of AR media on improving CT skills. Comprehensive instructions for utilizing the t-test are provided at another location (Afifah et al., 2022; Fiandini et al., 2024).
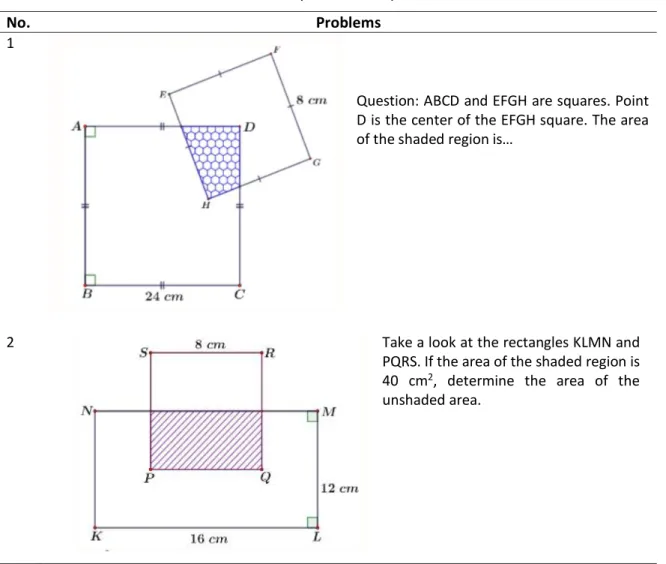
Table 3. Description of the problems.
No. Problems
1
Question: ABCD and EFGH are squares. Point D is the center of the EFGH square. The area of the shaded region is…
2 Take a look at the rectangles KLMN and
PQRS. If the area of the shaded region is 40 cm2, determine the area of the unshaded area.
3.3. Data Analysis
Data processing was performed using the post-test scores and t-test results. The researchers examined the data to assess the influence of the AR intervention on students' CT skills, in comparison to traditional PowerPoint-based teaching. A t-test was utilized to evaluate the statistical significance of the disparities in the post-test results between the two groups.
4. RESULTS AND DISCUSSION
This study intends to determine the efficacy of utilizing AR media to improve the CT skills of seventh-grade students, especially on flat shapes (triangles and quadrilaterals). Before this research was carried out, we gave pre-test questions to 160 students to find out their initial abilities concerning triangles and quadrilaterals (see Table 3).
Table 3 describes the statistical parameters of two student groups, the experimental and the control groups before any interventions or treatments are applied. There were 80 pupils in each group. The average pretest score for the experimental group was 21.67, while for the control group it was 20.26. The average pretest scores reflect the students' baseline level of understanding before receiving any treatment. Standard deviation measures the dispersion of data points from the mean. The experimental group had a standard deviation of 6.45, whereas the control group had a standard deviation of 6.04. Increased standard deviation indicates more variability in the data. Both the experimental and control groups reached a maximum score of 35.
The information provides an initial insight into the students' characteristics before the research began, forming a basis for assessing the changes or impacts caused by a therapy or intervention during the study. Table 3 Indicates that there was no significant difference between the students who used AR media for studying (experimental group) and those who used conventional methods (control group). The minimum score in the experimental group was 15, surpassing the score in the control class of 10. Statistical tests were conducted to verify that both groups originated from regularly distributed populations, assessing normality, homogeneity, and t-test outcomes.
Table 3. Pre-test data.
Descriptive Statistics Control Experiment (AR)
N 80 80
Means 20.26 21.67
Sd 6.04 6.45
Max 35 35
Min 10 15
Table 4 shows the results of normality and homogeneity tests for two groups: the experimental class and the control class. The experimental class's normality test shows a significance value of 0.25, whereas the control class's normality test shows a significance value of 0.28. The findings indicate that the data distribution in both groups is not remarkable and does not deviate significantly from a normal distribution. In other words, the data in both groups can be seen as originating from a population that follows a normal distribution. The homogeneity test between the experimental and control classes has a significance value of 0.33. A significance value of 0.33 suggests that the difference in variances between the experimental and control classes is not statistically significant. Put simply, it can be assumed that the variations in both groups are similar or homogeneous.
Table 4 The significance values of the two groups were greater than 5%, suggesting that the populations from which the groups were sampled had a normal distribution. A homogeneity test was performed, and the significance level exceeded 5%. This suggests that the two groups were similar. The average similarity between the two groups was assessed.
The t-test yielded a significance value of 0.23, which is greater than 5%, suggesting that there was no significant difference in the averages of the two groups. This corroborates the previously mentioned descriptive data, indicating that there was no notable disparity in the early capabilities of the two groups. The researcher assessed the impact of using AR media on improving students' CT skills by conducting a final test following four consecutive sessions on triangles and quadrilaterals.
Table 4. Pre-test normality, homogeneity, and t-test results.
Kolmogorov-Smirnov Test
Levene Test T-test Criteria Control Experiment (AR)
N 80 80 160 160
H0 accepted
Sig. 0.28 0.25 0.33 0.23
Table 5 depicts the results of the posttest given to two separate groups: the experimental group and the control group. The mean score of the experimental group is 81.67, while the control group has an average score of 60.26. The standard deviation of posttest scores is 5.94 in the experimental group and 5.24 in the control group. The experimental group achieved a maximum score of 100, whereas the control group's best score was 70. In contrast, the experimental group's lowest score is 62, and the control group's lowest score is 15. The posttest results show that the experimental group had a higher average score, a smaller standard deviation, and a wider range of values compared to the control group. This suggests that the intervention or treatment given to the experimental group positively impacted their posttest results more than the control group. Table 5 shows that the experimental group exhibited considerably enhanced CT abilities compared to the control group post-therapy, despite both groups having identical abilities at the beginning. The highest score in the experimental group was significantly higher than that of the control group, while the lowest score in the experimental group was only slightly lower than the highest score in the control group. Assumption and average difference tests were conducted to ensure the effectiveness of incorporating AR media in learning.
Table 5. Post-test data.
Descriptive Statistics Control Experiment (AR)
N 80 80
Means 60.26 81.67
Sd 5.24 5.94
Max 70 100
Min 15 62
Table 6 reports the results of normality and homogeneity tests for the experimental group and the control group. The normality test indicates a significant result of 0.27 for the experimental group and 0.17 for the control group. The findings indicate that the data distribution in both classes is not significant or does not significantly vary from a normal distribution. Put simply, the data in both classes can be considered to come from a population that follows a normal distribution. The homogeneity test between the experimental and control classes indicates a statistically significant difference with a reported value of 0.42. A
significance value of 0.42 indicates that the difference in variances between the experimental group and the control group is not statistically significant. Therefore, it can be deduced that the differences in variances across both classes are very similar or homogeneous. Table 6 the significant values of the two groups were larger than 5%, suggesting that the two groups originated from populations with a normal distribution. A homogeneity test was run, and the significance value was more than 5%, suggesting that the two groups were homogeneous.
The average similarity of the two groups was then calculated. The data demonstrates that the significance value of the t-test was less than 5%, suggesting a significant difference in the means of the two groups. The use of AR media effectively improved the seventh graders' CT skills, particularly in the areas of triangles and quadrilaterals.
Table 7 displays samples of students' responses to the CT abilities test. The findings from responses and interviews highlight the importance of recognizing the interrelatedness between grasping geometric concepts, CT, and mental representations when solving mathematical problems. Within mathematical ideas, students demonstrate their understanding of CT by grasping the mathematical connection among the shaded area, square, and rectangle. The initial mistake was promptly corrected with precision, demonstrating pupils' adeptness in applying algebra to solve mathematical difficulties.
Table 6. Post-test normality, homogeneity, and t-test results.
Kolmogorov-Smirnov Test
Levene Test T-test Criteria Control Experiment (AR)
N 80 80 160 160
H0 rejected
Sig. 0.17 0.27 0.42 0.00
Table 7. Students’ answers to the CT abilities test.
No. Students’ Answers
1.
Translate: The area of the shaded region is 16 cm Data Interview
Below are the outcomes of interviews conducted by researchers (R) with students (S) regarding student test responses:
R: What information can you find out from the questions above?
S: Based on the above problem, it is known that the length of the side of the square EFGH is 8 cm and the length of the side of the square ABCD is 24 cm. Then you are asked to determine the area of the shaded region.
R: How do you determine the area of the shaded region?
S: I first determined the area of square EFGH as 64 cm2, and then divided it by 4. The area of the darkened zone is 16 cm2.
R: Why do you have to divide the area of the EFGH square by 4?
S: I'm trying to imagine that if the EFGH square is rotated a bit then the points of the shaded area will be exactly 1/4 of the area of the EFGH square.
R: Very good.
Table 7 (Continue). Students’ answers to the CT abilities test.
No. Students’ Answers
Description
The responses and interviews with students reveal a strong understanding of geometric problems and CT. In the initial response, the student adeptly identified key information from the problem, specifically the side length of square EFGH being 8 cm and the side length of square ABCD being 24 cm. The objective was to calculate the area of the shaded zone. The student's method of determining the area of the shaded zone showcases a strong understanding of geometric fundamentals. By initially calculating the area of square EFGH (64 cm²) and then dividing it by 4, the student successfully arrived at the area of the shaded region as 16 cm². When asked about the rationale for dividing the area of square EFGH by 4, the student provided a clear explanation. Visualizing the potential rotation of square EFGH, the student correctly deduced that the points of the shaded area would precisely cover 1/4 of the total area of square EFGH. The student's explanation reflects well-integrated CT, where the student endeavors to visualize and model the solution visually. The concept of rotating square EFGH to comprehend the area of the shaded region exemplifies CT, as the student utilizes mental representations to simplify geometric problems. Commendation from the researcher indicates recognition for the student's thoughtful and accurate solution, reinforcing the understanding of concepts and their application in the realm of computational geometry.
2. Students’ Answer:
Translate: The area of the unshaded region is 216 cm Data interview:
The following are the results of interviews between researchers (R) and students (S) regarding student test answers:
R: What information can you find out from the questions above?
S: The square PQRS has a side length of 8 cm, while the rectangle KLMN has a side length of 16 cm and a width of 12 cm. Next, they are required to calculate the area of the zone that is not shaded.
R: How can the area of the unshaded zone be calculated?
S: I first determined the area of square PQRS as 64 cm2, and then computed the area of rectangle KLMN as 192 cm2. The overall area is calculated as 192 + 64, which is 256.
Subtracting 40 from 256 gives a final area of 216 cm2.
Are you confident in the accuracy of your response?
S: I am confident that my answer is accurate.
R: Is the shaded area a subset of the square's area, the rectangle's area, or both?S: The area of the shaded region is both the area of the square and the area of the rectangle
R: Then are you sure your answer is correct?
S: I think I was wrong, I should have subtracted 256 - 40 - 40 = 176, so the area of the unshaded region is 176 cm2
R: Very good.