The first part contains chapters dealing with the new and rapidly growing role played by the Internet and e-commerce in supply chain management. Finally, the third part focuses on models and applications for supply chain planning and design.
SUPPLY CHAIN INTEGRATION OVER THE INTERNET
- Introduction
- Cross-docking Information Flows
- Three Classes of e-Business Applications
- e-Commerce
- e-Procurement
- e-Collaboration
- e-Commerce
- e-Procurement
- e-Collaboration
- Implementation Issues
- The Future Trend - It’s Intelligence
- Conclusion
The information hub could be a website or a central server on the Internet running a supply chain ERP system. Now we move on to a full discussion of e-business supporting supply chain integration over the Internet.
Acknowledgments
Despite these disappointments, the coming years will see an explosion of e-Business applications as visionary companies develop new paradigms for the future. Visionary companies such as Cisco and numerous start-ups have already shown many opportunities in the field of e-business.
CUSTOMER SERVICE MODELS FOR BRICKS, CLICKS AND IN BETWEEN
Stockout Types
1 Lost Sale (LS) the desired item is not available and the buyer leaves the system unsatisfied;. 3 Buyer Substitution (BS) the desired product is not available and the buyer chooses an alternative product;.
Impact of Channels on Stockout Cost and Likelihood
- General Cost Issues
- Lost Sales Across Channels
- Backorders Across Channels
- Buyer Substitution Across Channels
- Seller Substitution Across Channels
This means that while the buyer's replacement inventory cost is low, the probability of such replacement is also low. The probability of seller substitution with BCS is lower as the buyer can easily order the goods.
Customer Service Model Implications 1 Inventory “Coverage” for a Bricks and
In almost all cases, the customer will be more satisfied with vendor replacement than with backorders, meaning the goodwill cost is lower for vendor replacement. Seller replacement is most likely with BRK as the buyer can demand instant gratification.
Clicks retailer
Using Customer Information
It is possible that the online merchant (CLK or BCO) would have information about the location of the online buyer. Any failure in service would very likely cause the customer to defect to a retailer with a local presence.
Remarks and Conclusions
Both practitioners and researchers should be aware of the implications of these different types of inventories. Simple order-to and reorder point systems may not be sufficient to describe optimal inventory behavior when the role of the store is both a stock location and a service/product demonstration center.
B2B MARKETS: PROCUREMENT
AND SUPPLIER RISK MANAGEMENT IN E-BUSINESS
Scope and Definition of B2B E-Commerce
Business-to-business markets are platforms on which B2B e-commerce may be conducted directly between buyer and seller or
- B2B E-Commerce: Sources of Efficiency
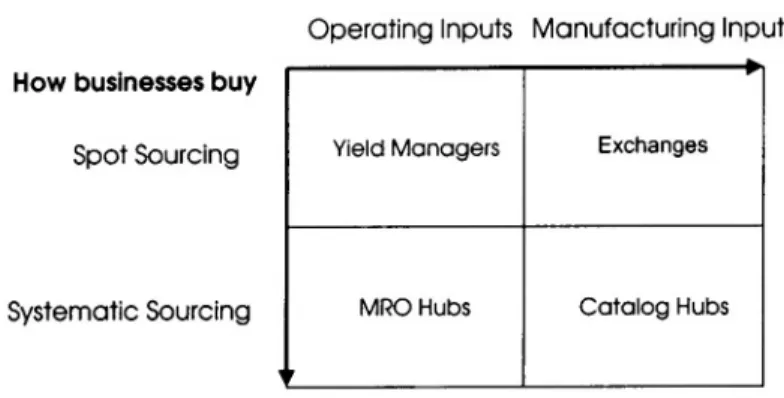
- Framework for B2B E-Commerce
- Private Marketplaces
- Catalog Hubs
- Spot markets
- Characteristics of Markets Participating in B2B E-Commerce
- Quantitative Models for B2B E-Commerce
- Traditional Supply Contract Literature (Focus: Private Marketplaces)
- Simulation based Supply Contracts, Applied to a Private Market, and a Spot Market
- Supplier Procurement Risk Management
The elements that dominate are the uncertain prices of the spot market compared to fixed investments. If a long-term contract is selected at any point in the horizon, it is valid until the end of the horizon.
We should note that we could relax the last assumption related to from being constant (of value to just being non-
Since we consider the optimal mix with respect to the expected value of purchase costs, it is sufficient to consider that the spot market is. As K increases, the (expected) amount paid to the long-term supplier increases, while the amount spent in the spot market in anticipation decreases.
Let K* be the optimal value of K that minimizes (3.2) and
We now describe a set of results that indicate that the spot market is valuable under fairly general conditions, and also characterize the values of the (optimal) contracted capacity K. Second, (3.5) basically says that the spot market is somehow more expensive than the long-term contract.
By concluding that K* never takes on one of the extreme points of the domain, Theorem 3.6 demonstrates that for a wide range of
Before giving an intuitive interpretation of the previous main result, we will note two things. The first one is equivalent to saying that the expected marginal cost of procurement from the spot market is greater than the minimum long-run procurement cost. The second condition means that it is cheaper for one to choose the long-term contract as the only means of supply than to use the spot market exclusively.
The intuition behind the result of Theorem 3.6 (as illus- trated in Figure 3.6) is that the realizations of the higher demand values
Fortunately, by solving the problem numerically, we can see that for reasonable spot market prices, K* assumes values close to the average, and in some cases, when the spot market is not too expensive, even less than the demand average. In addition, we assume that a single spot price per unit applies regardless of the number of units ordered.
The main benefit of Theorem 3.9 is to reduce the compu- tational complexity necessary to determine the optimal level of capacity
- Outlook and Conclusions
The coexistence of the spot market and the traditional forward contracts is another implicit conclusion in this analysis. An initial analysis would indicate that the supplier will have access to more customers in the spot markets and therefore one would expect better management of their capacity due to the diversification of demand. One of the main differences with regard to financial instruments is that the (perceived) value of contracts and B2B spot markets depends on the demand distribution of the buyer, as well as how important the part is to the buyer - information known only to the buyer. buyer himself (or not at all).
SUPPLY CHAIN COORDINATION MOD- ELS AND APPLICATIONS
MANAGING DEMAND UNCERTAINTY FOR SHORT LIFE CYCLE PRODUCTS
Literature Review
To our knowledge, Weng and Parlar (1999) is the first chapter to present a model in which the retailer offers a price discount to induce customers to make their purchases before the start of the sales season. Third, we consider the case where the retailer would use the predetermined orders to update the probability distribution of residual demand during the season, while Weng and Parlar do not model the forecast update problem. Finally, while Weng and Parlar focus on determining the optimal order quantity and discount rate, our focus is on exploring the benefits of the ABD program.
The Analysis Framework
- The Base model
- The Advance Booking Discount Model
- No Demand Forecast Updating. Consider the case when the retailer offers the ABD program with the discount factor
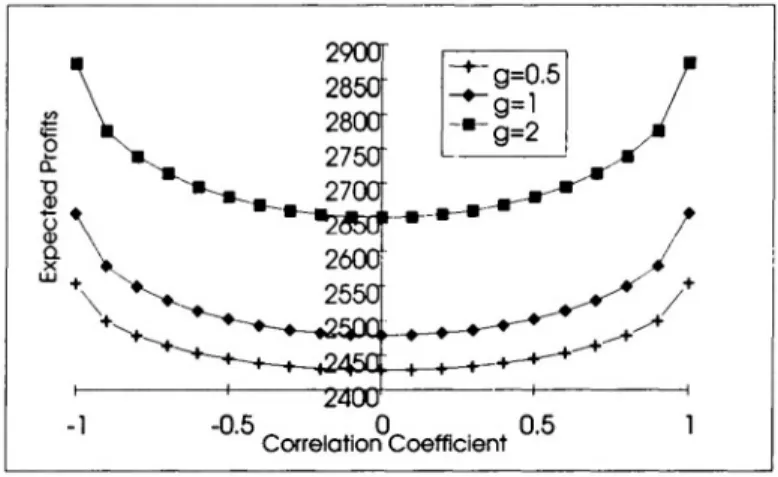
First, notice from (4.8) that the ABD program will thus reduce the variance of demand during the marketing year. Consider the case where the retailer offers the ABD program and uses the predetermined orders to update the distribution of, in this case, the profits. Overall, the ABD program allows the retailer to increase expected profit by increasing sales and reducing demand variation.
The Optimal Discount Factor
- No Demand Forecast Updating
- Demand Forecast Updating
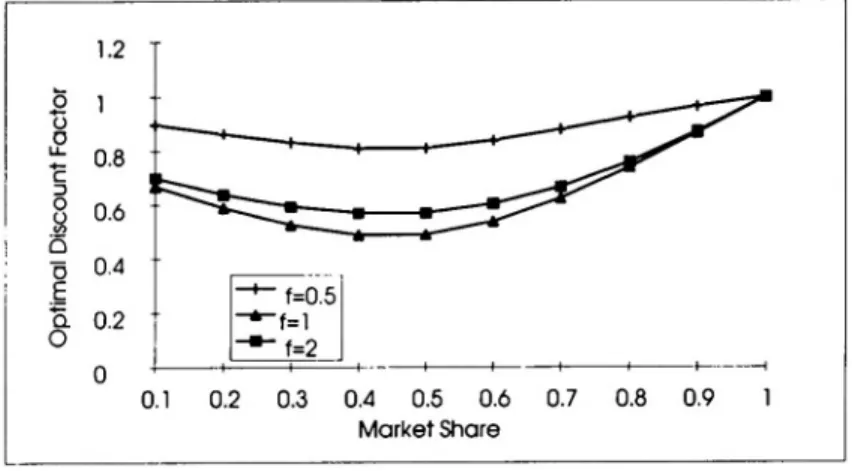
To examine the effect of on we vary from 0.1 to 5, so that the first statement in Proposition 4.5 thus implies that is decreasing in This result is illustrated in Figure 4.2. To examine the effect of on we vary from 0.1 to 5, so that the first statement in Proposition 4.8 thus implies that is decreasing in This result is illustrated in Figure 4.6. Combining this observation with the fact that the first statement in Theorem 4.8 implies that is increasing in this result.
Non-identical Market Response Functions
- Uncorrelated Demands
- Correlated Demands
Finally, we compare the optimal discount factor for the no-update case (Figure 4.2) and the optimal discount factor for the update case (Figure 4.6). Basically, Figure 4.9 reports that, as demand becomes inelastic (that is, as it increases), it is optimal for the retailer to offer a lower discounted price to induce more customers to pre-order selling season. Also, Figure 4.11 suggests that as it increases, it is beneficial for the seller to offer a lower discounted price.
Concluding Remarks
This is because more Brand B customers switch to Brand A under the ABD program.
Appendix
Proof of Lemma 4.6 Since the term and the function are analogous to and we can use the same approach presented in the proof of Lemma 2 to prove Lemma 4.6. In this case, we can use the same approach proposed in the proof of Theorem 4.4 to prove Theorem 4.7. Proof of Lemma A.2 Since the term and the function are analogous to and we can use the same approach as presented in the proof of Lemma A.1 to prove Lemma A.2. We omit the details.
PARTIAL QUICK RESPONSE POLICIES IN A SUPPLY CHAIN
- Introduction and Related Literature
- Partial Fulfillment Model
- Manufacturer controls only the Reorder Fulfillment Rate
- a) M(Q) is convex (concave) if and only if is convex (concave)
- a) If demand is exponentially distributed so that then M(Q) is convex. For any pair of wholesale prices
- Offering Re-Stocking as a Benefit to Retailers
- a) If demand is exponentially distributed with parameter then the manufacturer’s optimal restocking policy is to set and
- The Role of Re-stocking in Channel Coordination
- Numerical Analysis
- Conclusions and Extensions
The manufacturer then produces a fraction of the total amount withheld by all the retailers. We assume that the manufacturer fills the fraction of all reorders in a way that is perceived as random by the retailers. As a result, the manufacturer will tend to charge a higher wholesale price than would be optimal from the channel's perspective.
USING REVENUE SHARING TO ACHIEVE CHANNEL COORDINATION FOR A
NEWSBOY TYPE INVENTORY MODEL
Optimal Strategies When the Vendor’s Available Funds Are Unlimited
However, if the seller orders the item from the manufacturer on a consignment basis, the seller would do so. The seller's cost per unit is higher if he buys the item than if he gets it on consignment.). The seller's cost per unit to purchase the item is greater than its resale value).
Using Revenue Sharing to Achieve Channel Coordination
We also assume that the purchase price and the seller's sale price in a direct purchase do not change as a result of the manufacturer offering the good through revenue sharing. Instead, channel coordination is achieved by the manufacturer selecting the appropriate values for and under a revenue sharing plan. We make this assumption because the manufacturer may have multiple means of distribution, not all of which would be subject to a potential revenue sharing arrangement.
If the manufacturer wishes to achieve channel coordina- tion then it will be necessary to set
- Conclusion
B, 0 elsewhere, and examine the effect that the manufacturer's choice of p2 has on his expected profit. In this case, without revenue sharing, the seller's optimal order quantity would be the seller's expected profit of $1,785, and the resulting profit for the manufacturer would be $1,540. Using these values, the manufacturer's expected profit would increase to $1586.67 and the seller's expected profit would increase to $1,878.33.
SUPPLY CHAIN CONTRACTING AND COORDINATION WITH SHELF-SPACE-
A Manufacturer and Single Retailer Supply Chain
- The Model and Centralized Control
- Price-Only Contract
- Price-Plus-Inventory-Subsidy Contract
- Non-Linear Holding Costs
For simplicity, we assume that the producer and the retailer have an opportunity cost of zero. We derive the retailer's optimal inventory decision and discuss whether and how the manufacturer can coordinate the supply chain. Note that the manufacturer will need to have information about the retailer's demand function (as well as its holding cost function) in order to offer a matching contract.
Two Competitive Retailers with Demand a Function of Aggregate Inventory
The optimal total inventory will be the same as when one of the retailers is the only one operating in the given market. But from Proposition 7.6 we know that the total inventory of two retailers (regardless of inventory allocation between them) that maximizes the system-wide performance will be the same as that which maximizes the performance of a system with a single retailer. Second, for a given wholesale price, the two-retailer supply chain needs a smaller inventory subsidy to be coordinated than the single-retailer chain does.
Two Competing Retailers with Demand a Function of Individual Inventory
The difference is that a customer who chooses, say, R1, will contribute demand as long as it was in it. Thus, the total requirements in the two scenarios are different even if the inventory levels are the same. Rather than attempt to fully describe the response curves and equilibrium points, in what follows we simply identify one specific equilibrium—the symmetric equilibrium where two retailers hold the same amount of inventory. Since the two retailers are equal, the most likely equilibrium, if any, should be symmetric.
- Concluding Remarks
Zemel (1999) "Studie van gedecentraliseerde distributiesystemen: deel II - toepassing", werkdocument, Kellogg Graduate School of Management, Northwestern University, Evanston, IL. Hoe vraagprognoses in een toeleveringsketen te delen”, Working Paper, The Fuqua School of Business, Duke University. Wang (1994) "Periodic-Review Inventory Models with Inventory-Level-Dependent Demand", Naval Research Logistics Supply Contract for a Short-Life-Cycle Product with Demand Uncertainty and Asymmetric Cost Information", Working Paper, Yale School of Management.
SAM: A DECISION SUPPORT SYSTEM FOR RETAIL SUPPLY CHAIN PLANNING
Literature Review
Ours is selected from a simple region defined by various constraints that explicitly represent the characteristics of the business relationship between the retailer and each vendor. 1997), the authors use a probability structure similar to that in Eppen et al. 1989), with a single-plant manufacturing environment much simpler than ours. Capacity planning is not addressed and the nuances of managing a supply chain consisting of several independently managed physical nodes are not included in their formulation. 1991) describes a software application called "The Sourcing Simulator" developed by researchers at North Carolina State University in collaboration with the Textile/Clothing Technology Corporation and the American Textile Partnership-Demand Activated Manufacturing Architecture (AM-TEX-DAMA). Nevertheless, various studies based on this model (Hunter et al. 1996 and King and Hunter (1996)) have confirmed the importance of the ability to respond to improved demand information, which is a key rationale for the acquisition strategies we model.
Model Specification
- Timeline of Events and Information Assumptions
- Decision Variable Definitions
- Inventory Balance Equations and Production Constraints
- Modeling Product Demand
- Calculating Unit Sales
- The Objective Function
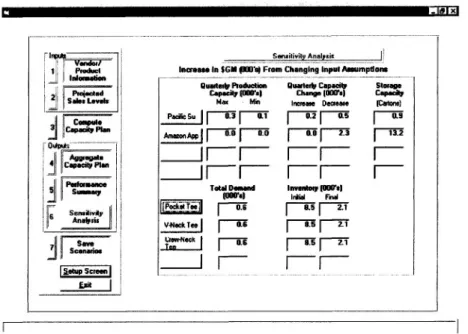
- Model Extensions for Sensitivity Analysis
- Positioning This Model in the Retailer’s Planning Process
We define the following probability distributions to describe the probability of observing specific sequences of demand information:. for each possible value at time. for every possible combination of and. the joint probability of and. 11Retailers typically track the "sell-through" rate, that is, the fraction of the beginning inventory that is sold in each period. For a seasonal item, this corresponds to the unit value of this product in the next selling season (ie the avoided replacement cost minus any holding costs).
The Decision Support System
- Graphical User Interface
- User Experiences with the DSS
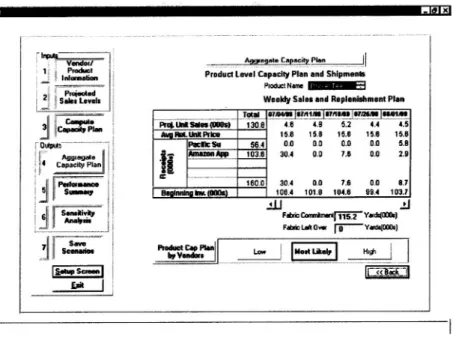
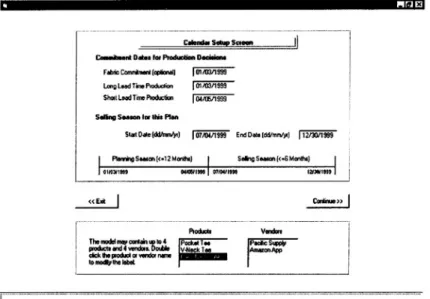
Clicking the column heading button on the Figure 8.6 screen brings up the vendor information shown in Figure 8.7. Clicking the row title button on the Figure 8.6 screen opens the product information screen shown in Figure 8.9. The percentage change entered here for the product captures the uncertainty in demand for it ie. the extent to which projections of demand for that product could change between t0 and t1.
Conclusion
In mathematical terms, each group typically perceives a different segment of the overall objective function.). Due to the many types of manufacturing and sales constraints that can apply in a retail environment, ease of use is essential to the practicality of a decision support tool. The authors are grateful to the corporate sponsors of the Retail Workbench at Santa Clara University for their financial support, for proposing the business problem, and for their comments and suggestions during this research.