Lattice parameters obtained indicate that the solubility of yttrium in barium zirconate is at least 40 mol. To simplify processing procedures, the influence of transition metal oxide additives (especially zinc oxide) on the densification and electrical properties of doped barium zirconate was investigated.
Equilibrium constant as a function of time The internal conductivity of the grain in the BYZ system with varying dopant concentration..4-22 5.1. The mass, total grain boundary and specific grain boundary conductivity of BYZ-Zn4 as a function of temperature plotted in Arrhenius form.
List of Tables
Introduction and Background
- Structure and Defect Chemistry of Doped Barium Zirconate .1 Perovskite Structure
- Electrochemical Applications
- Electrical Characterization .1 Impedance Spectroscopy
- Motivations and Objectives
- References
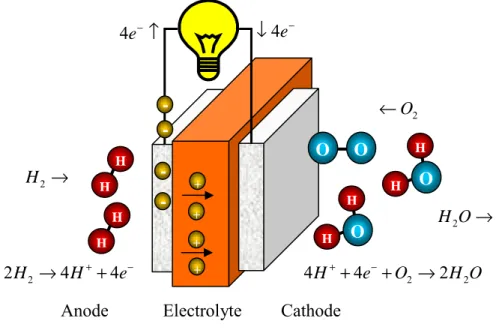
The voltage (signal) arises due to the difference in activity (or molar concentration) of hydrogen between the two sides of the proton-conducting electrolyte. As a result, the capacity ratio is equal to the ratio of the grain boundary thickness, δ, to the average grain size, D.
Experimental Methods
- Synthesis and Processing of Powders .1 Synthesis Methods
- Characterization Techniques
- Cell Fabrication
- References
The ionic transport number was estimated from the ratio of the measured potential to the calculated Nernstian value,
Processing of Yttrium-doped Barium Zirconate for High Proton Conductivity
- Introduction
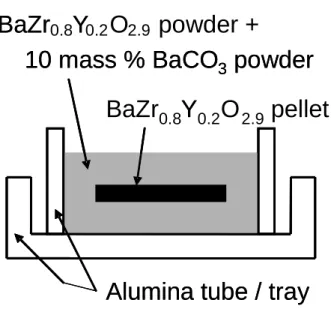
- Processing methodology
- Densification, Phase Formation, and Stoichiometry
- Conductivity of BYZ by impedance spectroscopy
- Conclusions
- References
- Introduction
- Influence of Grain Size on the Electrical Conductivity .1 Microstructural Evaluation
- Dopant Concentration
- Conclusions
- References
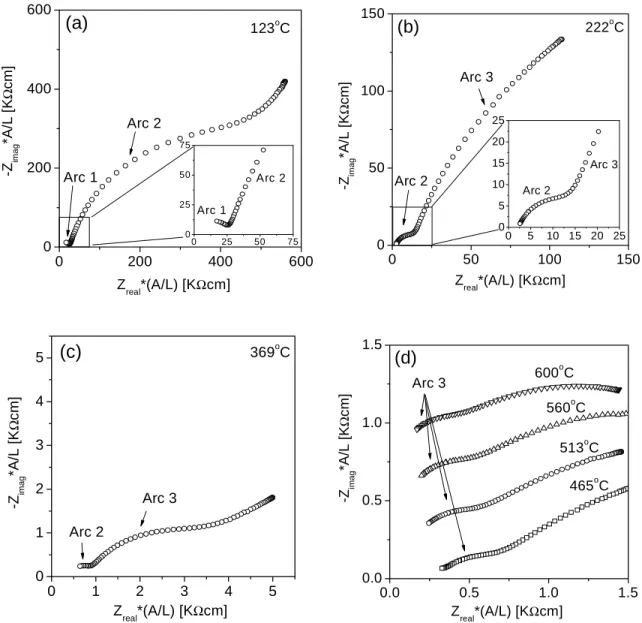
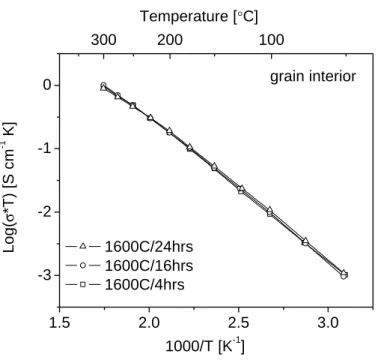
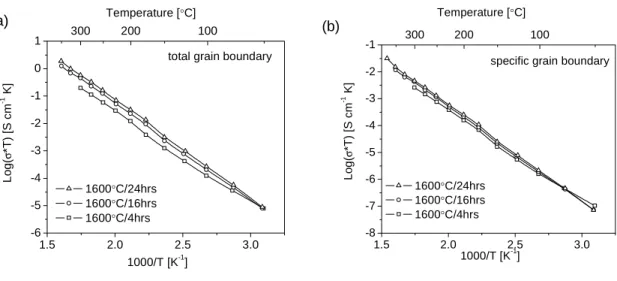
Assuming that the true dielectric constant of the grain boundaries and the bulk (grain interior) are comparable, then the ratio of the apparent capacitances, Cgb/Cgi, is simply equal to the ratio of the grain diameter, D, to the grain. boundary thickness, δ (Chapter 1). As revealed by comparing Figures 3.8 a and 3.8 b, the specific grain boundary conductivity of BYZ20 is much lower than that of the bulk. Reasons for such a dramatic effect of barium loss on conductivity may be (1) the precipitation of yttria from the perovskite structure producing the non-conductive BaZrO3 and (2) the accumulation of yttria impurities in the grain boundary regions.
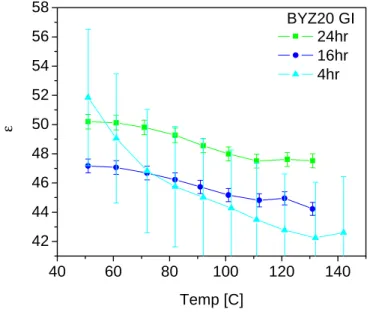
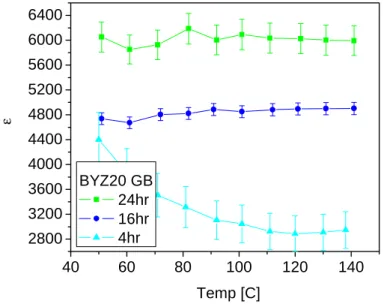
With a fixed characteristic frequency (depending only on the material properties), w0=1/(RC), for the grain boundary response, an increase in total resistance results in a decrease in capacitance. The higher error bars in the 4 h sintered sample are a result of the higher grain boundary density. At first glance, the dielectric constant of the grain boundary appears to be 2 orders of magnitude greater than the grain interior.
Effective grain boundary dielectric constant in BYZ20 (Ag electrodes in wet nitrogen, PH20=0.03 atm). A lack of oxygen vacancies has been suggested as one of the causes of grain boundary blocking effects. Furthermore, an unexpected result was an intrinsic improvement in grain boundary properties with increased sintering times.
Enhanced Sintering of Yttrium doped Barium Zirconate by addition of ZnO
- Introduction
- Preliminary comparison of transition-metal modifiers
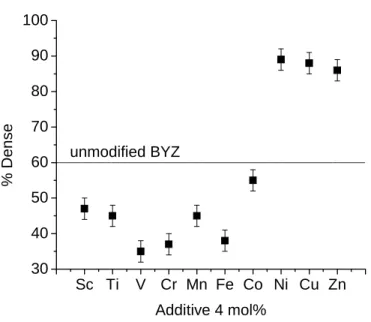
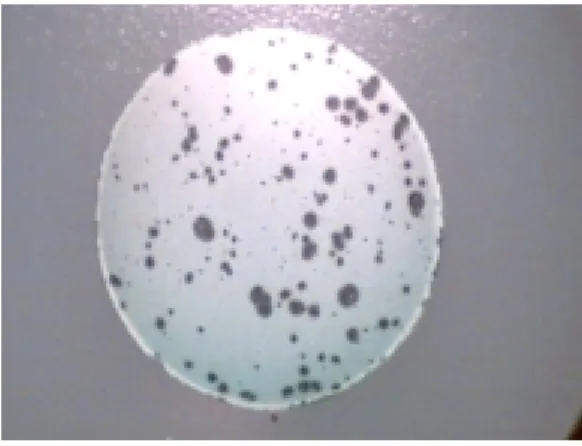
Preliminary screening experiments for modifiers were performed by mechanically adding 4 mol% of the transition metal oxide (Alfa Aesar purity) to the BaZr0.85Y0.15O3-δ. Densities obtained from 4 mol% transition metal modified BYZ samples, sintered at 1300 °C with a soak time of 4 hours, are shown in Figure 5.1. As shown in the data, Ni, Cu and Zn are extremely effective in improving densification, increasing the final density from approximately 60% of the theoretical value for the unmodified material to approximately 86%-88% for modified BYZ.
X-ray powder diffraction of vanadium and chromium combined with BYZ showed the presence of second phases, which is contributing to the densification deterioration. However, upon closer examination under SEM, Figure 5.3, the Cu modified sample showed the presence of Ba2YCu3Ox. Furthermore, both this material and the Ni-modified BYZ pellet changed color from white to black during sintering.
Often black coloring in an oxide indicates significant electronic conductivity, and although the concentration of the transition metal in these samples is low, indicating that the electronic transfer number would not be large, Cu and Ni were abandoned as modifiers in favor of Zn.
YCu 3 Ox
- Chemical Analysis
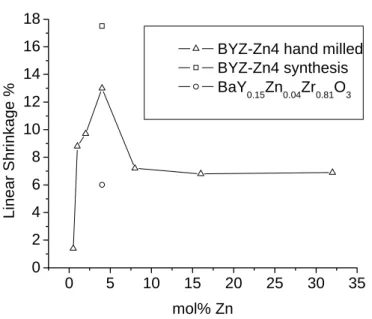
The first involved dissolving zinc nitrate (Alfa Aesar, 99% purity) directly into the BYZ nitrate solution described above, the stoichiometry being adjusted to incorporate Zn into the B site of the perovskite (BaY0.15Zn0.04Zr0.81O3-δ). With the latter technique, the stoichiometry of the BYZ base materials was not adjusted to accommodate ZnO. Of the three BYZ-Zn4 samples, densification is greatest for ZnO introduced as a dispersed oxide in the BYZ nitrate solution.
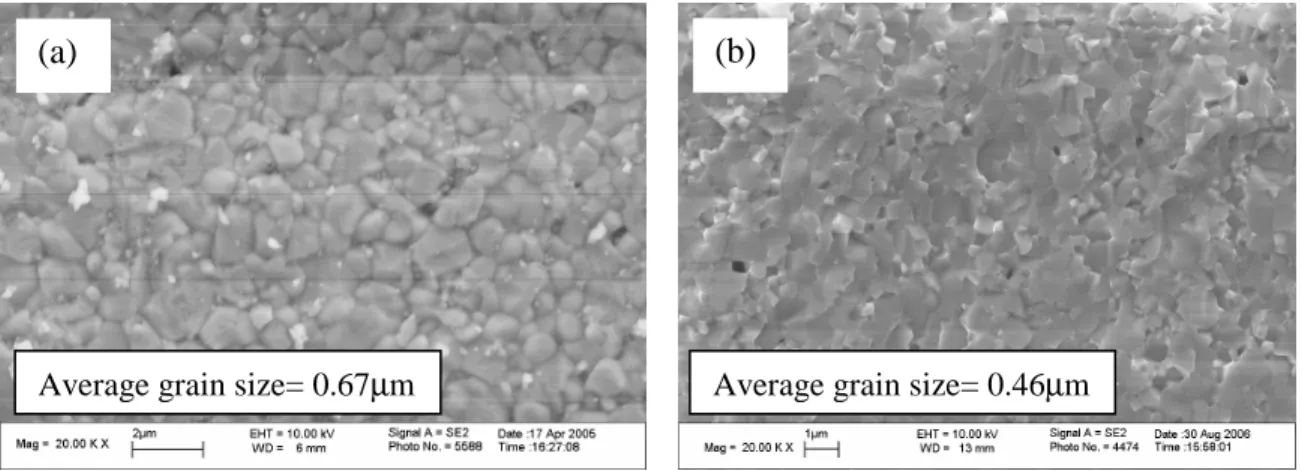
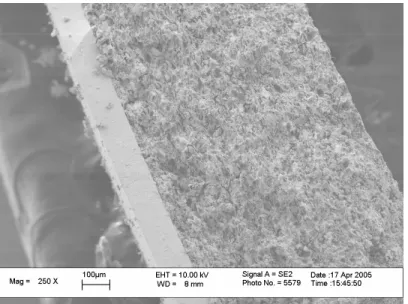
The weaker compaction of the presumably most homogeneous sample, that in which zinc nitrate was added to the BYZ nitrate solution, is attributed to the complete dissolution of Zn in the bulk crystalline structure of BYZ without significant preferential segregation to the grain boundaries. Surfaces of BYZ-Zn4 grain sintered at 1300 ºC for 4 hours (a) ZnO added to BYZ by grinding (b) ZnO added to the BYZ nitrate solution. The images (which were examined in combination with EDS chemical analysis) further show that the BYZ-Zn4 system is free of secondary phases.
Chemical composition comparison of the bulk and grain boundary in the BYZ-Zn4 condensed system.
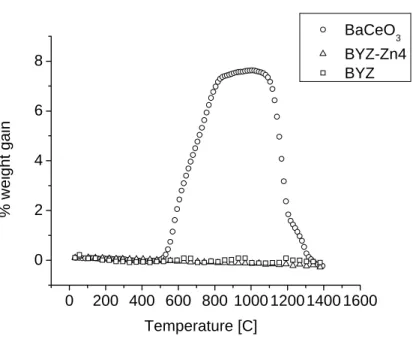
- Chemical Stability
- Transport Properties
- Conclusion
- References
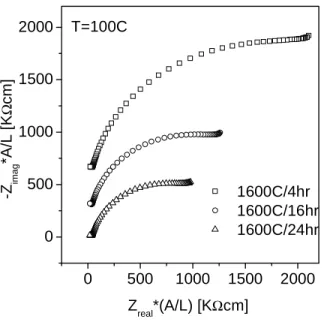
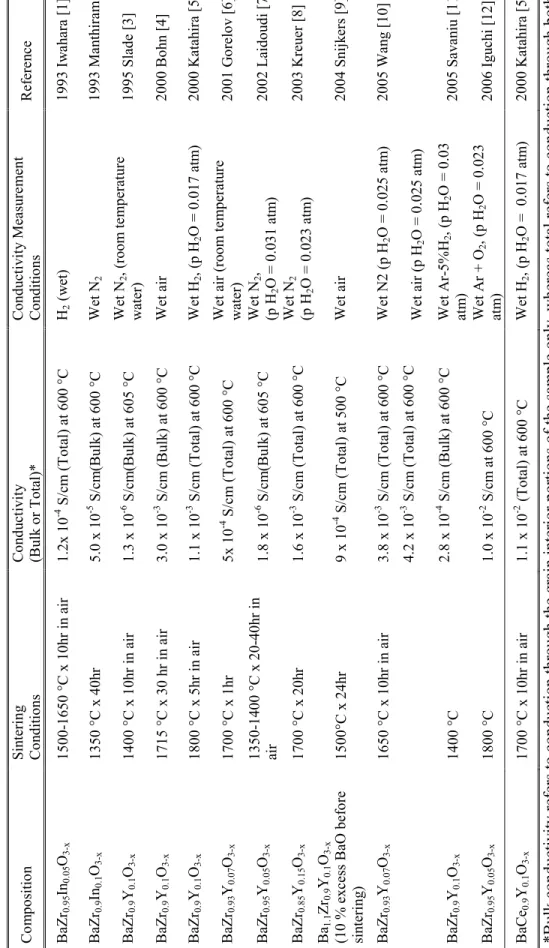
The temperature dependences of the mass (or grain interior), total grain boundary and specific grain boundary conductivity of BYZ-Zn4 are presented in Figure 5.12. The data obtained from BYZ-Zn4 are compared with the bulk and total grain boundary conductivity of BaZr0.90Y0.10O3 (BYZ10) as reported by Bohn and Schober [14], and with the specific grain boundary conductivity of BaCe0.85Gd0.15O3 as reported by Haile et al. Comparison of activation energies and pre-exponential factor of bulk and grain boundary conductivity of BYZ-Zn4 and BYZ.
A comparison of the grain boundary properties of BYZ10 and BYZ-Zn4 shows another surprising result. In this case, there is very little difference between the two samples, despite the very high concentration of Zn in the grain boundary regions of BYZ-Zn4. Although the specific grain boundary conductance of BYZ10 (nor the grain size) has been reported, it is possible to derive this conclusion from the simple observation of a grain boundary arc [13].
Perhaps more importantly, Figure 5.12 reveals that the specific grain boundary conductivity of BYZ-Zn4 is lower than that of barium cerate.
Yttrium-doped Barium Zirconate as a Fuel Cell Electrolyte
- Introduction
- Ionic transference number of BYZ by EMF measurements
- Evaluation of Electrode Materials for the BYZ Fuel Cell .1 Transition-metal Electrodes
- Yttrium-doped barium zirconate fuel cell demonstration
- Conclusions
- References
The poor performance of the palladium metal catalyst is attributed to the oxidation of Pd in the cathode chamber. The area specific resistances of the cell under a uniform gas atmosphere as well as under fuel cell conditions (partial pressure gradient H2), are measured by impedance spectroscopy for this particular cell, Figure 6.12, and are summarized in Table 6.4. A notable characteristic of Pt | BYZ20 | Pt fuel cells are much lower polarization slope under oxygen than under air.
Impedance measurements under symmetrical cell measurements indicate an electrode contribution of 3.8 Ω-cm2, which is again comparable to the 3.1 Ω-cm2 measured under fuel cell conditions. Total cell resistance under symmetrical cell of 8.1 Ω-cm2 is slightly greater than the slope of the polarization curve, 6.3 ohm-cm2. By integrating a polynomial function of the applied current and measured resistances, the polarization curve can be calculated, Figure 6.15 b.
The cathodic activity of proton conducting fuel cells based on perovskite is higher than the anode activity.
Conclusions and Plans for Future Investigations
- Main conclusions and summary
- Recommendation for future investigations
Hydration enthalpies and entropies were independent of dopant concentration due to the similar electron density of the oxygen ion (basicity) coordinated to Y and Zr. Investigations of the electrode behavior under variable oxygen partial pressure revealed that the polarization losses of the cathode were lower than those of the anode. Enhanced cathode electroreduction is tentatively assigned to the electron (hole) conductivity of BYZ under oxidizing conditions and suggests methods for further enhancement of electrochemical activity.
Further investigation of the perovskite cathode is needed to properly establish a high performance cathode for proton conductors. In conjunction with the BYZ electrolyte, symmetric cell testing of cathode materials in an oxidizing atmosphere should yield valuable information on the catalytic activity for oxygen reduction and simultaneous proton transport. Such structures are useful and implemented because the cathode overvoltage is lower than the anode overvoltage at 600 ºC.
Further optimization of the co-sintering temperature is necessary to develop a thin dense electrolyte on a cathode supported MEA (membrane-electrode assembly).
Appendix A: Anode Supported Ceria Fuel Cell Fabrication
- Introduction
- Optimization of Colloidal Deposition for the Ceria Thin-film System
- Colloidal Deposition of Electrodes for the Ceria Electrolyte Supported System
- Conclusions
Lower pressures resulted in a lower green density causing a higher linear shrinkage of the support during sintering. Eliminating the prefire step will result in cracking of the support due to the high pressures exerted during film deposition. This allows compaction of the film during sintering while avoiding cracks or defects in the thin electrolyte layer.
The colloidal solution concentration and their influence on the film uniformity were also investigated. Given the optimized uniaxial anode support pressure and pre-ignition temperature, a pressure of 15 psi was determined to be ideal for ceria electrolyte deposition. Although not as significant as varying other parameters, hot plate temperature will affect film uniformity.
For a uniform, thick film (Figure A.7), the temperature of the hot plate should be set at about 95 °C to avoid puddles.
Appendix B: Analysis of TiO as a Sintering Aid for Doped Barium Zirconate
- Introduction
- Sintering and Conductivity Results
- Conclusions
- References
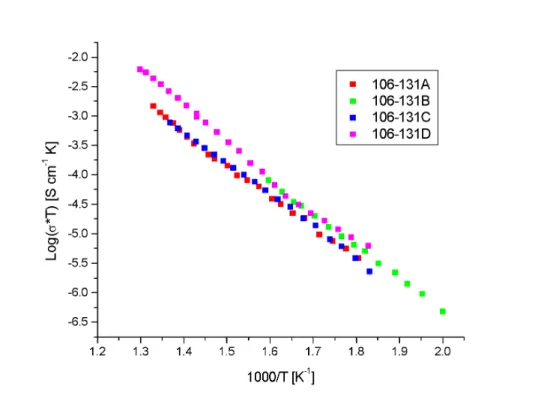
Although improvements in densification can be achieved with TiO as a sintering medium, its effect on the electrical properties of BYZ is detrimental. The bulk conductivities of the 106-131 series of sample, Figure B.2, are significantly lower than those of doped barium zirconate. In terms of conductivity, Bohn reports 10-3 S/cm at 600 ºC, while our data show 10-5 S/cm, two orders of magnitude lower.
Significant differences were not observed between incorporating the Ti into the perovskite structure and synthesizing BYZ without accommodating the Ti into the structure. Due to the high density of barium zirconate achieved with the TiO modifier, it is hypothesized that the low conductivity may be due to insufficient water saturation (or proton incorporation) of the sample. Although many more samples were provided by Nextech with varying TiO mole percentages and different synthesis routes and methods, significant improvements in conductivity were not observed.
![Figure 1.4. Gibbs energy of formation of barium hydroxide, barium carbonate, and perovskite from constituent oxides [13]](https://thumb-ap.123doks.com/thumbv2/123dok/10417093.0/25.918.158.807.113.623/figure-gibbs-energy-formation-hydroxide-carbonate-perovskite-constituent.webp)