Figure 9.1.
9.2. A springboard for more consumption
Current levels of penetration influence the pace of future penetration. Penetration increases are not linear; instead they accelerate as base penetration increases till a point where saturation sets in. If only one out of 20 households in a given affluence grade have a washing machine or a two-wheeler, adoption will be slow, but when one out of every 10 has it, it becomes something that gets on the radar screen of aspiration for the rest. When it gets to one in five families, it serves to rapidly penetrate the remaining households because it now becomes a “must have now”
product for them.
For consumer durables, the top (in terms of affluence grades) 40 million households in India – 24 million in urban India and 17 million in rural India – based on their penetration levels would constitute the core consuming class. The magic number of 200 million consumers (assuming five members to a household) has arrived at last!
Within rural India, there are two different grades of overall affluence, which we can call the developed and the developing states. The developed states comprise
Punjab, Haryana, Gujarat, Maharashtra, Karnataka and Kerala. They account for about one-third of the rural population and have shown higher penetration in most categories.
The market has enough scale to offer and enough desire to consume. The consumer is ready and waiting to be served. The new Consumer India will pose a huge challenge to marketers because it offers a difficult revenue model of large but not enormous volumes, modest prices and high benefit expectations. It will reward real innovators and ignore marketing hype. Most of all, it will continue to comprise many markets at different stages of evolution, demanding a complexity of strategy that is far in excess of its worth. And yes, it will continue to throw up unexpected answers to the arithmetic of (medium penetration) x (large size of consumer base) x (low price-willing to pay) x (modest per capita consumption).
Figure 9.2.
For FMCG, penetration is certainly not an issue. NCAER data shows that for 1998–99, the basket of 22 FMCG products that it tracks cost a total of over Rs 91,500 crore. Of this, 37% was spent by the two lowest-income groups in rural India and only about 20% by the top two income groups in urban areas.
9.3. A new consumption push for 2006–07
Why does the changing shape of income distribution herald a change in consumption behavior? A traditional bottom-heavy triangle, with most people in the lower income group and a few in the top, indicates that the centre of gravity of market consumption and of the reference group, which defines aspirations, is very low. As the shape of income distribution starts bulging in the centre, both the centre of gravity of what is consumed and who the “majority” that defines aspirations should be, shifts.
NCAER income distribution data and their modeling of the future of income distribution are invaluable. It is the only “single source” data that also looks at inflation-indexed income and reliably shows shifts in shape. The projected shape of urban India in 2006-07 shows that the centre of gravity will be the upper-middle- income group and that there will be a large consumption push.
Taken as an aggregate, the projected shape of income distribution in 2006–07 suggests that the centre of gravity of consumption and aspiration will rest with those who have “just escaped poverty”.
To understand the full impact of the urban change, it is necessary to compute the arithmetic of increase or decrease in each income group as well as the increase (or decrease) in penetration in each group. Only when viewed together do we get the full picture. In some categories, depending on supplier strategies and starkly lowering price-performance points, the results could be counter-intuitive. However, for the rest, this is likely to be the typical arithmetic. The tale goes like this. NCAER estimates the number of households to increase by 8.6 million in the high-income group and 7.3 million in the upper-middle-income group, while the middle-income number grows by 4.3 million and the bottom two income groups will decrease by about 2.3 million and 7.5 million, respectively. (The total number of urban households is set to increase from 49.1 million to 60 million.) A 10% increase in the top income group penetration, a 15% increase in the second income group and a 10% increase in the third income group could give incremental volumes of 7.5 million in the highest income group, 5 million in the next income group and a mere
2.7 million in the third income group. The urban market is indeed on the periphery of a huge consumption push.
Rural India will have two points of significant household increases – 4.6 million high-income households and 13 million middle-income households will be added by 2006-07 (the total number of rural households will increase from 122.8 million to 139 million). Let me present a sampler of the same typical arithmetic for a well- penetrated category, which has 45% penetration in the high-income group, 25%
penetration in the upper-middle-income group and 10% penetration in the middle- income group. By 2006-07, a reasonable estimate, given the current penetration base and past patterns from urban areas, is that it would increase to 60%, 30% and just 13%. Therefore, the incremental volumes would be 3.3 million from the upper- income group and 2.3 million from the middle-income group. Given the increasing urban exposure of rural India, the urban and the rural upper-income groups can form an interesting continuum market, giving it a scale of 23 million households, or 115 million population. In 2006-07, the consuming class, as we defined it earlier, would be about 60 million households, or 300 million consumers. However, a state-wise look at rural income shapes show a totally different pattern. It shows that in states that account for about half the rural GDP of the country (as defined by the Crisil Centre for Economic Research Analysis), the center of gravity of consumption and aspiration has already moved towards the middle/upper-middle-income classes, again suggesting that there is another inflection point of consumption that is about to happen, and that perhaps these states are far more ready for sophisticated consumption than we imagine them to be.
Fired by buoyant markets and high economic growth rates, China and India topped ACNielsen’s latest Consumer Confidence Study. While China ranked as the most optimistic among all markets surveyed, with 78% of consumers looking forward to further economic improvement over the coming year, following closely behind were India (77%) and Indonesia (76%). Completing the top 10 spots were the USA, ranking ninth (43%), followed by Norway at 10th (42%). Of the top 10 countries in the world that are most optimistic about the next 12 months, eight are from the Asia-Pacific region.
Conducted over the Internet last November, ACNielsen’s Consumer Confidence Study was expanded this time to cover 28 markets across Asia-Pacific, Europe and the USA, interviewing 14,134 consumers.
This robust degree of consumer confidence among Asian markets such as India, China and Indonesia has contributed to the Asia-Pacific region’s overwhelming optimism compared with Europe and the USA. This bodes well for the outlook of global investors, who have pinned their hopes on the Asian economies. Looking at the countries where consumers have the highest penchant to save money, the top nine were from the Asia-Pacific region – led by Indonesia (59%), Malaysia (58%) and Thailand (57%), with the Netherlands the only market outside the Asia-Pacific making it into the top 10.
For the Asia-Pacific region as a whole, 40% of consumers surveyed thought their country’s economy had improved over the previous six months and 53% expected it to improve further over the next year. However, 43% of Americans remained positive about the year ahead and optimistic their economy would improve and, while 31% of Europeans were of a like mind, a further 35% expected the situation to deteriorate over the coming year.
A sizable 48% of Americans and 40% of Europeans thought their economies had deteriorated over the previous six months. Consumers surveyed in the USA perceived that their economy had not improved in the last six months, but were more optimistic of a turnaround in the year ahead, with 43% expecting an improvement.
The Europeans, however, were split in their opinion: about a third each felt the outlook would improve, remain the same or deteriorate over the next 12 months.
In the portion of the survey on “How We Spend Our Spare Cash”, in India and across the world, during good times and bad, consumers appear to respond differently when it comes to how they spend their spare cash. For Indians, buying new clothes, short, local vacations, home improvements and investing in shares and mutual funds seems to be a greater priority than consumers in other parts of the Asia-Pacific region. For 50% of Indians, saving money is also a priority, like most other countries in Asia.
In the Asia-Pacific region, when asked how they use spare cash once they have covered their living expenses, nearly half said they put it in savings or deposit accounts. The second-most-mentioned was out-of-home entertainment (32%), followed by paying off credit-card debts or loans (29%).
In the USA, however, the top three priorities were reversed, with 33% claiming they were paying off credit-card debts or loans, followed by out-of-home entertainment (29%) and savings and deposits (23%). This compared with 37% of
Europeans spending on out-of-home entertainment, followed by savings or deposits (34%) and new clothes and home improvements each coming in at 33%.
It has been predicted that the Asian economies of China and India will be the main vehicles of growth for the world economy, making up the engines of a new world economic order. This point was highlighted recently at the World Economic Forum at Davos, Switzerland, where “India Everywhere” was the theme. This was reflected in the words of the Confederation of Indian Industry chairman YC Deveshwar, who said he detected a certain sense of insecurity among Western governments and corporations as they were getting increasingly uneasy over the prospect of being bought out by Indian or Chinese multinationals.
Professor Jagdish Bhagwati also pointed out that the West was imposing its own labor standards and other social-justice norms on emerging economies. In fact, the key to the fresh and vibrant business optimism in “Chindia” (as the Asian growth phenomenon is being called) is the rise of the middle classes.
The rising middle class in China and India
Propelling China’s growth is a steady stream of foreign investment attracted by the country’s seemingly inexhaustible pool of workers and its growing body of consumers. Economists note that even if only 8% of Chinese make a middle-income salary, that would still amount to 100 million people – a base of consumers almost as big as the entire USA middle class. In 2003, foreigners invested US$60 billion in the Chinese mainland and more than $30 billion in Hong Kong. It was the second year in a row that mainland China displaced the USA as the world’s most popular investment locale.
The impact of that investment was magnified by the artificially low value of China’s currency. Economists estimate that one Chinese yuan can buy as much in China as $4.60 can buy in the USA, so $60 billion worth of investments there has the same impact as $276 billion in the USA. Since China opened its economy to international trade in 1978, foreign investments have totaled more than half a trillion dollars, helping fuel one of the greatest industrial expansions the world has ever seen.
Similarly, in India, the middle class forms 20-25% of the total population (200 million to 250 million people) and is driving demand in the economy. Increased spending by India’s middle class is estimated to be more than $300 million. The lifestyle orientation of people is changing: the super-rich class of 17 million will
increase to 35 million in five years. More than 40 million in India already have the same purchasing power as Americans. Overall consumer spending grew at a pace of 6% per year in past 10 years. In addition, about 75% of population in India is under 40 years of age.
India is marketing itself as the world’s fastest-growing free-market democracy.
This time, it is hitting the right chords with foreign investors who are otherwise wary of the two Asian giants teaming up (Asia Times Online, February 8, 2006).
9.3.1. The rising middle class in India
In India, the middle class forms 20-25% of the total population (200 million to 250 million people) and is driving demand in the economy. Increased spending by India’s middle class is estimated to be more than $300 million. The lifestyle orientation of people is changing: the super-rich class of 17 million will increase to 35 million in five years. More than 40 million in India already have the same purchasing power as Americans. Overall consumer spending grew at a pace of 6%
per year in past 10 years. In addition, about 75% of population in India is under 40 years of age.
9.4. Impact on marketing
It has been said earlier that there is a new Consumer India waiting to be served with relevant products and services.
9.4.1. Required: mature market strategies
Mature market strategies. Two-wheelers have penetrated about 12% of all households. By this metric, it is clearly an underdeveloped market that should grow from first-time buyers and should not be lapping up (or even accepting) higher-level features. Yet, half the sales in a year are from repeat buyers and half from first-time buyers, and about half from small markets (with populations below 1 lakh). In many categories, consumers exhibit plus one level up behaviour – whatever you think they should be buying given their affluence and the state of market development, they buy one level better than that. Outdated technology, low performance and plain looks are rejected, no matter how attractively priced. The answer to this puzzle is in the differential levels of penetration. Urban penetration is about 24%, but in the top
30 million households by affluence, penetration is 52%. Moreover, the trend of two- wheelers giving way to cars in this top urban affluence grade is expected to be picked up by the second affluence grade as prices of small cars drop further.
In the case of refrigerators, the overall penetration is 10.4%, suggesting an underdeveloped market. Maturing supply shifts the basis of competition and, hence, drivers of brand choice. Improved supply, “performance, features and quality” parity of all major brands and the near price-parity between them shift the basis of competition to the augmented product from the basic product. Add-on services (like removing pain points and not piped music in showrooms) and buying experience will be the driver of brand choice. Can the air-conditioner be fixed without the usual hassle of chipped paint five different contractors, broken walls, etc, in just a day?
Does your cell phone company view your bills online when you call them so that it can advise you on what is the best tariff plan? Can the family be given 12 lessons at home after the personal computer arrives? These will be the issues based on which choices will be made. Changing markets need new bases of segmentation. As the market matures and is subjected to multiple changes at the macro level and in related categories, segmentation has to go beyond the product-centric paradigm. Instead of looking at “Premium, popular, discount” price-performance bands, it is time to look at consumer groups, how they view the market and what drives their choices. The question to ask of research is not “how is the market segmented?” (the answer to that is that it is segmented the way marketers have segmented it so far), but what is the new way in which to cut it up so customers can be served better? Take refrigerators. The context in which the category exists has changed. There is more eating out, more phone call deliveries of food and groceries; women are changing and reorganizing their time and their household chores, etc. Clearly, there are segments beyond the modern mum and the good health-conscious housewife, which need to be identified (again on a functional usage and attitude basis rather than on whether she wears her hair short or gives parties – the lifestyle kind of variables).
There is more eating out, more ordering of food and groceries by phone, women are changing and reorganizing their time and their household chores, etc. Clearly there are segments beyond the modern mother and the good health-conscious housewife which need to be identified (again on a functional usage and attitude basis rather than on whether she wears her hair short or gives parties – the lifestyle variables).
Usage patterns are now so different that they form a good basis for segmentation, product design, pricing and service design. From a psychographic point of view,
Young and Rubicam, in a cross-cultural study done years ago, identified groups that we see in Consumer India, and which could form a useful basis for segmenting the market.
The “mainstreamers”, “succeeders’ and “aspirers” are correlated by occupation, age, stage of life and geography. Qualitative researchers say that cities can be characterized this way too; hence, they show different consumption quantities and character even for a given income distribution.
The only question that rises from this is what is happening in Consumer India.
Are values in India changing? The answer: some changes, mostly morphing change,
“this as well as that” compromises, new ways of doing old things; let us not confuse changes in ritual with changes in religion.
India is forging ahead on the consumption track, with all lights at green and no stop signs visible, but though full throttle, it was a large mass moving at a modest speed with modest and modestly increasing acceleration; rich getting richer and increasing in numbers, many poor becoming gaining some bit of affluence.
However, market researchers totally disagree with this characterization of upwardly creeping, slow burn consumption. They feel that there was going to be a huge consumption explosion just around the corner. It is concerning that maybe the insidious Indian consumer market sneakily changed when I wasn’t looking, as he/she is wont to do.
But having looked at all the numbers, some perspective is required. We are getting carried away with the tip of the ice berg looking better and larger than before – forgetting that it is just the tip of the iceberg and that the rest of the ice berg does not look like the tip. Sure, the tip of a large iceberg is large. The top 10% of India is a little over a 100 million people and that is three times the size of Canada, five times Australia, a little less than double of France, etc. Mostly urban, they harbor approximately 40% of the total income. Again, blurring the precision a bit of the income metric a little, this lot having a per capita GNP of 60% of Malaysia and 80%
of Brazil (with a population equivalence of about 60% of Brazil). But then we all know that India is a land of conflicting truths. Yes, all of Consumer India is unified in its deep desire to consume and information about what to consume, but the actual quantum of consumption is limited by income and availability of appropriate price- performance products. For higher-end, more sophisticated durables and consumer product categories, the A and B socio-economic classes of urban India (the SEC classification of the Indian market, used by most consumer businesses, is based on
the occupation x the education of the chief wage earner) is a very ripe target. This group of about 15 million households, a bit less than 10% of all Indian households, is a high education and exposure group, an explosive growth consumption machine, ready to snap up whatever sensible price-value equation is available. Their general orientation is to pay more to obtain greater benefits, rather than to pay less for fewer benefits. For this group, the share of the premium segment (higher levels of benefit and price than the category average) to total product category purchases is already high, ranging from 35 to 50% for most categories, and is rising, fueled by more frequent upgrading replacement. By the sheer statistics of what happens to the rich tail when the mean of an income distribution improves, we will see premium products and consumption of more “mainstream” international norm products grow very fast. A lot of talk focuses on the BPO Employees fueling consumption and the number is expected to touch 1 million in 2006. That is still quite a small number and while it is an interesting youth-market niche in an otherwise ageing world, it is not
“Youth India” – just a tiny fragment of it.
Durables such as cell phones, two-wheelers and color TVs, which have managed the transition in peoples minds from “nice to have” to “necessary to have”, whether for emotional or functional reasons, have already achieved substantial penetration in lower SECs. For such products, the target market is larger, comprising SEC A, B and C as well as rural RI (marketers classify rural SEC as R1 to R4 based on the type of house and the education of the chief wage earner). This consumer segment is composed of about 30 million households and is growing in number and income.
That is the good news. The bad news is that this target market is still under 20% of Indian households. The consuming upper and upper-middle classes of India have arrived and are igniting consumption – but it is a poorer class of consumers than in most other countries, as suggested by the Living Standards Measurement Survey scale developed by the World Bank.
What will cause a discontinuous growth in consumption across the entire iceberg? Availability of affordably priced, adequately performing products and services. Whenever any such offering has happened, be it in healthcare, televisions, retail formats, financial services, cell phones or apparel, the market has always discontinuously grown. This does not mean that Consumer India has suddenly got discontinuously rich. It just means that some smart suppliers have got their consumer value equations right and have a cost base that enables them to still make a profit.
9.5. Conclusion
So, overall, how does the future look? Optimistic or pessimistic? Let us be realistic. Let us celebrate the opportunity of a growing “Rich India”. But let us not make the mistake of extrapolating its growth in size, affluence and consumption habits to the rest of India, because then we would have a repeat of the “great Indian middle-class muddle” all over again.
9.6. References SEC
The socio-economic classification (SEC) groups urban Indian households on the basis of education and occupation of the chief wage earner (CWE: the person who contributes the most to the household expenses) of the household into five segments (SEC A, SEC B, SEC C, SEC D and SEC E households in that order). This classification is more stable than one based on income alone and being reflective of lifestyle is more relevant to the examination of consumption behaviour. In this article “high” socioeconomic classes refers to SEC A&B, “mid” socioeconomic class refers to SEC C and ‘low’ socioeconomic classes refers to SEC D&E. Data sourced from Indian Readership Survey (*IRS 1998-1999) gives the education and occupation profile of the chief wage earner of households.
BPO (Business Process Outsourcing Industry) Bibliography
1. The Kaleidoscope Of Consumer Demand, Rama BijaPurkar, The Economic Times – May 2000
2. The Real Ice Phenomenon, Rama Bijapurkar, The Economic Times – Jan 2001
3. Connecting With the Future Consumer India, Rama Bijapurkar, The Economic Times – May 2003
4. But are Marketers Ready?, asks Rama Bijapurkar, The Business World – Dec 28, 2003 5. Cut the Fluff: Basics of Consumer Spending in India, by Rama Bija Purkar, The Economic
Times – September 25, 2006
6. The Shining, Growing Tip of the Iceberg, by Rama Bijapurkar, The Economic Times – Nov 21, 2005.
7. China, India Lead Consumer Confidence Survey, by Shehla Raza Hasan, The Asia Times Online, Feb 8, 2006
8. Indian Consumers and the Market, The Business World – May 2006 9. http://www.ramabijapurkar.com
Globalization and Consumer Behavior:
A Case Study of Cell Phone Owners in India
10.1. Introduction
The developments in telecommunication have played a significant role in the applications and uses of information and communication technologies (ICTs). With the capability of linking together the various elements of ICTs, regardless of geographical distance and locations, a telecommunication infrastructure is the crucial factor contributing to the convergence of the ICT elements in general. This in turn has widened the scope of development of human activities in socio-economic and geographical spheres. During the globalization era, ICTs have dramatically influenced consumer behavior in terms of commodity and services awareness, searching, evaluation, purchasing and use. It enables consumers to order from home, online or by telephones or cell phone. Thus, the development of communication technology has brought about a drastic change in consumers’ behavior, lives and habits, business organization and the telecommunication industry itself, due to the transition from landlines to cell phones.
Cell phones are an important element of ICT. Cell phones are a popular means of communication in both the social and the work spheres. Compared to personal computers and net technologies, cell phones are used by a larger section of the world population. Cell phones have a greater effect on social life and, hence, people are
Chapter written by Velan NIRMALAandU. DEVASENADHIPATHI.
willing to spend more on the mass-produced, less expensive cell phones and pay cell phone bills rather than pay for internet services [GES 2004]. This is because the cell phone technology has the capacity to connect even the less privileged and less educated population in less developed countries (LDCs), as compared to the computer technology [TOW 00; ITU 02]. Cell phone technology has been very successful in developed countries and is emerging as a great communication infrastructure in the developing countries. As a consequence, in 2001, the total number of phones in the world surpassed the number of television sets for the first time [KAT 02]. An International Telecommunication Union study revealed that the cell phone has narrowed the gap in telephone use between developed and developing countries. In 2001, more than 100 countries had more cell phones than landline telephones [ITU 02].
Cell phones offer mobility to people so that they can work or interact with others from anywhere. Ling and Yttri [LIN 99, 02] identified the use of cell phones for three purposes: i) micro-coordination, ii) hyper-coordination and iii) safety and security. Micro-coordination refers to use for logistical purposes in day-to-day personal life and work, such as arranging the time and place of a meeting. Hyper- coordination refers to its use for the purpose of social interaction, personal expression and self-presentation, such as the choice one makes as to physical model of the phone. The purpose of use for safety and security is the use of the phone in emergencies. At work, it provides three inter-related mobilities: i) locational mobility, ie, geographical movement of the workers, ii) operational mobility, ie, the ability to be flexible in business activities and the ability to give independence and iii) interactional mobility, ie, capability of interacting freely with a large number of people from anywhere [KAK 03; HUR 05].
Cell phones are becoming a social and cultural phenomenon, providing an opportunity to express personal emotions and the advantage of communicating with anyone anywhere. Through its varied functionalities, it also ensures non-intrusion by restricting the people who can access the owner as the owner can decide to whom the cell phone number may be given and when to switch it on or off, by giving the owner the ability to manipulate the ringing and voice volumes, to view the caller’s number and thus filter out unwelcome callers. It also makes it possible to divert calls to other routes, such a voice message box or a Short Message Service (SMS), thus giving the owner the choice of whether or not to respond to the caller. Cell phones are also empowering in the sense that they help to control actions and thus assume personal responsibility of situations, from a distance. For instance, women generally keep cell phones for social purposes, such as contacting children, family or friends,
as well as using it as a means of personal security [PUR 02]. Hence, the cell phone has metamorphosed into an “umbilical cord” as a woman can be in touch with her family, whether she is at home or at work. In addition, a worker can communicate with their employer or vice versa, ensuring accessibility and continuity in work, thus resulting in greater productivity. Cell phones also reduce formal meetings – both official and informal. Therefore, while being advantageous to the business fraternity, cell phones represent a means of greater productivity, interaction and efficiency.
They enhance social relationships through SMS and voice contacts. As a result, cell phones are fast replacing personal computers, with their enlarged facilities which make them a multimedia device for text messages, e-mailing, photography, music, radio, movies, software programs and everything that is digitally coded. As cell phones’ multimedia accessories are light-weight, handy, user-friendly and available at prices that are affordable, they are accessible to all sections and all ages of the population (children or elderly people, male or female, disabled or illiterate people and even those with a low income) [GES 04]. Thus, there are more cell phone owners worldwide today than there are computer or even television owners.
Since the 1990s, the number of cell phone subscribers has risen from zero to about half a billion worldwide [ITU 02]. Although India has made remarkable achievements in network expansion in the telecommunication industry, the tele- density is low compared to other geographically smaller nations. This is attributable to the country’s large population size and income gaps. Nevertheless, the total tele- density world ranking in terms of total telephone subscribers and cell phone subscribers per 100 inhabitants improved from 160 in 1990 to 145 in 2000 and further to 111 in 2004. During 2004 the total telephone subscribers per 100 inhabitants was 8.44 and the cell phone subscribers per 100 inhabitants was 4.37.
However, the subscribers are far below the numbers in China, which were 49.74 and 25.76 respectively. The percentage of total cellular mobile subscribers to total telephone subscribers was 51.8 for both countries. The compound growth rate of cell phone subscribers in India from 1999–2004 was reported to be 90.5% [ITU 04]. The Cellular Operators’ Association of India reports the current number of cell phone owners in the country to be more than 110 million [SCH 06]. In addition, the Telecom Regulatory Authority of India (TRAI) reports the cell phone tele-density to be growing at a rate of 60 to 65% a year. However, the rural tele-density has remained stagnant at 2% since independence (1947), reflecting serious regional imbalance. Nevertheless, the TRAI promises to overcome this gap within six to eight months through the Universal Service Organization (USO) fund which is being allocated for cellular telephony. In addition, new technologies, such as Wi-Fi and
Wi-Max, will be taken to rural areas, which will connect them with cell phone networks faster than landline telephones [SIN 06].
In recent years, there has been a growth in research on mobile communications worldwide. Besides examining social networks, literature also focuses on the uses and varied perceptions of cell phones. For instance, Ling [LIN 96] found that many cell phone users perceived their instruments “as a means of personal display”.
Alexander [ALE 00], Hulme and Peters [HUL 01] and Green [GRE 03] observed that adolescent cell phone users, in particular, used the instrument as a fashion symbol. Studies by Gant and Kiesler [GAN 2001] indicated that some cell phone users considered the instrument as an extension of themselves. Studies by Taylor, Alexander and Harper [TAY 01] and Green [GRE 03] also revealed that to some users a cell phone was a symbol of social status.
Research also reveals that the Social Influence (SI) model of technology use provides a useful framework for explaining some of the perceptions and uses of the communication media in an organization [CAM 03]. The SI model states that
“Media perceptions are, in part, subjective and socially constructed” [FUL 90, 93, 95]. According to the SI model, “contextual social factors influence the development of perceptions and use of communication technologies”. In other words, the behavior, statements and attitudes of those in close contact play an important role in determining how communication media are perceived and used [CAM 03].
The usage pattern of cell phones has also been examined in terms of: i) usage intensity (amount of usage, regardless of the nature of use); ii) usage breadth (number of people called and received calls from) and iii) usage variety (the different purposes for which the phone is used, regardless of the frequency of use) [RAM 90; GES 04]. The ongoing review of literature, however, shows that there are very few studies that focus on the socio-economic and cultural factors that determine the ownership of cell phones.
Given the noticeable change in cell phone ownership in Indian households, this chapter attempts to examine some of the aforementioned issues in the context of the Pondicherry region of the Union Territory of Pondicherry (UTP) in south India, which shares a similar cell phone scenario to the rest of India. It attempts to gauge the popularity of the media in the study area, in terms of usage intensity (ie, time spent on making and receiving calls) and variety intensity (ie, the purpose for which the phone is used, regardless of the frequency of calls) [RAM 90; GES 04]. Further, given the low penetration rate and socio-economic constraints at work in India, it
has been deemed important to examine the factors that influence the probability of the households in the Pondicherry region owning a cell phone. The study also attempts to verify the hypothesis of whether perceptions and uses of cell phones are socially constructed in the study area, ie, whether friends and family influenced the purchase of cell phones, or whether the cell phones were handed down from other family members.
Thus, the objectives of the study are: 1) to analyze the determinants of the probability of cell phone ownership among the sample households in the Pondicherry region; 2) to examine the cell phone usage intensity and usage variety among the sample households during the survey and 3) to verify the relevance of SI hypothesis among those households.
The chapter is organized as follows. Section 10.1 of the chapter introduces the problem, followed by the description of data and methodology used in section 10.2.
The empirical results of the study are discussed in section 10.3 and the final section, 10.4, gives the conclusions drawn from the results.
10.2. Data and methodology
The UTP in south India has a cell phone density similar to that of rest of the states and the country in general. A case study of the consumer behavior of cell- phone-owning households has been conducted in the Pondicherry region of UTP.
The study focuses on the cell-phone-owning and non-owning households in the region, so as to analyze the socio-economic factors contributing to cell phone ownership in the study area. Using a random sampling survey method, with no specific focus on classifications by socio-economic characteristics, 350 households were interviewed using a pre-tested schedule during March–June 2006. Out of the total sample households, 264 (75.43%) owned cell phones and the rest (24.57%) did not. Among the former category, 67.05% of the households also possessed landline phones, while in the latter group 81.40% had landlines. The chapter attempts to analyze the probability of cell phone ownership and intensity of its usage by the sample households in the study area. The objectives of the present study have been pursued using simple averages, percentages, descriptive statistics, the Garret ranking technique [GAR 69] and multiple and simple logistic regressions.
A logistic regression has been adopted to examine the factors determining the probability of cell phone ownership by the sample households. The estimated regression equation is:
MOBD = b0 + b1REGN + b2SLIS + b3SOCL + b4INCM + b5SEMP + u where:
MOBD = probability of cell phone ownership dummy, taking value one if owned and zero otherwise;
REGN = region dummy, taking value one for urban area and zero otherwise;
INCM = monthly household income in Rupees;
SLIS = standard of living index score (for calculation and for SLI categorization, see Appendix);
SOCL = social influence dummy, taking value one if purchase was influenced by others and zero otherwise;
SEMP = number of self-employed in the household; and U = error term.
The regression was initially estimated by including more independent variables, such as age and education of the household head and age of the teenage children in family who influence such purchases. However, they had to be dropped under the step-by-step procedure of analysis employed because of their poor influence on the dependent variable. The purpose of using the step-by-step procedure was to overcome the emergence of multi-collinearity problems, if any, in the estimation of the logit regression. The theoretically expected a priori association between the dependent and independent variables will be briefly discussed here.
As the diffusion of cell phones is more rapid in urban society, moving from rural to urban areas is hypothesized to have a positive effect on cell phone ownership by the household, due to greater awareness, exposure and availability of the product in the region.
Monthly income includes the incomes earned by all members of the household, while the standard of living index represents all the comfort and luxury items possessed by the household and the values of any house and landed property owned.
The two variables are also expected to lead to the ownership of cell phones, owing to better economic conditions.
The social influence dummy is also hypothesized to be positively associated with the probability of cell phone ownership, owing to the pressure from neighbors, friends, or relatives to own one, in addition to the bandwagon or demonstration effect.
The number of self-employed in the household is again expected to be positively associated with the dependent variable, due to the need for continuous communications for business activities.
Furthermore, simple logistic regressions have been estimated in order to analyze the direct effects of economic factors and social influence on the probability of cell phone ownership by the sample households. The estimated equation is:
MOBD = a + a1Xi + u where:
Xi = i) INCM;
ii) SLIS;
iii) INST (mobile instrument price in Rupees);
iv) MBIL (monthly mobile services use bill in Rupees); and v) SOCL.
Following Ram and Jung [RAM 90], the study examines the usage pattern of cell phones in terms of usage intensity and usage variety. The study ignores usage breadth, as the details of the calls made and received were not clearly maintained by the respondents. The usage intensity is measured in terms of usage of mobile phones, regardless of the nature of use, on the basis of the time and amount spent per week and the number of household members using the phone. Usage variety is examined on the basis of the different purposes for which the phone has been used, regardless of the frequency of use.
The Garret ranking technique [GAR 69] has been employed to examine the significance attributed to reasons for the choice of the cell phone brand purchased,
type of connection used and usage variety by the sample households. During the interview, the respondents were asked to assign ranks to each reason on the basis of priority. The reasons ranked were then converted into percentage position by adopting the Garret ranking technique. The formula used was:
ij j
100(R 0.5) Percentage position
N [1]
= −
where:
– Rij = rank assigned to the ith factor by the jth individual; and – Nj = total number of factors ranked by the jth individual.
The percentage position thus obtained for each rank was further converted into scores by using the Garret’s rank table. The scores of all respondents for each factor were then added together and divided by the total number of respondents who had responded, so as to calculate the mean scores for each factor. These mean scores were then arranged in a descending order and ranks were allotted.
10.3. Empirical results and discussions
This section discusses the empirical results of the analyses conducted to pursue the objectives of the study. Since the focus of the chapter is to analyze the probability of cell phone ownership by the sample households, the analyses largely focus on the consumer behavior of cell-phone-owning households.
Table 10.1 gives the descriptive statistics on the socio-economic features of the cell-phone-owning (75.43%) and non-owning (24.57%) sample households during the survey. The age and education pertain to the household head, as they are generally the decision makers in the Indian family and they are the ones who pay for the purchase and use of cell phones.
Owner Non-owner Sl. No. Variables
Mean SD Mean SD
1. AGER 46.83 15.92 43.77 18.39
2. EDCN 0.61 0.49 0.42 0.50
3. SEMP 0.08 0.27 0.07 0.26
3. INCM 16,612.47 20,507.65 12,601.80 10,447.09
4. SLIS 35.17 8.80 27.81 7.97
5. REGN 0.96 0.20 0.87 0.34
6. SOCL 0.56 0.50 – –
7. MBIL 440.12 325.72 – –
Note: SD = standard deviation; US $1 = Rs. 44 at the time of survey.
Table 10.1. Descriptive statistics
The table shows the mean age of the household head (AGEH) to be around 47 years for the cell phone owners and 44 years for the non-owners. As regards the education of the household head (EDCN), more owners (61%) than non-owners (42%) have completed secondary school education and higher education. This could be because the more-educated are more likely to rely on ICTs.
The economic status reveals that 8% of owner and 7% of non-owner sample households have members who are self-employed. The average total household income per month was also comparatively larger for the former (Rs. 16,612.47) than for the latter (Rs. 12,601.80). Likewise, the standard of living index also shows that for the former the living standards were better than that of the latter during the survey.
This indicates that better economic conditions increased cell phone ownership in the study area. Furthermore, the area of residence shows that more owner (96%) than non- owner households (87%) reside in the urban areas, which provide greater exposure to cell phones and greater opportunities to own cell phones.
In the case of cell phone owners, the average monthly expenditure on services use (MBIL) was Rs. 440. The survey also reveals that about 56% of the sample of cell phone owners was influenced by others (neighbors, friends, or relatives) to purchase the instrument.
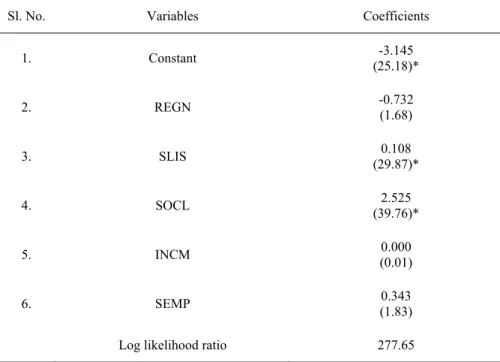
Table 10.2 gives the estimated logit regression results of the factors determining the probability of cell phone ownership among the sample households in the Pondicherry region.
The results show that living in urban areas of the Pondicherry region did not positively or significantly influence the decision of sample households to own a cell phone. This is attributable to the fact that in urban Pondicherry, there are several other alternative means of communications, such as landline telephone, Internet and Net phone, which means that cell phone ownership is not indispensable.
The family’s standard of living and monthly income both have a positive effect on the decision of whether or not to own a cell phone. However, the impact is significant only in the case of standard of living and not monthly income.
Sl. No. Variables Coefficients
1. Constant -3.145
(25.18)*
2. REGN -0.732
(1.68)
3. SLIS 0.108
(29.87)*
4. SOCL 2.525
(39.76)*
5. INCM 0.000
(0.01)
6. SEMP 0.343
(1.83) Log likelihood ratio 277.65 Note: Brackets show t–value; and * indicates statistical significance at 1% level.
Table 10.2. Logistic regression: cell phone ownership function
The effect of the social influence dummy on cell phone ownership emerges as positive and highly significant, thus strongly supporting the validity of SI hypothesis in the context of the Pondicherry region.
As regards the number of self-employed members in the household, their larger number also has a positive influence on cell phone ownership. However, the impact is insignificant because the number of households with self-employed members in the sample is negligible. Further, the self-employed are engaged in traditional business activities only, where the role of cell phone communication is highly limited.
In sum, standard of living and social influence emerge as the significant factors determining the probability of cell phone ownership in the study area.
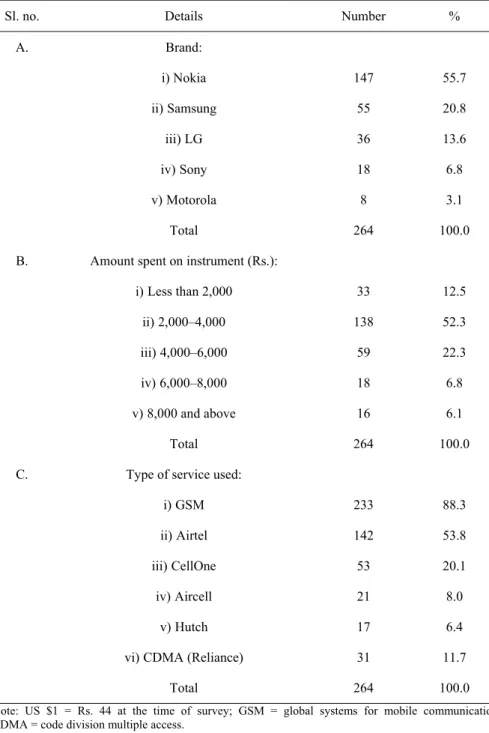
Table 10.3 gives details on the cell phone instrument and services used by the owner households.
Sl. no. Details Number % A. Brand:
i) Nokia 147 55.7
ii)Samsung 55 20.8
iii)LG 36 13.6
iv)Sony 18 6.8
v)Motorola 8 3.1
Total 264 100.0
B. Amount spent on instrument (Rs.):
i)Less than 2,000 33 12.5
ii)2,000–4,000 138 52.3
iii)4,000–6,000 59 22.3
iv)6,000–8,000 18 6.8
v)8,000 and above 16 6.1
Total 264 100.0
C. Type of service used:
i)GSM 233 88.3
ii)Airtel 142 53.8
iii)CellOne 53 20.1
iv)Aircell 21 8.0
v)Hutch 17 6.4
vi)CDMA (Reliance) 31 11.7
Total 264 100.0
Note: US $1 = Rs. 44 at the time of survey; GSM = global systems for mobile communication;
CDMA = code division multiple access.
Table 10.3. Mobile instrument details
During the survey, more than half the sample households owned Nokia cell phones, followed by Samsung (20.8%) and LG (13.6%). The percentage ownership of Sony (6.8%) and Motorola (3%) brands was quite low.
As regards the cost of the instrument, more than half the sample households (52.3%) spent between Rs. 2,000 and 4,000 on cell phones. About 22% spent between Rs. 4,000 and 6,000, and 12.5% spent less than Rs. 2,000. Around 6% spent Rs. 6,000 to 8,000 and another 6% spent Rs. 8,000 and above.
The types of services used in the Pondicherry region are GSM and CDMA. Only Reliance comes under the latter, with 11.7% households using it. In the case of GSM (88.3%), Airtel service was the most popular due to its attractive pioneering special service offers, like free SMS and incoming calls, etc. About 53.8% of the respondent households opted for it. It was followed by CellOne (20.1%), Aircell (8%) and Hutch (6.4%).
Thus, while Nokia is the most popular instrument, Airtel is the most desired for its services among the sample households in Pondicherry region.
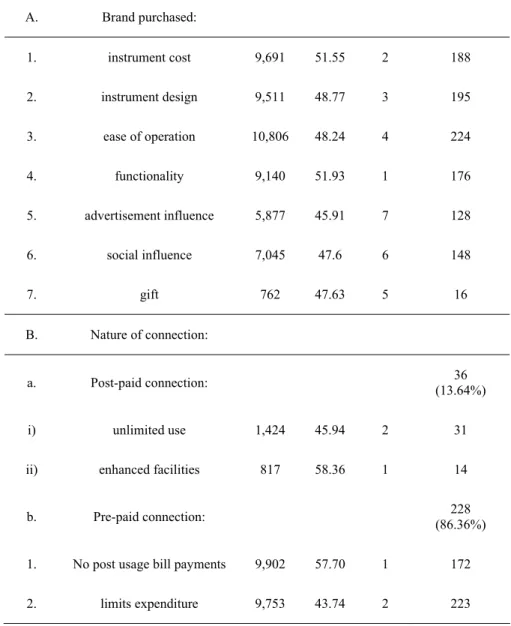
Table 10.4 contains the ranked reasons for the brand purchased and type of connection used in terms of post-paid (where usage bills are paid at the end of the month) or pre-paid (where cards are paid for usage beforehand for specific amounts according to the customer’s conveniences).
Sl. no Particulars Total score
Mean
score Rank Number responded
A. Brand purchased:
1. instrument cost 9,691 51.55 2 188
2. instrument design 9,511 48.77 3 195
3. ease of operation 10,806 48.24 4 224
4. functionality 9,140 51.93 1 176
5. advertisement influence 5,877 45.91 7 128
6. social influence 7,045 47.6 6 148
7. gift 762 47.63 5 16
B. Nature of connection:
a. Post-paid connection: 36
(13.64%)
i) unlimited use 1,424 45.94 2 31
ii) enhanced facilities 817 58.36 1 14
b. Pre-paid connection: 228
(86.36%) 1. No post usage bill payments 9,902 57.70 1 172
2. limits expenditure 9,753 43.74 2 223
Table 10.4. Reasons for choice of brand purchased and type of connection
Among the stated seven reasons for the brand of mobile phone purchased, instrument-related functionality, its cost, design and ease of operation were the top four priorities respectively, whereas factors such as the phone having been a gift, social influence and advertisement influence were assigned the subsequent ranks by the sample households.
The reasons for the nature of connection chosen, in terms of pre and post-paid connections, have also been examined. Pre-paid cell phone connections are found to be more popular among cell phone owners (86.36%) than post-paid connections (13.64%). As regards the main benefits of pre-paid connections, no post usage bill payment hassles and the limitation of expenditure to the value of the card purchased were quoted as the major benefits. The post-paid connection users ranked other facilities, for example, lower cost of calls, cheaper SMS and longer distance accessibility at lower costs, followed by unlimited use, as the major benefits.
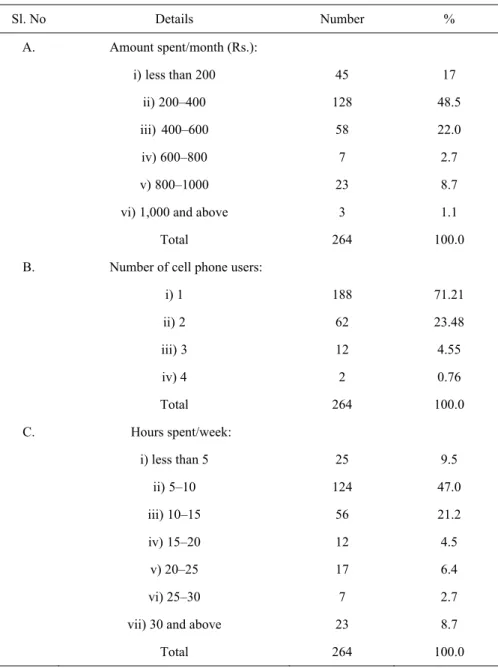
Table 10.5 gives details on cell phone usage intensity among the sample owner households. The usage intensity is measured in terms of the amount spent per month on cell phone use, the number of family members using the services and the number of hours that the cell phone is used per week.
Sl. No Details Number % A. Amount spent/month (Rs.):
i)less than 200 45 17
ii)200–400 128 48.5
iii) 400–600 58 22.0
iv)600–800 7 2.7
v)800–1000 23 8.7
vi)1,000 and above 3 1.1
Total 264 100.0
B. Number of cell phone users:
i) 1 188 71.21
ii)2 62 23.48
iii)3 12 4.55
iv) 4 2 0.76
Total 264 100.0
C. Hours spent/week:
i) less than 5 25 9.5
ii)5–10 124 47.0
iii)10–15 56 21.2
iv)15–20 12 4.5
v) 20–25 17 6.4
vi) 25–30 7 2.7
vii) 30 and above 23 8.7
Total 264 100.0
US $1 = Rs. 44.
Table 10.5. Cell phone usage intensity
The expenditure on monthly bills for cell phone service use shows that nearly half the sample households (48.5%) spend between Rs. 200 and 400, followed by 22% who spend between Rs. 400 and 600 and 8.7% who spend between Rs. 800 and 1,000. Less than 3% spend between Rs. 600 and 800 (2.7%) and only 1.1% spend Rs. 1,000 and above.
As regards the number of cell phone users per household, more than two-thirds of households were single-user households (71.21%), while less than a quarter (23.48%) had two users (23.48%). In less than 5% of households there were three users (4.55%), while only about 1% of households had four users (0.76%).
The number of hours of cell phone use reveals that more than two-thirds of households used it for 5 to 15 hours per week, 47% for 5 to 10 hours a week and 21% for 10–15 hours per week. Only 8.7% of the households used cell phones for 25–30 hours per week, while the remaining 13.6% used it for 15–30 hours per week.
About 9.5% of households used cell phones for less than 5 hours per week.
Thus, the usage intensity shows that the average monthly bill of the sample cell phone user household was quite low and the hours of its use per week ranged between 5 and 15 hours for the majority of them. Besides, the number of users were largely one or two per household.
Table 10.6 shows the ranked reasons cell phone usage variety among the sample owner households.
Sl. No. Particulars Total score
Mean
score Rank Number responded 1. To maintain personal
contact 7,114 58.8 1 121
2. Oral communication 4,770 54.2 2 88
3. SMS 9,257 47.0 4 197
4. Business 5,659 50.1 3 113
5. Other services 7,542 46.7 5 155
Table 10.6. Reasons for cell phone usage
As regards the types of usage, the sample households quoted to maintain personal contact as the first reason, while the second most important reason was for oral communication and the third was for business communication. SMS and other services (such as entertainment) were ranked fourth and fifth respectively.
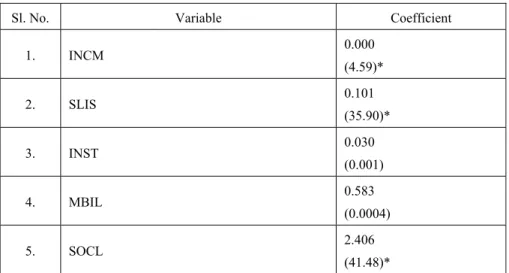
Table 10.7 shows the direct effects of income, price and social influence on the household’s decision to own a cell phone.
Sl. No. Variable Coefficient
1. INCM 0.000
(4.59)*
2. SLIS 0.101
(35.90)*
3. INST 0.030
(0.001)
4. MBIL 0.583
(0.0004)
5. SOCL 2.406
(41.48)*
Note: The figures in the parentheses are t–values; * indicates statistical significance at 1% level.
Table 10.7. Direct effects on cell phone ownership
The table reveals the effect that income elasticity and standard of living have on cell phone ownership to be positive and significant. It indicates that a rise in income and standard of living encourages a household to own a cell phone. The price elasticity of the instrument and user bills is also positive, but not significant. This implies that an increase in instrument price or cell phone usage bills does not significantly influence the decision to own a cell phone. This could be because the benefits of cell phone ownership are far greater in comparison to the costs and expenses of owning the phone.
In addition, the effect of social influence of neighbors, friends, or relatives on cell phone ownership emerges as positive and highly significant, thus confirming the validity of the SI hypothesis in the context of the study area.
10.4. Conclusion
In the wake of growing consumerism in the globalization era, this chapter attempts to identify the factors influencing the probability of cell phone ownership among Indian households. In this context, a case study of the Pondicherry region in South India was conducted by interviewing a random sample of 350 households during March–June 2006. The study also examined the cell phone usage intensity and types of usage among cell phone users (264), as well as verifying the relevance of the social influence model to the study area. The objectives of the chapter have been analyzed using simple averages, percentages, Garret ranking techniques and simple and multiple logistic regressions.
Although there are not many variations in the socio-economic characteristic features of the cell-phone-owning and non-owning households, the empirical results of the study revealed the probability of cell phone ownership to be positively and significantly influenced by both economic (standard of living) and social influence factors. In addition, the majority of the cell phone owners possessed Nokia instruments brand and preferred less expensive instruments. Further, pre-paid connections were more popular, owing to reasons such as no post-bill payments and limited bill expenses.
Usage intensity revealed that for the majority of cell phone owners, phone bills were quite low, the phone was used for an average of 5–15 hours per week and the phones were largely used by one or two members of the household. Usage variety indicated that the phones were mostly used for maintaining personal contacts, for oral communication, business communication and SMS.
Income elasticity and the effects of living standards and social influence were revealed to be the strongest factors among the sample households that encouraged the decisions to own cell phones. Thus, the study validates the social influence hypothesis in the context of the study area.
Cell phones are a cheaper, more user-friendly, economic, efficient and convenient means of communication and are used for micro-coordination and partial hyper-coordination by the sample households in the Pondicherry region. The consumer behavior with respect to cell phone ownership is largely influenced by the economic status of the household and social influence.
10.5. References
[ALE 00] ALEXANDER, PS (2000), “Teens and mobile phones growing-up together:
Understanding the reciprocal influences on the development of identity”, paper presented at the Wireless World Workshop, University of Surrey, Surrey.
[BHA 03] BHATTACHARYA, M (2003), “Telecom sector in India: Vision 2020”, background paper submitted to the committee on India: Vision 2020, Planning Commission, Government of India, New Delhi.
[CAL 04] CALLEGARO, M and TERESIO, POGGIO(2004), “Where can I call you? The mobile (phone) revolution and its impact on survey research and coverage error: A discussion of the Italian case”, in Proceedings ISARC 33 VI International Conference on Logic and Methodology: Recent Development and Application in Social Research Methodology, Amsterdam.
[CAM 03] CAMPBELL, SW and RUSSO, TC (2003), “The social construction of mobile telephony: an application of the social influence model to perceptions and uses of mobile phones within personal communication networks”, Communication Monographs, vol 70, no 4, December, pp 317–34.
[FUL 90] FULK, J, SCHMITZ, J and STEINFIELD,CW (1990), “A social influence model of technology use”, in Fulk, J and Steinfield, CW (eds), Organizations and Communication Technology, Newbury Park, CA: Sage, pp 117–39.
[FUL 93] FULK, J (1993) “Social construction of communication technology”, Academy of Management Journal, vol. 36, pp 921–50.
[FUL 95] FULK, J, SCHMITZ, J and RYU, D(1995), “Cognitive elements in the social construction of technology”, Management Communication Quarterly, vol 8, pp 259–88.
[GAN 01] GANT, D and KIESLER, S (2001), “Blurring the boundaries: cell phones, mobility and the line between work and personal life”, in Brown, B, Green, N and Harper, R (eds), Wireless World: Social and International Aspects of the Mobile Age, London: Springer, pp 121–32.
[GAR 69] GARRET, HE and WOODWORTH, RS (1969), Statistics in Psychology and Education, Bombay: Vakils, Feffer and Simons Private Ltd.
[GES 04] GESER, H(2004), “Towards a sociological theory of the mobile phone”, University of Zurich, May, http://Socio.ch/mobile/t-geser1.pdf, accessed on 25 June 2006.
[GOI 02] GOVERNMENT OF INDIA (2002), Annual Report 2001–2002, New Delhi:
Ministry of Communications and Information Technology, Department of Telecommunications.
[GRE 03] GREEN, N(2003), “Outwardly mobile: Young people and mobile technologies”, in Katz, JE (ed.), Machines that Become Us: The Social Context of Communication Technology, New Brunswick, New Jersey: Transaction Publishers, pp 210–18.
[HUL 01] HULME, M and PETERS, S (2001), “Me, my phone and I: The role of the mobile phone”, CHI 2001 Workshop: Mobile Communication: Understanding Users, Adoption and Design, Seattle, http://www/cs/colorodo.edu/paten/chi_workshop
[HUR 05] HURME, P (2005), “Mobile communication and work practices in knowledge- based organisations”, Human Technology, vol 1, no 1, April, pp 101–08.
[ITU 02] International Telecommunication Union (2002), World Communication Development Report 2002, Geneva.
[ITU 04] International Telecommunication Union (2004), “World Telecommunication Indicators”, World Telecommunication Development Report 2004, Geneva.
[JAN 06] Jan Samachar: Multilingual News and Feature Agency Devoted to Rural Issues (2006), “Telecommunication in India: A Review”, New Delhi.
[KAK 03] KAKIHARA, M(2003), “Emerging work practices of ICT – enabled mobile professionals”, unpublished doctoral dissertation, London School of Economics and Political Science, University of London, retrieved from www.Kakihara.org on 10 April 2006.
[KAT 02] KATZ, JE and AAKHUS, MA(2002), “Introduction: framing the issues”, in Katz, JE and Aakhus, MA (eds), Perpetual Contact Mobile Communication, Private Talk, Public Performance, Cambridge: Cambridge University Press, pp 1–14.
[KOP 00] KOPOMAA, T (2000), The City in Your Pocket: Birth of the Mobile Information Society, Helsinki: University Press.
[LIN 96] LING, R (1996), “One can talk about common manners! The use of mobile telephones in inappropriate situations”, Report No 32/96, Kjeller, Norway: Technor Research and Development.
[LIN 99] LING, R and YTTRI, B(1999), “Nobody sits at home and waits for the telephone to ring: Micro and hyper coordination through the use of the mobile phone”, Report No.
30/99, Kjeller, Norway: Technor Research and Development.
[LIN 02] LING, R and YTTRI, B (2002), “Hyper coordination via mobile phones in Norway”, in Katz, JE and Aakhus, M (eds) Perpetual Contact: Mobile Communication, Private Talk, Public Performance, Cambridge: Cambridge University Press, pp 139–69.
[MAS 04] MASSINI, S (2004), “The diffusion of mobile telephony in Italy and the UK: an empirical investigation”, Economics of Innovation and New Technology, vol 13, no 3, April, pp 251–77.
[PAL 00] PALEN, L, SALZMAN, M and YOUNGS, E (2000), “Going wireless: behavior and practice of new mobile phone users”, ACM CSCW 2000 Conference on Computer Supported Cooperative Work Proceedings, Philadelphia, P.A., New York: Association of Computing Machinery Inc, pp 201–10.
[PUR 02] PURO, J-P (2002), “Finland: a mobile culture”, in Katz, JE and Aakhus, MA (eds), Perpetual Contact: Mobile Communication, Private Talk, Pubic Performance, Cambridge: Cambridge University Press, pp 19–29.
[RAM 90] RAM, S and HYUNG-SHIK, J (1990), “The conceptualization and measurement of product usage”, Journal of the Academy of Marketing Science, vol 18, Winter, pp 67–
76.
[ROY 99] ROY, TK, JAYACHANDRAN, V, SUSHANTA, K and FEE, B (1999),
“Economic condition and fertility: is there a relationship?”, Economic and Political Weekly, vol 34, nos. 42 and 43, 1999, 16–23 October, pp 3041– 3046.
[SCH 06] SCHNEIDER, M (2006), “Updates”, View Journal, 5 September, p 1.
[SIN 06] SINGH, P (2006), “India cell phone story has a long way to go”, New Indian Express, 20 September, p 10.
[TAY 01] TAYLOR, AS and HARPER, R(2001), The Gift of the Gab?: A Design Oriented Sociology of Young People’s Use of “mobilZe!”, Guildford Publications, England.
[TOW 00] TOWNSEND, AM(2000), “Life in the real-time city: mobile telephone and urban metabolism”, Journal of Urban Technology, vol 7, no 2, pp 85–104.
10.6. Appendix
Scores for the variables used in the calculation of Standard of Living Index
Sl. No. Variables Scores
A. Household Amenities:
1. Separate room for cooking
Yes No
1 0
2. Type of house concrete tiled thatched
2 1 0
3. Source of lightning electricity
kerosene or gas or oil others
2 1 0
4. Fuel for cooking electricity or gas kerosene or coal others
2 1 0
5. Source of drinking water own well or pipe or hand pump public well or pipe or hand pump others
2 1 0