The relationship between these gamma rays and the complexity of beta spectra is discussed. 3 )- Detection of electrons in the clcud chamber in operation .. with 3J me O'Gfter type of spectrograph. The following discussion will give an order of magnitude of effects from the above sources.
The sensitivity limit of such a detector is almost reached when detecting the proton ions it has. However, the intensity of the available resources prohibits the use of the photographic method for our vwrk. Here we just want to highlight the pros and cons of this method.
Thus, the re is always a lower bound on the energy of the electrons that can be detected. L ounces of the c11rvature. The fact that this reduction is linear has to do with the focusing properties of the spectrograph.
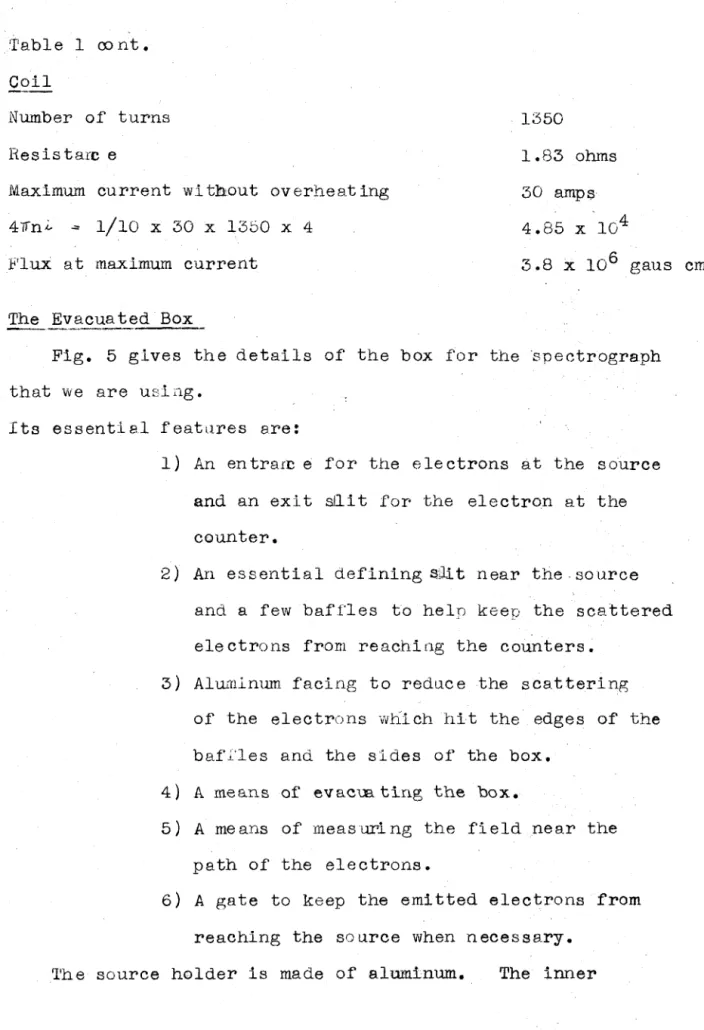
An entram e for the electrons at the source and an exit sllit for the electron at the
An essential defining s;lit near the. source and a few baffles to heln keep the scattered
Alurnlnum facing to reduce the scattering of the electrons vvhich hit the edges of the
A means of measuring the field near the path of the electrons
A gate to keep the emitted electrons from reaching the source when necessary
The slit pieces 1 and 2 are arranged so that no direct par- . tickles can get into the body of the box. They are spaced so as to limit the Qistrlbution which results from a . monochromatic line to the width of the slit at the counters. The baffles and &its are mounted on aluminum side pieces r and can be taken out of the box as a unit.
One side of the copper box is soldered to the edges of the box and the 0th side is screwed <.md vv bys. The field. inside the solenoid varies linearly with the current through i t, and the e.m.f. developed by the search coils is a llnabye function of the f Lelds they turn into. If the time the search coils ;7re rotated were extremely short compared to the period of the g~lvanometer, . the inaccuracy will be greatly reduced. In our case, .
If this were all that happened, the charge arriving at the wlre would be proportional to the ionization of the incoming particle. 1rhen the number of subsequent avalanches anu. thus.. the charge on the wire will have no simple relation to the ionization of the impinging particle.
STABILIZER OF NEHE:lll-HARPER CIRCUIT .. vacuum, in spectrograph from a sheet of cellophane. v~hi ch has only about 45 kev stopping power for e 1electrons. Vve found that cellophane is slightly porous, the porosity can be eliminated by coating the cellophane with a litJ.e. The foil is waxed between two brass discs which are screwed together and the whole counter box is closed - on a plate in the spectrum spectrum box with Apiezon Q grease. With about 70 volts in the primary of the 'trGnsformer' filter < ieli goes about 2000 vo 1 ts in stabilizer.
This voltage is then fed through a 57 and 10 megohm vacuum tube to the meter wire. Such a small increase in current through the VJ voltage divider amplifies the pentode to cause a larger voltage drop across the triode. With our stabilizer, a rise in the filtered voltage always results in a small rise in the output voltage.
A change in the primary voltage of 10 volts causes a change in the filtered voltage of about 200 volts and at the stabilized voltage a change of less than 5 volts. The third element of the power supply is the modified Neher-Harper-(16) circuit in which the walls of the counters are grounded. The tube is part of a voltage divider that consists of the 0.3 megohms, the tube and 4 megohms (via a milliammeter) to ground.
10 SINGLES IN
Geiger counters when actuated by a Neher-Harper circuit and Thyratrons are of the first type. Schiff (18) has glven, a simple loss correction method with flrst-type recorders. Using the hls method, we have constructed a curve that gives the losses as a function of count rate.
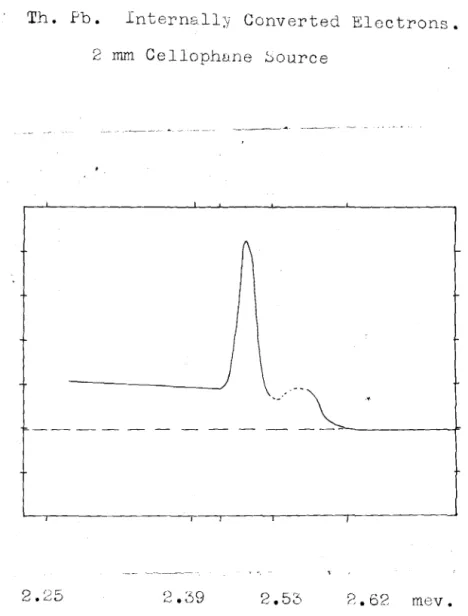
Where the output of the amplifier is connected to earphones instead of to the thyratron recorder, oo. However, it is notable that the counts do not go to zero between the end of the spectrum and the line. Moreover, if they are Compton electrons, their nwnber should depend on the nature of the source.
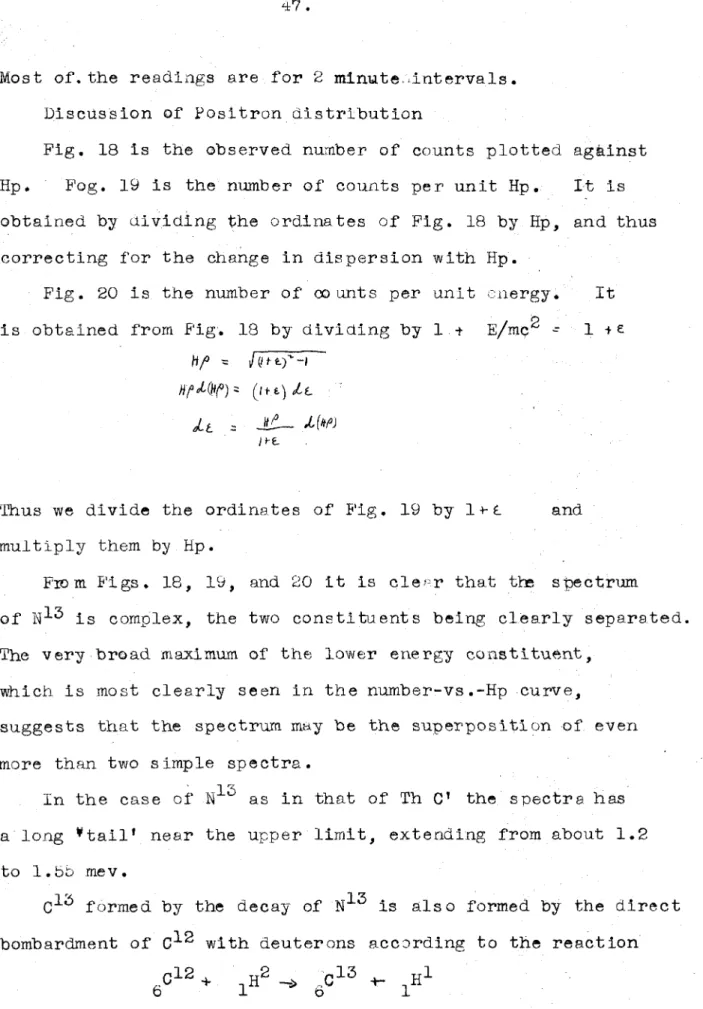
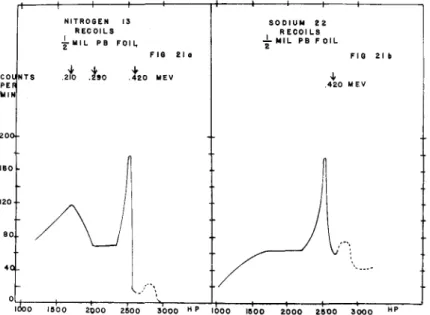
To get sources mounted on cellophane, a strip of cellophane was grown on .. top of the steel plate and subsequently removed. In the second case, we should be able to see the tail of the beta rs-y spectrB beyond the internal conversi:m line. The very broad maximum of the lower energy component, which is most clearly seen in the number-vs.-Hp curve,.
The proton group energy of this reaction was measured by Cockroft and ~'IEiton (31), and the neutron energy for the corresponding reaction forming Nl3 was measured by Bonner and Brubaker (32). His curve does not give the true relative intensity of garruna-ra;y and annihilation radiation. We examined the rero i l electron spectra up to 6 mev and found nothing above l.o mev.
In the case of the 0.5 mev gamma ray, another CD n effect contributes to the reduction in the number of cents. This foil has an electron stopping power of about 150 kev SD that some electrons at 420 kev were absorbed in the foil. These losses should be corrected for when determining the relative intensity of the 0.5 and 1.3 mev gamma rays.
In the center of the line will be the minimum value for the radius of the projected circle, f .