ANALYTICAL CHEMISTRY
SEVENTH EDITION
Gary D. Christian
University of Washington
Purnendu K. (Sandy) Dasgupta
University of Texas at Arlington
Kevin A. Schug
University of Texas at Arlington
To
Nikola from Gary—for your interests in science. You have a bright future,wherever your interests and talents take you
Philip W. West from Sandy—wherever you are Phil, sipping your martini with 1 ppm vermouth, you know how it was: For he said, I will give you, A shelter from the storm. . ..
Dad from Kevin—well its not hardcore P. Chem., but it is still quite useful. Thanks for your love, support, and guidance through the years
VP & Publisher: Petra Recter
Editorial Assistant: Ashley Gayle/Katherine Bull Senior Marketing Manager: Kristine Ruff
Designer: Kenji Ngieng
Associate Production Manager: Joyce Poh
This book was set in 10.5 Times Roman by Laserwords Private Limited and printed and bound by Courier Kendallville. The cover was printed by Courier Kendallville.
This book is printed on acid free paper.
Founded in 1807, John Wiley & Sons, Inc. has been a valued source of knowledge and understanding for more than 200 years, helping people around the world meet their needs and fulfill their aspirations. Our company is built on a foundation of principles that include responsibility to the communities we serve and where we live and work. In 2008, we launched a Corporate Citizenship Initiative, a global effort to address the environmental, social, economic, and ethical challenges we face in our business. Among the issues we are addressing are carbon impact, paper specifications and procurement, ethical conduct within our business and among our vendors, and community and charitable support. For more information, please visit our website:
www.wiley.com/go/citizenship.
Copyright©2014, 2004 John Wiley & Sons, Inc. All rights reserved. No part of this publication may be reproduced, stored in a retrieval system or transmitted in any form or by any means, electronic, mechanical, photocopying, recording, scanning or otherwise, except as permitted under Sections 107 or 108 of the 1976 United States Copyright Act, without either the prior written permission of the Publisher, or authorization through payment of the appropriate per-copy fee to the Copyright Clearance Center, Inc. 222 Rosewood Drive, Danvers, MA 01923, website www.copyright.com. Requests to the Publisher for permission should be addressed to the Permissions Department, John Wiley & Sons, Inc., 111 River Street, Hoboken, NJ 07030-5774, (201)748-6011, fax (201)748-6008, website http://www.wiley.com/go/permissions.
Evaluation copies are provided to qualified academics and professionals for review purposes only, for use in their courses during the next academic year. These copies are licensed and may not be sold or transferred to a third party. Upon completion of the review period, please return the evaluation copy to Wiley. Return
instructions and a free of charge return mailing label are available at www.wiley.com/go/returnlabel. If you have chosen to adopt this textbook for use in your course, please accept this book as your complimentary desk copy.
Outside of the United States, please contact your local sales representative.
Library of Congress Cataloging-in-Publication Data Christian, Gary D., author.
Analytical chemistry. -- Seventh edition / Gary D. Christian, University of Washington, Purnendu K. (Sandy) Dasgupta, University of Texas at Arlington, Kevin A. Schug, University of Texas at Arlington.
pages cm Includes index.
ISBN 978-0-470-88757-8 (hardback : alk. paper) 1. Chemistry, Analytic--Quantitative--Textbooks.
I. Dasgupta, Purnendu, author. II. Schug, Kevin, author. III. Title.
QD101.2.C57 2014 543--dc23
2013019926 Printed in the United States of America
10 9 8 7 6 5 4 3 2 1
Contents
Chapter 1
Analytical Objectives, or: What Analytical
Chemists Do 1
1.1 What Is Analytical Science?, 2 1.2 Qualitative and Quantitative Analysis:
What Does Each Tell Us?, 3
1.3 Getting Started: The Analytical Process, 6 1.4 Validation of a Method—You Have to
Prove It Works!, 15
1.5 Analyze Versus Determine—They Are Different, 16
1.6 Some Useful Websites, 16
Chapter 2
Basic Tools and Operations of Analytical
Chemistry 20
2.1 The Laboratory Notebook—Your Critical Record, 20
2.2 Laboratory Materials and Reagents, 23 2.3 The Analytical Balance—The
Indispensible Tool, 23
2.4 Volumetric Glassware—Also Indispensible, 30 2.5 Preparation of Standard Base Solutions, 42 2.6 Preparation of Standard Acid Solutions, 42 2.7 Other Apparatus—Handling and Treating
Samples, 43
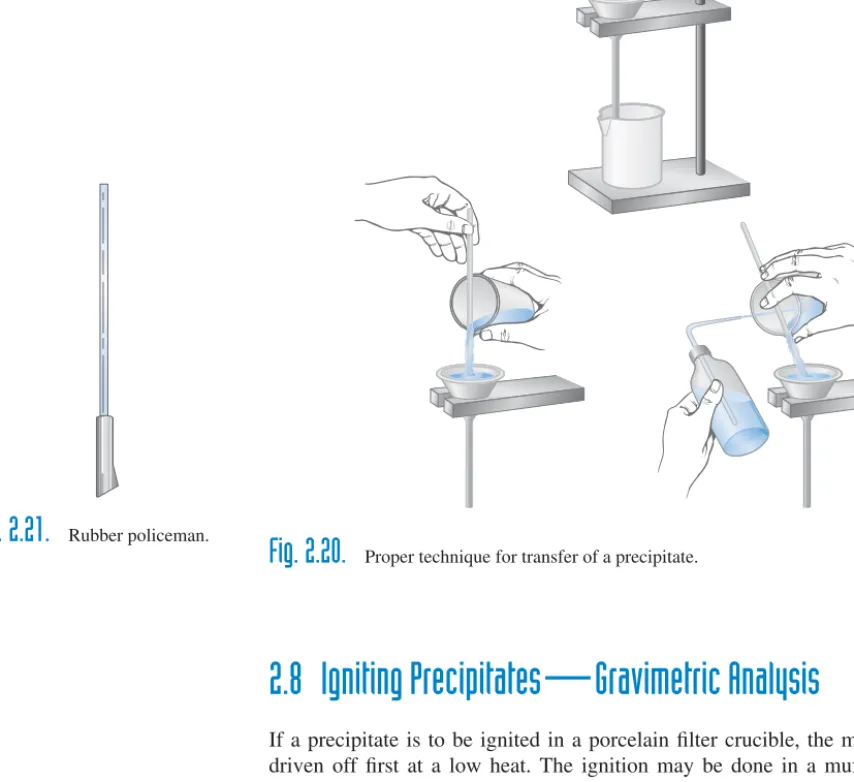
2.8 Igniting Precipitates—Gravimetric Analysis, 48 2.9 Obtaining the Sample—Is It Solid, Liquid,
or Gas?, 49
2.10 Operations of Drying and Preparing a Solution of the Analyte, 51
2.11 Laboratory Safety, 57
Chapter 3
Statistics and Data Handling in Analytical
Chemistry 62
3.1 Accuracy and Precision: There Is a Difference, 62
3.2 Determinate Errors—They Are Systematic, 63 3.3 Indeterminate Errors—They Are Random, 64 3.4 Significant Figures: How Many Numbers
Do You Need?, 65 3.5 Rounding Off, 71
3.6 Ways of Expressing Accuracy, 71 3.7 Standard Deviation—The Most Important
Statistic, 72
3.8 Propagation of Errors—Not Just Additive, 75 3.9 Significant Figures and Propagation of Error, 81 3.10 Control Charts, 83
3.11 The Confidence Limit—How Sure Are You?, 84 3.12 Tests of Significance—Is There a
Difference?, 86
3.13 Rejection of a Result: TheQTest, 95 3.14 Statistics for Small Data Sets, 98 3.15 Linear Least Squares—How to Plot the
Right Straight Line, 99
3.16 Correlation Coefficient and Coefficient of Determination, 104
3.17 Detection Limits—There Is No Such Thing as Zero, 105
3.18 Statistics of Sampling—How Many Samples, How Large?, 107
3.19 Powering a Study: Power Analysis, 110 3.20 Use of Spreadsheets in Analytical
Chemistry, 112
3.21 Using Spreadsheets for Plotting Calibration Curves, 117
iii
3.22 Slope, Intercept, and Coefficient of Determination, 118
3.23 LINEST for Additional Statistics, 119 3.24 Statistics Software Packages, 120
Chapter 4
Good Laboratory Practice: Quality Assurance and
Method Validation 132
4.1 What Is Good Laboratory Practice?, 133 4.2 Validation of Analytical Methods, 134 4.3 Quality Assurance—Does the Method Still
Work?, 143
4.4 Laboratory Accreditation, 144 4.5 Electronic Records and Electronic
Signatures: 21 CFR, Part 11, 145 4.6 Some Official Organizations, 146
Chapter 5
Stoichiometric Calculations: The Workhorse of
the Analyst 149
5.1 Review of the Fundamentals, 149 5.2 How Do We Express Concentrations
of Solutions?, 152
5.3 Expressions of Analytical Results—So Many Ways, 159
5.4 Volumetric Analysis: How Do We Make Stoichiometric Calculations?, 166 5.5 Volumetric Calculations—Let’s Use
Molarity, 169
5.6 Titer—How to Make Rapid Routine Calculations, 179
5.7 Weight Relationships—You Need These for Gravimetric Calculations, 180
Chapter 6
General Concepts of Chemical Equilibrium 188
6.1 Chemical Reactions: The Rate Concept, 188 6.2 Types of Equilibria, 190
6.3 Gibbs Free Energy and the Equilibrium Constant, 191
6.4 Le Chˆatelier’s Principle, 192
6.5 Temperature Effects on Equilibrium Constants, 192
6.6 Pressure Effects on Equilibria, 192 6.7 Concentration Effects on Equilibria, 193 6.8 Catalysts, 193
6.9 Completeness of Reactions, 193
6.10 Equilibrium Constants for Dissociating or Combining Species—Weak Electrolytes and Precipitates, 194
6.11 Calculations Using Equilibrium
Constants—Composition at Equilibrium?, 195 6.12 The Common Ion Effect—Shifting the
Equilibrium, 203
6.13 Systematic Approach to Equilibrium Calculations—How to Solve Any Equilibrium Problem, 204
6.14 Some Hints for Applying the Systematic Approach for Equilibrium Calculations, 208 6.15 Heterogeneous Equilibria—Solids Don’t
Count, 211
6.16 Activity and Activity Coefficients—
Concentration Is Not the Whole Story, 211 6.17 The Diverse Ion Effect: The
Thermodynamic Equilibrium Constant and Activity Coefficients, 217
Chapter 7
Acid–Base Equilibria 222
7.1 The Early History of Acid—Base Concepts, 222
7.2 Acid–Base Theories—Not All Are Created Equal, 223
7.3 Acid–Base Equilibria in Water, 225 7.4 The pH Scale, 227
7.5 pH at Elevated Temperatures: Blood pH, 231 7.6 Weak Acids and Bases—What Is the pH?, 232 7.7 Salts of Weak Acids and Bases—They
Aren’t Neutral, 234
7.8 Buffers—Keeping the pH Constant (or Nearly So), 238
7.9 Polyprotic Acids and Their Salts, 245 7.10 Ladder Diagrams, 247
7.11 Fractions of Dissociating Species at a Given pH:αValues—How Much of Each Species?, 248
7.12 Salts of Polyprotic Acids—Acid, Base, or Both?, 255
CONTENTS v
7.13 Physiological Buffers—They Keep You Alive, 261
7.14 Buffers for Biological and Clinical Measurements, 263
7.15 Diverse Ion Effect on Acids and Bases:cKa andcKb—Salts Change the pH, 266 7.16 log C—pH Diagrams, 266
7.17 Exact pH Calculators, 269
Chapter 8
Acid–Base Titrations 281
8.1 Strong Acid versus Strong Base—The Easy Titrations, 282
8.2 The Charge Balance Method—An Excel Exercise for the Titration of a Strong Acid and a Strong Base, 285
8.3 Detection of the End Point: Indicators, 288 8.4 Standard Acid and Base Solutions, 290 8.5 Weak Acid versus Strong Base—A Bit
Less Straightforward, 290
8.6 Weak Base versus Strong Acid, 295 8.7 Titration of Sodium Carbonate—A
Diprotic Base, 296
8.8 Using a Spreadsheet to Perform the Sodium Carbonate—HCl Titration, 298 8.9 Titration of Polyprotic Acids, 300 8.10 Mixtures of Acids or Bases, 302
8.11 Equivalence Points from Derivatives of a Titration Curve, 304
8.12 Titration of Amino Acids—They Are Acids and Bases, 309
8.13 Kjeldahl Analysis: Protein Determination, 310 8.14 Titrations Without Measuring Volumes, 312
Chapter 9
Complexometric Reactions and Titrations 322
9.1 Complexes and Formation
Constants—How Stable Are Complexes?, 322 9.2 Chelates: EDTA—The Ultimate Titrating
Agent for Metals, 325
9.3 Metal–EDTA Titration Curves, 331 9.4 Detection of the End Point:
Indicators—They Are Also Chelating Agents, 334
9.5 Other Uses of Complexes, 336
9.6 Cumulative Formation Constantsβand Concentrations of Specific Species in Stepwise Formed Complexes, 336
Chapter 10
Gravimetric Analysis and Precipitation
Equilibria 342
10.1 How to Perform a Successful Gravimetric Analysis, 343
10.2 Gravimetric Calculations—How Much Analyte Is There?, 349
10.3 Examples of Gravimetric Analysis, 353 10.4 Organic Precipitates, 353
10.5 Precipitation Equilibria: The Solubility Product, 355
10.6 Diverse Ion Effect on Solubility:Kspand Activity Coefficients, 361
Chapter 11
Precipitation Reactions and Titrations 366
11.1 Effect of Acidity on Solubility of Precipitates: Conditional Solubility Product, 366
11.2 Mass Balance Approach for Multiple Equilibria, 368
11.3 Effect of Complexation on Solubility:
Conditional Solubility Product, 372 11.4 Precipitation Titrations, 374
Chapter 12
Electrochemical Cells and Electrode
Potentials 383
12.1 What Are Redox Reactions?, 384 12.2 Electrochemical Cells—What
Electroanalytical Chemists Use, 384 12.3 Nernst Equation—Effects of
Concentrations on Potentials, 390 12.4 Formal Potential—Use It for Defined
Nonstandard Solution Conditions, 394 12.5 Limitations of Electrode Potentials, 395
Chapter 13
Potentiometric Electrodes and Potentiometry 399
13.1 Metal Electrodes for Measuring the Metal Cation, 400
13.2 Metal–Metal Salt Electrodes for Measuring the Salt Anion, 401 13.3 Redox Electrodes—Inert Metals, 402 13.4 Voltaic Cells without Liquid
Junction—For Maximum Accuracy, 404 13.5 Voltaic Cells with Liquid Junction—The
Practical Kind, 405
13.6 Reference Electrodes: The Saturated Calomel Electrode, 407
13.7 Measurement of Potential, 409 13.8 Determination of Concentrations from
Potential Measurements, 411
13.9 Residual Liquid-Junction Potential—It Should Be Minimized, 411
13.10 Accuracy of Direct Potentiometric Measurements—Voltage Error versus Activity Error, 412
13.11 Glass pH Electrode—Workhorse of Chemists, 413
13.12 Standard Buffers—Reference for pH Measurements, 418
13.13 Accuracy of pH Measurements, 420
13.14 Using the pH Meter—How Does It Work?, 421 13.15 pH Measurement of Blood—Temperature
Is Important, 422
13.16 pH Measurements in Nonaqueous Solvents, 423 13.17 Ion-Selective Electrodes, 424
13.18 Chemical Analysis on Mars using Ion-Selective Electrodes, 432
Chapter 14
Redox and Potentiometric Titrations 437
14.1 First: Balance the Reduction–Oxidation Reaction, 437
14.2 Calculation of the Equilibrium Constant of a Reaction—Needed to Calculate
Equivalence Point Potentials, 438 14.3 Calculating Redox Titration Curves, 441 14.4 Visual Detection of the End Point, 445 14.5 Titrations Involving Iodine: Iodimetry and
Iodometry, 447
14.6 Titrations with Other Oxidizing Agents, 452 14.7 Titrations with Other Reducing Agents, 454 14.8 Preparing the Solution—Getting the
Analyte in the Right Oxidation State before Titration, 454
14.9 Potentiometric Titrations (Indirect Potentiometry), 456
Chapter 15
Voltammetry and Electrochemical Sensors 466
15.1 Voltammetry, 467
15.2 Amperometric Electrodes—Measurement of Oxygen, 472
15.3 Electrochemical Sensors: Chemically Modified Electrodes, 472
15.4 Ultramicroelectrodes, 474
15.5 Microfabricated Electrochemical Sensors, 474 15.6 Micro and Ultramicroelectrode Arrays, 475
Chapter 16
Spectrochemical Methods 477
16.1 Interaction of Electromagnetic Radiation with Matter, 478
16.2 Electronic Spectra and Molecular Structure, 484 16.3 Infrared Absorption and Molecular
Structure, 489
16.4 Near-Infrared Spectrometry for Nondestructive Testing, 491 16.5 Spectral Databases—Identifying
Unknowns, 493
16.6 Solvents for Spectrometry, 493 16.7 Quantitative Calculations, 494 16.8 Spectrometric Instrumentation, 504 16.9 Types of Instruments, 519
16.10 Array Spectrometers—Getting the Entire Spectrum at Once, 522
16.11 Fourier Transform Infrared Spectrometers, 523 16.12 Near-IR Instruments, 525
16.13 Spectrometric Error in Measurements, 526 16.14 Deviation from Beer’s Law, 527
16.15 Fluorometry, 530 16.16 Chemiluminescence, 538 16.17 Fiber-Optic Sensors, 540
CONTENTS vii
Chapter 17
Atomic Spectrometric Methods 548
17.1 Principles: Distribution between Ground and Excited States—Most Atoms Are in the Ground State, 550
17.2 Flame Emission Spectrometry, 553 17.3 Atomic Absorption Spectrometry, 556 17.4 Sample Preparation—Sometimes
Minimal, 567
17.5 Internal Standard and Standard Addition Calibration, 567
17.6 Atomic Emission Spectrometry: The Induction Coupled Plasma (ICP), 569 17.7 Atomic Fluorescence Spectrometry, 574
Chapter 18
Sample Preparation: Solvent and Solid-Phase
Extraction 579
18.1 Distribution Coefficient, 579 18.2 Distribution Ratio, 580 18.3 Percent Extracted, 581
18.4 Solvent Extraction of Metals, 583 18.5 Accelerated and Microwave-Assisted
Extraction, 585
18.6 Solid-Phase Extraction, 586 18.7 Microextraction, 590
18.8 Solid-Phase Nanoextraction (SPNE), 593
Chapter 19
Chromatography: Principles and Theory 596
19.1 Countercurrent Extraction: The Predecessor to Modern Liquid Chromatography, 598
19.2 Principles of Chromatographic Separations, 603
19.3 Classification of Chromatographic Techniques, 604
19.4 Theory of Column Efficiency in Chromatography, 607
19.5 Chromatography Simulation Software, 616
Chapter 20
Gas Chromatography 619
20.1 Performing GC Separations, 620 20.2 Gas Chromatography Columns, 623 20.3 Gas Chromatography Detectors, 630 20.4 Temperature Selection, 638
20.5 Quantitative Measurements, 639 20.6 Headspace Analysis, 641 20.7 Thermal Desorption, 641 20.8 Purging and Trapping, 642 20.9 Small and Fast, 643
20.10 Separation of Chiral Compounds, 644 20.11 Two-Dimensional GC, 645
Chapter 21
Liquid Chromatography and Electrophoresis 649
21.1 High-Performance Liquid Chromatography, 651 21.2 Stationary Phases in HPLC, 654
21.3 Equipment for HPLC, 665 21.4 Ion Chromatography, 692 21.5 HPLC Method Development, 700 21.6 UHPLC and Fast LC, 701
21.7 Open Tubular Liquid Chromatography (OTLC), 702
21.8 Thin-Layer Chromatography, 702 21.9 Electrophoresis, 708
21.10 Capillary Electrophoresis, 711
21.11 Electrophoresis Related Techniques, 724
Chapter 22
Mass Spectrometry 735
22.1 Principles of Mass Spectrometry, 735 22.2 Inlets and Ionization Sources, 740
22.3 Gas Chromatography–Mass Spectrometry, 741 22.4 Liquid Chromatography–Mass
Spectrometry, 746
22.5 Laser Desorption/Ionization, 750 22.6 Secondary Ion Mass Spectrometry, 752 22.7 Inductively Coupled Plasma–Mass
Spectrometry, 753
22.8 Mass Analyzers and Detectors, 753 22.9 Hybrid Instruments and Tandem Mass
Spectrometry, 764
Chapter 23
Kinetic Methods of Analysis 769
23.1 Kinetics—The Basics, 769 23.2 Catalysis, 771
23.3 Enzyme Catalysis, 772
Chapter 24
Automation in Measurements 784
24.1 Principles of Automation, 784
24.2 Automated Instruments: Process Control, 785 24.3 Automatic Instruments, 787
24.4 Flow Injection Analysis, 789 24.5 Sequential Injection Analysis, 791 24.6 Laboratory Information Management
Systems, 792
Available on textbook website: www.wiley.com/college/christian
Chapter 25
Clinical Chemistry C1
25.1 Composition of Blood, C1
25.2 Collection and Preservation of Samples, C3 25.3 Clinical Analysis—Common
Determinations, C4 25.4 Immunoassay, C6
Available on textbook website: www.wiley.com/college/christian
Chapter 26
Environmental Sampling and Analysis EN1
26.1 Getting a Meaningful Sample, EN1 26.2 Air Sample Collection and Analysis, EN2 26.3 Water Sample Collection and Analysis, EN9 26.4 Soil and Sediment Sampling, EN11
26.5 Sample Preparation for Trace Organics, EN12 26.6 Contaminated Land Sites—What Needs to
Be Analyzed?, EN12
26.7 EPA Methods and Performance-Based Analyses, EN13
Available on textbook website: www.wiley.com/college/christian
Chapter G
Century of the Gene—Genomics and
Proteomics: DNA Sequencing and Protein Profiling G1
G.1 Of What Are We Made?, G1 G.2 What Is DNA?, G3
G.3 Human Genome Project, G3 G.4 How Are Genes Sequenced?, G5 G.5 Replicating DNA: The Polymerase Chain
Reaction, G6
G.6 Plasmids and Bacterial Artificial Chromosomes (BACs), G7 G.7 DNA Sequencing, G8
G.8 Whole Genome Shotgun Sequencing, G11 G.9 Single-Nucleotide Polymorphisms, G11 G.10 DNA Chips, G12
G.11 Draft Genome, G13
G.12 Genomes and Proteomics: The Rest of the Story, G13
APPENDIX A LITERATURE OF ANALYTICAL
CHEMISTRY 794
APPENDIX B REVIEW OF MATHEMATICAL OPERATIONS:
EXPONENTS, LOGARITHMS, AND THE QUADRATIC
FORMULA 797
APPENDIX C TABLES OF CONSTANTS 801
Table C.1 Dissociation Constants for Acids, 801 Table C.2a Dissociation Constants for Basic
Species, 802
Table C.2b Acid Dissociation Constants for Basic Species, 803
Table C.3 Solubility Product Constants, 803 Table C.4 Formation Constants for Some
EDTA Metal Chelates, 805 Table C.5 Some Standard and Formal
Reduction Electrode Potentials, 806 Available on textbook website: www.wiley.com/college/christian
APPENDIX D SAFETY IN THE LABORATORY S1
CONTENTS ix
Available on textbook website: www.wiley.com/college/christian
APPENDIX E PERIODIC TABLES ON THE WEB P1 APPENDIX F ANSWERS TO PROBLEMS 808
Available on textbook website: www.wiley.com/college/christian
Experiments E1
Use of Apparatus
Experiment 1 Use of the Analytical Balance, E1 Experiment 2 Use of the Pipet and Buret and
Statistical Analysis, E2 Experiment 3 Analysis of Volumetric
Measurements Using
Spectrophotometric Microplate Readers and Spreadsheet Calculations, E4
Gravimetry
Experiment 4 Gravimetric Determination of Chloride, E6
Experiment 5 Gravimetric Determination of SO3
in a Soluble Sulfate, E9 Experiment 6 Gravimetric Determination of
Nickel in a Nichrome Alloy, E11
Acid–Base Titrations
Experiment 7 Determination of Replaceable Hydrogen in Acid by Titration with Sodium Hydroxide, E12 Experiment 8 Determination of Total Alkalinity
of Soda Ash, E14
Experiment 9 Determination of Aspirin Using Back Titration, E16
Experiment 10 Determination of Hydrogen Carbonate in Blood Using Back-Titration, E18
Complexometric Titration
Experiment 11 Determination of Water Hardness with EDTA, E19
Precipitation Titrations
Experiment 12 Determination of Silver in an Alloy: Volhard’s Method, E21
Experiment 13 Determination of Chloride in a
Soluble Chloride: Fajans’ Method, E23
Potentiometric Measurements
Experiment 14 Determination of the pH of Hair Shampoos, E24
Experiment 15 Potentiometric Determination of Fluoride in Drinking Water Using a Fluoride Ion-Selective Electrode, E25
Reduction–Oxidation Titrations
Experiment 16 Analysis of an Iron Alloy or Ore by Titration with Potassium Dichromate, E27
Experiment 17 Analysis of Commercial
Hypochlorite or Peroxide Solution by Iodometric Titration, E30 Experiment 18 Iodometric Determination of
Copper, E32
Experiment 19 Determination of Antimony by Titration with Iodine, E34 Experiment 20 Microscale Quantitative Analysis
of Hard-Water Samples Using an Indirect Potassium Permanganate Redox Titration, E36
Potentiometric Titrations
Experiment 21 pH Titration of Unknown Soda Ash, E38
Experiment 22 Potentiometric Titration of a
Mixture of Chloride and Iodide, E40
Spectrochemical Measurements
Experiment 23 Spectrophotometric Determination of Iron, E41
Experiment 24 Spectrophotometric Determination of Iron in Vitamin Tablets Using a 96 Well Plate Reader, E43 Experiment 25 Determination of Nitrate Nitrogen
in Water, E46
Experiment 26 Spectrophotometric Determination of Lead on Leaves Using Solvent Extraction, E47
Experiment 27 Spectrophotometric Determination of Inorganic Phosphorus in Serum, E48 Experiment 28 Spectrophotometric Determination
of Manganese and Chromium in Mixture, E50
Experiment 29 Spectrophotometric Determination of Manganese in Steel Using a 96 Well Plate Reader, E52
Experiment 30 Ultraviolet Spectrophotometric Determination of Aspirin, Phenacetin, and Caffeine in APC Tablets Using Solvent Extraction, E54 Experiment 31 Infrared Determination of a
Mixture of Xylene Isomers, E56 Experiment 32 Fluorometric Determination of
Riboflavin (Vitamin B2), E57
Atomic Spectrometry Measurements
Experiment 33 Determination of Calcium by Atomic Absorption
Spectrophotometry, E57 Experiment 34 Flame Emission Spectrometric
Determination of Sodium, E60
Solid-Phase Extraction and Chromatography
Experiment 35 Solid-Phase Extraction with Preconcentration, Elution, and Spectrophotometric Analysis, E61 Experiment 36 Thin-Layer Chromatography
Separation of Amino Acids, E67 Experiment 37 Gas Chromatographic Analysis of
a Tertiary Mixture, E69 Experiment 38 Qualitative and Quantitative
Analysis of Fruit Juices for Vitamin C Using
High-Performance Liquid Chromatography, E70
Experiment 39 Analysis of Analgesics Using High-Performance Liquid Chromatography, E71
Mass Spectrometry
Experiment 40 Capillary Gas
Chromatography-Mass Spectrometry, E72
Kinetic Analysis
Experiment 41 Enzymatic Determination of Glucose in Blood, E74
Flow Injection Analysis
Experiment 42 Characterization of Physical Parameters of a Flow Injection Analysis System, E76
Experiment 43 Single-Line FIA:
Spectrophotometric Determination of Chloride, E79
Experiment 44 Three-Line FIA:
Spectrophotometric Determination of Phosphate, E80
Team Experiments
Experiment 45 Method Validation and Quality Control Study, E82
Experiment 46 Proficiency Testing:
Determination of z Values of Class Experiments, E84
Index 815
Preface
“Teachers open the door, but it is up to you to enter” —Anonymous
T
his edition has two new coauthors, Purnendu (Sandy) Dasgupta and Kevin Schug, both from the University of Texas at Arlington. So the authorship now spans three generations of analytical chemists who have each brought their considerable expertise in both teaching and research interests to this book. While all chapters have ultimately been revised and updated by all authors, the three authors have spearheaded different tasks. Among the most notable changes are the following: The addition of a dedicated chapter on mass spectrometry (Chapter 22) by Kevin. Sandy provided complete rewrites of the chapters on spectrochemical methods (Chapter 16) and atomic spectrometric methods (Chapter 17), and gas and liquid chromatography (Chapters 20 and 21), and added many new Excel problems and exercises. Gary compiled and organized all old and new supplementary materials for the textbook companion website and added QR codes for selected website materials, and he prepared the PowerPoint presentations of figures and tables.WHO SHOULD USE THIS TEXT?
This text is designed for college students majoring in chemistry and in fields related to chemistry. It is written for an undergraduate quantitative analysis course. It necessarily contains more material than normally can be covered in a one-semester or one-quarter course, so that your instructor can select those topics deemed most important. Some of the remaining sections may serve as supplemental material.
Depending on how a quantitative analysis and instrumental analysis sequence is designed, it may serve forboth courses. In any event, we hope you will take time to read some sections that look interesting to you that are not formally covered. They can certainly serve as a reference for the future.
WHAT IS ANALYTICAL CHEMISTRY?
Analytical chemistryis concerned with the chemical characterization of matter, both qualitative and quantitative. It is important in nearly every aspect of our lives because chemicals make up everything we use.
This text deals with the principles and techniques of quantitative analysis, that is, how to determine how much of a specific substance is contained in a sample.
You will learn how to design an analytical method, based on what information is needed or requested (it is important to know what that is, and why!), how to obtain a laboratory sample that is representative of the whole, how to prepare it for analysis, what measurement tools are available, and the statistical significance of the analysis.
xi
Analytical chemistry becomes meaningful when you realize that a blood analysis may provide information that saves a patient’s life, or that quality control analysis assures that a manufacturer does not lose money from a defective product.
WHAT’S NEW TO THIS EDITION?
This seventh edition is extensively rewritten, offering new and updated material. The goal was to provide the student with a foundation of the analytical process, tools, and computational methods and resources, and to illustrate with problems that bring realism to the practice and importance of analytical chemistry. We take advantage of digital technologies to provide supplementary material, including videos, website materials, spreadsheet calculations, and so forth (more on these below). We introduce the chapters with examples of representative uses of a technique, what its unique capabilities may be, and indicate what techniques may be preferred or limited in scope.
The beginning of each chapter lists key learning objectives for the chapter, with page numbers for specific objectives. This will help students focus on the core concepts as they read the chapter.
Here are some of the new things:
● Professors Favorite Examples and Problems.We asked professors and prac- ticing analytical chemists from around the world to suggest new analytical examples and problems, especially as they relate to real world practice, that we could include in this new edition. It is with appreciation and pleasure that we thank the many that have generously provided interesting and valuable examples and problems. We call theseProfessor’s Favorite Examples, andProfessor’s Favorite Problems, and they are annotated within the text by a margin element . We have included these in the text where appropriate and as space allows, and have placed some on the text website. We hope you find these interesting and, as appropriate, are challenged by them.
Our special thanks go to the following colleagues who have contributed problems, analytical examples, updates, and experiments:
● Christine Blaine, Carthage College
● Andre Campiglia, University of Central Florida
● David Chen, University of British Columbia
● Christa L. Colyer, Wake Forest University
● Michael DeGranpre, University of Montana
● Mary Kate Donais, Saint Anselm College
● Tarek Farhat, University of Memphis
● Carlos Garcia, The University of Texas at San Antonio
● Steven Goates, BrighhamYoung University
● Amanda Grannas, Villanova University
● Peter Griffiths, University of Idaho
● Christopher Harrison, San Diego State University
● James Harynuk, University of Alberta
● Fred Hawkridge, Virginia Commonwealth University
● Yi He, John Jay College of Criminal Justice, The City University of New York
● Charles Henry, Colorado State University
● Gary Hieftje, Indiana University
● Thomas Isenhour, Old Dominion University
● Peter Kissinger, Purdue University
● Samuel P. Kounaves, Tufts University
● Ulrich Krull, University of Toronto
● Thomas Leach, University of Washington
● Dong Soo Lee, Yonsei University, Seoul, Korea
● Milton L. Lee, Brigham Young University
● Wen-Yee Lee, University of Texas at El Paso
● Shaorong Liu, University of Oklahoma
● Fred McLafferty, Cornell University
● Michael D. Morris, University of Michigan
● Noel Motta, University of Puerto Rico, R´ıo Piedras
● Christopher Palmer, University of Montana
● Dimitris Pappas, Texas Tech University
● Aleeta Powe, University of Louisville
● Alberto Rojas-Hern´andez, Universidad Aut´o- noma Metropolitana-Iztapalapa, Mexico
PREFACE xiii
● Alexander Scheeline, University of Illinois
● W. Rudolph Seitz, University of New Hampshire
● Paul S. Simone, Jr., University of Memphis
● Nicholas Snow, Seton Hall University
● Wes Steiner, Eastern Washington University
● Apryll M. Stalcup, City University of Dublin, Ireland
● Robert Synovec, University of Washington
● Galina Talanova, Howard University
● Yijun Tang, University of Wisconsin, Oshkosh
● Jon Thompson, Texas Tech University
● Kris Varazo, Francis Marion University
● Akos Vertes, George Washington University
● Bin Wang, Marshall University
● George Wilson, University of Kansas
● Richard Zare, Stanford University
● Mass spectrometry, especially when used as a hyphenated technique with chro- matography, is increasingly a routine and powerful analytical tool, and a new chapter (Chapter 22) is dedicated to this topic. Likewise, liquid chromatog- raphy, includingion chromatographyfor anion determinations, is one of the most widely used techniques today, even surpassing gas chromatography. There are a wide variety of options of systems, instruments, columns, and detectors available, making selection of a suitable system or instrument a challenge for different applications. The present liquid chromatography chapter (Chapter 21) uniquely provides comprehensive coverage within the scope of an undergrad- uate text that not only gives the fundamentals of various techniques, how they evolved, and their operation, but also what the capabilities of different systems are and guidance for selecting a suitable system for a specific application.
● Revised chapters. All chapters have been revised, several extensively, especially those dealing with instrumentation to include recent technological innovations, as done for the liquid chromatography chapter. These include thespectrochemical chapter (16), theatomic spectrometric chapter (17), and thegas chromatog- raphy chapter (20). State-of-the-art technologies are covered. Some of this material and that of other chapters may be appropriate to use in anInstrumental Analysis course, as well as providing the basics for the quantitative analysis course; your instructor may assign selected sections for your course.
● Historical information is added throughout to put into perspective how the tools we have were developed and evolved. Some is this is included inmargin picturesand notes, showing pioneers in development of our profession.
● Videos of Excel Programs.Major additions to the text and the text’s website supplemental material include powerful Excel programs to perform complicated calculations, and to create plots of titration curves, alpha vs. pH, logC vs. pH, etc. We have included video tutorials created by students of Professor Dasgupta to illustrate the use of many of these. The following videos, by chapter and in order of page appearance, with page numbers listed, are available on the text website. We have also created QR Codes for these in each chapter (see below) for those who want to access them on their smartphones. You will find these useful as you experiment with Excel and its power.
Chapter 3 1. Solver, 87
2. Data Analysis Regression, 87, 120 3. F-test, 88
4. t-test for Paired Samples, 94 5. Paired t-test from Excel, 94 6. Plotting in Excel, 102, 118
7. Error bars, 102
8. Introduction to Excel, 113 9. Absolute Cell Reference, 115 10. Average, 116
11. STDEV, 116
12. Intercept Slope and r-square, 119 13. LINEST, 120
Chapter 6
1. Goal Seek Equilibrium, 201 2. Goal Seek Problem 6.2, 219 Chapter 7
1. Goal Seek pH NH4F, 238 2. Goal Seek mixture, 244
Chapter 8
1. Excel H3PO4titration curve, 302 Chapter 9
1. H4Y alpha plot Excel 1, 328 2. H4Y alpha plot Excel 2, 328 3. Example 9.6, 339
Thanks are due to the following students at the University of Texas as Arlington for their contributions: Barry Akhigbe, Jyoti Birjah, Rubi Gurung, Aisha Hegab, Akinde Kadjo, Karli Kirk, Heena Patel, Devika Shakya, and Mahesh Thakurathi.
OTHER MODIFICATIONS TO EXISTING CONTENT
It has been almost ten years since the last edition was published and since that time, much has changed! This seventh edition ofAnalytical Chemistryis extensively revised and updated, with new materials, new problems and examples, and new references.
● Spreadsheets.Detailed instructions are given on how to use and take advantage of spreadsheets in analytical calculations, plotting, and data processing. But the introductory material has been moved to the end of Chapter 3 as a separate unit, so that it can be assigned independently if desired, or treated as auxiliary material. The use of Excel Goal Seek and Excel Solver is introduced for solving complex problems and constructing titration curves (see below). Mastery of these powerful tools will allow students to tackle complex problems. Several useful programs introduced in the chapters are placed on the text website and instructions are given for applying these for plotting titration curves, derivative titrations, etc. by simply inputting equilibrium constant data, concentrations, and volumes.
● References.There are numerous recommended references given in each chapter, and we hope you will find them interesting reading. The late Tomas Hirschfeld said you should read the very old literature and the very new to know the field.
We have deleted a number of outdated references, updating them with new ones.
Many references are for classical, pioneering reports, forming the basis of current methodologies, and these remain.
● Material moved to the text website.As detailed elsewhere, we have moved certain parts to the textwebsiteas supplemental material and to make room for updating material on the techniques to be used. This includes:
● Thesingle pan balance(Chapter 2) andnormality calculations(Chapter 5), which may still be used, but in a limited capacity.
● Theexperiments.
● Auxiliary spreadsheet calculations from different chapters are posted on the website.
● Chapters dealing with specific applications of analytical chemistry are now on the text website for those interested in pursuing these topics. These are Clinical Chemistry (Chapter 25), and Environmental Sampling and Analysis(Chapter 26).
● Analytical chemistry played a key role in the completion of the historic Human Genome Project, and theGenomics and Proteomics chapterdocuments how.
This material is not mainstream in the quantitative analysis course, so it has been moved to the website as Chapter G. It is available there for the interested student or for professor assignment.
PREFACE xv
SPREADSHEETS
Spreadsheets (usingExcel) are introduced and used throughout the text for performing computations, statistical analysis, and graphing. Many titration curves are derived using spreadsheets, as are the calculations ofα-values and plots ofα-pH curves, and of logarithm concentration diagrams. The spreadsheet presentations are given in a
“user-friendly” fashion to make it easier for you to follow how they are set up.
We provide alist of the different types of spreadsheetsthat are used throughout the text, by topic, after the Table of Contents.
GOAL SEEK
We have introduced the use of Goal Seek, a powerful Excel tool, for solving complex problems. Goal Seek performs “trial and error” or successive approximation calculations to arrive at an answer. It is useful when one parameter needs to be varied in a calculation, as is the case for most equilibrium calculations. An introduction to Goal Seek is given in Section 6.11 in Chapter 6. Example applications are given on the text website, and we list these after the Table of Contents.
SOLVER
Excel Solver is an even more versatile tool. Goal Seek can only solve one parameter in a single equation, and does not allow for incorporating constraints in the parameter we want to solve. Solver, on the other hand, can solve for more than one parameter (or more than one equation) at a time. Example applications are given on the text website, with descriptions in the text. See the list after the Table of Contents. An introduction to its use is given in Example 7.21.
REGRESSION FUNCTION IN EXCEL DATA ANALYSIS
Possibly the most powerful tool to calculate all regression related parameters for a calibration plot is the “Regression” function in Data Analysis. It not only provides the results forr,r2, intercept, and slope (which it lists as X variable 1), it also provides their standard errors and upper and lower limits at the 95% confidence level. It also provides an option for fitting the straight line through the origin (when you know for certain that the response at zero concentration is zero by checking a box “constant is zero”). A video illustrating its use is in the website of the book, Chapter 3, titled Data Analysis Regression. A description of how to use it is given in Chapter 16 at the end of Section 16.7, and example applications are given in Chapter 20, Section 20.5, and Chapter 23 for Examples 23.1 and Example 23.2.
READY TO USE PROGRAMS
As listed above, there are numerous supplemental materials on the text website, including Excel spreadsheets for different calculations. Many of these are for specific examples and are tutorial in nature. But several are suited to apply to different applications, simply by inputting data and not having to set up the calculation program.
Examples include calculating titration curves and their derivatives, or for solving either quadratic or simultaneous equations. We list here a number that you should find useful. You can find them under the particular chapter on the website.
Chapter 2
● Glassware calibration, Table 2.4
Chapter 6
● Calculate activity coefficients, equations 6.19 and 6.20 (Auxiliary data)
● Quadratic equation solution (Example 6.1) (See also Goal Seek for solving quadratic equations)
Chapter 7
● Stig Johannson pH calculator. For calculating pH of complex mixtures. Easy to use.
● CurtiPotpH calculator (Ivano Gutz) for calculating pH of complex mixtures, as well as constructing pH related curves. Learning curve higher, but very powerful.
● logC-pH Master Spreadsheet. See Section 7.16 on how to use it.
Chapter 8
● Derivative titrations—Easy method (Section 8.11)
● Universal Acid Titrator—Alex Scheeline—Easy method (Section 8.11). For polyprotic acid titration curves.
● Master Spreadsheet for titrations of weak bases—Easy method Chapter 10
● Solving simultaneous equations (Example 10.5) Chapter 14
● Derivative titration plots (for near the endpoint) Chapter 16
● Calculation of unknown from calibration curve plot
● Standard deviation of sample concentration
● Two component Beer’s Law solution Chapter 17
● Standard additions plot and unknown calculation Chapter 20
● Internal standard calibration plot and unknown calculation (Section 20.5) EXPERIMENTS
There are 46 experiments, grouped by topic, illustrating most of the measurement techniques presented in the text, and they can be downloaded from the text website.
Each contains a description of the principles and chemical reactions involved, so the student gains an overview of what is being determined and how. Solutions and reagents to prepare in advance of the experiment are listed, so experiments can be performed efficiently. All experiments, particularly the volumetric ones, have been designed to minimize waste by preparing the minimum volumes of reagents, like titrants, required to complete the experiment.
Twoteam experimentsare included (Experiments 45 and 46) to illustrate the principles presented in Chapter 4 on statistical validation. One is on method validation and quality control, in which different members of teams perform different parts of the validation for a chosen experiment. The other is on proficiency testing in which students calculate thez-values for all the student results of one or more class experiments and each student compares theirz-value to see how well they have performed.
PREFACE xvii
New experiments were contributed by users and colleagues. Included are three experiments from Professor Christopher Palmer, University of Montana using a spectrophotometric microplate reader(Experiments 3, 24, and 29).
Experiment Video Resource.Professor Christopher Harrison from San Diego State University has a YouTube “Channel” of videos of different types of experi- ments, some illustrating laboratory and titration techniques: http://www.youtube.com/
user/crharrison.
We would recommend that students be encouraged to look at the ones dealing with buret rinsing, pipetting, and aliquoting a sample, before they begin experiments.
Also, they will find useful the examples of acid-base titrations illustrating methyl red or phenolphthalein indicator change at end points. There are a few specific experiments that may be related to ones from the textbook, for example, EDTA titration of calcium or Fajan’s titration of chloride. The video of glucose analysis gives a good illustration of the starch end point, which is used in iodometric titrations.
SUPPLEMENTARY MATERIALS FOR THE INSTRUCTOR AND THE STUDENT
WEBSITE URLs and QR CODES. There are some 200 website URLs, i.e., website addresses, given throughout the text for access to useful supplemental material. To efficiently access the websites, lists of all the URLs are posted on the text website for each chapter. These lists can be used to access the websites without typing the URLs.
The lists of URLs for each chapter are also added as QR codes at the beginning
Complete URL list of each chapter, facilitating access on smartphones. QR codes for selected ones are
also given on the text pages where they appear (see below). We list in the QR code here all the chapter URL lists.
QR codes are created for selected website materials in several chapters, as referred to in the chapter text. This will allow access to supplemental material using a smartphone, iPad, etc. So by accessing QR codes in a given chapter, one can browse for the videos and the selected URL links, alongside other valuable materials.
TEXT COMPANION WEBSITE
John Wiley & Sons, Inc. maintains a companion website for yourAnalytical Chemistry textbook that contains additional valuable supplemental material.
The website may be accessed at: www.wiley.com/college/christian
Materials on the website include supplemental materials for different chapters that expand on abbreviated presentations in the text.
Following is a list of the types of materials on the website:
● Videos
● URLs
● Supplemental Material: WORD, PDFs, Excel, PowerPoint, JPEG POWERPOINT SLIDES
All figures and tables in the text are posted on the text website as PowerPoint slides for each chapter, with notes on each for the instructor, and can be downloaded for preparation of PowerPoint presentations.
SOLUTIONS MANUAL
A comprehensive saleable solutions manual is available for use by instructors and students in which all problems are completely worked out and all questions are
answered, a total of 824. More information on the solutions manual can be found at www.wiley.com, including where/how to purchase it. Answers for spreadsheet problems, which include the spreadsheets, are given on the text website. Answers to all problems are given in Appendix F.
A WORD OF THANKS
The production of your text involved the assistance and expertise of numerous people. Special thanks go to the users of the text who have contributed comments and suggestions for changes and improvements; these are always welcome. A number of colleagues served as reviewers of the text and manuscript and have aided immeasurably in providing specific suggestions for revision. They, naturally, express opposing views sometimes on a subject or placement of a chapter or section, but collectively have assured a near optimum outcome that we hope you find easy and enjoyable to read and study.
First, Professors Louise Sowers, Stockton College; Gloria McGee, Xavier University; and Craig Taylor, Oakland University; and Lecturer Michelle Brooks, University of Maryland and Senior Lecturer Jill Robinson, Indiana University offered advice for revision and improvements of the 6th edition. Second, Professors Neil Barnett, Deakin University, Australia; Carlos Garcia, The University of Texas at San Antonio; Amanda Grannas, Villanova University; Gary Long, Virginia Tech;
Alexander Scheeline, University of Illinois; and Mathew Wise, Condordia University, proofed the draft chapter manuscripts of this edition and offered further suggestions for enhancing the text. Dr. Ronald Majors, a leading chromatography expert from Agilent Technologies, offered advice on the liquid chromatography chapter.
The professionals at John Wiley & Sons have been responsible for producing a high quality book. Petra Recter, Vice President, Publisher, Chemistry and Physics, Global Education, shepherded the whole process from beginning to end. Her Editorial Assistants Lauren Stauber, Ashley Gayle, and Katherine Bull were key in taking care of many details, with efficiency and accuracy. Joyce Poh was the production editor, arranging copyediting to printing, attending to many details, and assuring a quality final product. Laserwords Pvt Ltd was responsible for artwork in your text. We appreciate the efforts of Marketing Manager, Kristy Ruff, in making sure the text is available to all potential users. It has been a real pleasure for all of us working with this team of professionals and others in a long but rewarding process.
We each owe special thanks to our families for their patience during our long hours of attention to this undertaking. Gary’s wife, Sue, his companion for over 50 years, has been through seven editions, and remains his strong supporter, even now.
Purnendu owes his wife, Kajori, and his students, much for essentially taking off from all but the absolute essentials for the last three years. He also thanks Akinde Kadjo in particular for doing many of the drawings. Kevin’s wife, Dani, put up with yet another
“interesting project” and lent her support in the form of keeping the kids at bay and making sure her husband was well fed while working on the text.
GARYD. CHRISTIAN
Seattle, Washington PURNENDUK. (SANDY) DASGUPTA
KEVINA. SCHUG
Arlington, Texas September, 2013
“To teach is to learn twice.” —Joseph Joubert
List of Spreadsheets Used Throughout the Text
The use of spreadsheets for plotting curves and perform- ing calculations is introduced in different chapters. Listed in the Preface are several that are ready to use for differ- ent applications. Following is a list of the various other applications of Microsoft Excel, by category, for easy reference for different uses. All spreadsheets are given in the text website. The Problem spreadsheets are only in the website; others are in the text but also in the website.
You should always practice preparing assigned spread- sheets before referring to the website. You can save the spreadsheets in your website to your desktop for use.
Use of Spreadsheets(Section 3.20) Filling the Cell Contents, 112
Saving the Spreadsheet, 113 Printing the Spreadsheet, 113
Relative vs. Absolute Cell References, 114
Use of Excel Statistical Functions (Paste functions), 115 Useful Syntaxes: LOG10; PRODUCT; POWER; SQRT;
AVERAGE; MEDIAN; STDEV; VAR, 116 Statistics Calculations
Standard Deviation: Chapter 3, Problems 14, 15, 16, 22, 24
Confidence Limit: Chapter 3, Problems 22, 24, 25, 29
Pooled Standard Deviation: Chapter 3, Problem 34 F-Test: Chapter 3, Problems 31, 33, 35
t-Test: Chapter 3, Problems 37, 38
t-Test, multiple samples: Chapter 3, Problem 53 Propagation of Error: Chapter 3, Problems 18 (add/subtract), 19 (multiply/divide)
Using Spreadsheets for Plotting Calibration Curves
Trendline; Least squares equation; R2(Section 3.21, Figure 3.10)
Slope, Intercept and Coefficient of Determination (without a plot) (Section 3.22; Chapter 3, Problems 47, 51, 52)
LINEST for Additional Statistics (Section 3.23, Figure 3.11)
Ten functions: slope, std. devn., R2, F, sum sq. regr., intercept, std. devn., std. error of estimate, d.f., sum sq.
resid.
Plottingαvs. pH Curves(Figure 7.2, H3PO4), 251 .
Plotting log C vs. pH Curves Chapter 7, Problem 66 (HOAc)
Plotting log C vs. pH Curves Using Alpha Values (Section 7.16)
Chapter 7, Problem 69 (Malic acid, H2A) Chapter 7, Problem 73 (H3PO4, H3A) Plotting Titration Curves
HCl vs. NaOH (Figure 8.1), 283, 285
HCl vs. NaOH, Charge Balance (Section 8.2), 285 HOAc vs. NaOH (Section 8.5), 293
Hg2+vs. EDTA: Chapter 9, Problem 24
SCN−and Cl−vs. AgNO3: Chapter 11, Problem 12 Fe2+vs. Ce4+(Figure 14.1): Example 14.3
Derivative Titrations(Section 8.11), 305; Chapter 14, 458
.
Plotting log K’ vs. pH(Figure 9.2): Chapter 9, Problem 23
.
Plotting β-values vs. [ligand] (Ni(NH3)62+ beta- values vs. [NH3]):
Chapter 9, Problem 25
Spreadsheet Calculations/Plots Glassware Calibration (Table 2.4), 38
xix
Weight in Vacuum Error vs. Sample Density (Chapter 2) Gravimetric Calculations
Spreadsheet Examples-Grav. calcn. %Fe, 378 Chapter 10, Problem 40 (Example 10.2, %P2O5) Solubility BaSO4vs. [Ba2+] Plot (Figure 10.3):
Chapter 10, Problem 41
Solubility vs. Ionic Strength Plot (Figure 10.4):
Chapter 10, Problem 42
Van Deemter Plot: Chapter 19, Problem 13 EXCEL SOLVER FOR PROBLEM SOLVING This program can be used to solve several parameters or equations at a time. An introduction is given in Example 7.21.
Chapter 3 video Solver (solving quadratic equation, Example 6.1)
Example 7.21 Solver pH calculations of multiple solutions (H3PO4, NaH2PO4, Na2HPO4, Na3PO4); 258
Example 7.24 Solver calculation (buffer composition), 264
Solubility from Ksp: Chapter 10, Problem 43 (Example 10.9)
GOAL SEEK FOR PROBLEM SOLVING
The spreadsheets listed below are on the text website for the particular chapter. The page numbers refer to cor- responding discussions on setting up the programs. See Section 6.11 for introduction to and application of Goal Seek. It can be used to solve one parameter in an equation, as in most equilibrium problems.
Excel Goal Seek for Trial and Error Problem Solving (Section 6.11):
Equilibrium problem—introduction to Goal Seek, 197;
Practice Goal Seek—setup, answer
Goal Seek to Solve an Equation (Example 6.1—quadratic equation), 199
Solving a quadratic equation by Goal Seek—setup Goal Seek answer quadratic equation
Chapter 6 video Goal Seek Equilibrium, 201
Goal Seek shortcomings (how to get around them)—setup (Example 6.4); 202
Goal Seek answer Example 6.4
Solving Example 6.13 Using Goal Seek (charge balance);
210
Chapter 6 video Goal Seek Problem 6.2
Goal Seek answer Problem 26 (quadratic equation), Chapter 6
Example 7.7 Goal Seek solution (pH HOAc) Example 7.8 Goal Seek solution (pH NH3) Example 7.9 Goal Seek solution (pH NaOAc) Example 7.10 Goal Seek solution (pH NH4Cl) Chapter 7 video Goal Seek pH NH4F, 238
Chapter 7 video Goal Seek mixture (NaOH+H2CO3), 244
Example 7.19 Charge balance and Goal Seek to calc H3PO4pH (See the example for details of setting up the spreadsheet)
Example 7.19b Goal Seek solution (pH H3PO4+NaOAc +K2HPO4) (See Example 7.19 discussion for spreadsheet setup)
77PFP Goal Seek calculations—there are three tabs (Chapter 7, Problem 77). See 77PFP solution on the website for a detailed description of the problem solution and appropriate equations.
Example 9.6—Goal Seek (complexation equilibria);
(Section 9.6), 339 (See the example for the equation setup)
Example 11.1 Goal Seek (solubility of CaC2O4in 0.001M HCl)
Example 11.2 Goal Seek (charge balance, solubility of MA in 0.1M HCl)
Example 11.5 Goal Seek (solubility of MX in presence of complexing ligand L)
REGRESSION FUNCTION IN EXCEL DATA ANALYSIS
This Excel tool calculates all regression related param- eters for a calibration plot. It provides the results for r, r2, intercept, and slope, and also provides their standard errors and upper and lower limits at the 95% confidence level.
Chapter 3 video Data Analysis Regression; 87, 120 Chapter 16, end of Section 16.7, Excel Exercise. Describes the use of the Excel Regression function in Data Analysis to readily calculate a calibration curve and its uncertainty, and then apply this to calculate an unknown concentration and its uncertainty from its absorbance; 502
Section 20.5, GC internal standard determination, 640 Chapter 20, Problem 11. GC internal standard determi- nation
Example 23.1, Lineweaver-Burk Kmdetermination Example 23.2, Calculating unknown concentration from reaction rate
Problem 23.17, Lineweaver-Burk Kmdetermination
About the Authors
Gary Christian grew up Oregon, and has had a lifelong interest in teaching and research, inspired by great teachers throughout his education. He received his B.S.
degree from the University of Oregon and Ph. D. degree from the University of Maryland. He began his career at Walter Reed Army Institute of Research, where he developed an interest in clinical and bioanalytical chemistry. He joined the University of Kentucky in 1967, and in 1972 moved to the University of Washington, where he is Emeritus Professor, and Divisional Dean of Sciences Emeritus.
Gary wrote the first edition of this text in 1971. He is pleased that Professors Dasgupta and Schug have joined him in this new edition. They bring expertise and experience that markedly enhance and update the book in many ways.
Gary is the recipient of numerous national and international awards in recognition of his teaching and research activities, including the American Chemical Society (ACS) Division of Analytical Chemistry Award for Excellence in Teaching and the ACS Fisher Award in Analytical Chemistry, and received an Honorary Doctorate Degree from Chiang Mai University. The University of Maryland inducted him into their distinguished alumni Circle of Discovery.
He has authored five other books, includingInstrumental Analysis, and over 300 research papers, and has been Editor-in-Chief of the international analytical chemistry journal,Talanta, since 1989.
Purnendu K. (Sandy) Dasguptais a native of India and was educated in a college founded by Irish missionaries and graduated with honors in Chemistry in 1968. After a MSc in Inorganic Chemistry in 1970 from the University of Burdwan and a brief stint as a researcher at the Indian Association for the Cultivation of Science (where Raman made his celebrated discovery), he came as a graduate student to Louisiana State University at Baton Rouge in 1973. Sandy received his PhD in Analytical Chemistry with a minor in Electrical Engineering from LSU in 1977 and managed to get a diploma as a TV mechanic while a graduate student. He joined the California Primate Research Center at the University of California at Davis as an Aerosol research Chemist in 1979 to be part of a research team studying inhalation toxicology of air pollutants. In his mother tongue, Bengali, he was once a well-published poet and a fledgling novelist but seemingly finally found his love of analytical chemistry as salvation. He joined Texas Tech in 1981 and was designated a Horn Professor in 1992, named after the first president of the University, the youngest person to be so honored at the time. He remained at Texas Tech for 25 years, joining the University of Texas at Arlington in 2007 as the Department Chair. He has stepped down as Chair, and currently holds the Jenkins Garrett Professorship.
Sandy has written more than 400 papers/book chapters, and holds 23 US patents, many of which have been commercialized. His work has been recognized by the Dow Chemical Traylor Creativity Award, the Ion Chromatography Symposium
xxi
Outstanding Achievement Award (twice), the Benedetti-Pichler Memorial Award in Microchemistry, American Chemical Society Award in Chromatography, Dal Nogare Award in the Separation Sciences, Honor Proclamation of the State of Texas Senate and so on. He is the one of the Editors ofAnalytica Chimica Acta, a major international journal in analytical chemistry. He is best known for his work in atmospheric measurements, ion chromatography, the environmental occurrence of perchlorate and its effect on iodine nutrition, and complete instrumentation systems. He is a big champion of the role of spreadsheet programs in teaching analytical chemistry.
Kevin Schug was born and raised in Blacksburg, Virginia. The son of a physical chemistry Professor at Virginia Tech, he grew up running around the halls of a chemistry building and looking over his father’s shoulder at chemistry texts. He pursued and received his B.S. degree in Chemistry from the College of William &
Mary in 1998, and his Ph.D. degree in Chemistry under the direction of Professor Harold McNair at Virginia Tech in 2002. Following two years as a post-doctoral fellow with Professor Wolfgang Lindner at the University of Vienna (Austria), he joined the faculty in the Department of Chemistry & Biochemistry at The University of Texas at Arlington in 2005, where he is currently the Shimadzu Distinguished Professor of Analytical Chemistry.
The research in Kevin’s group spans fundamental and applied aspects of sample preparation, separation science, and mass spectrometry. He also manages a second group, which focuses their efforts on chemical education research. He has been the recipient of several awards, including the Eli Lilly ACACC Young Investigator in Analytical Chemistry award, the LCGC Emerging Leader in Separation Science award, and the American Chemical Society Division of Analytical Chemistry Award for Young Investigators in Separation Science.
At present, he has authored or coauthored 65 scientific peer-reviewed manuscripts. Kevin is a member of the Editorial Advisory Boards for Analytica Chimica Acta and LCGC Magazine, and is a regular contributor to LCGC on-line articles. He is also Associate Editor of theJournal of Separation Science.
Chapter One
ANALYTICAL OBJECTIVES, OR: WHAT ANALYTICAL CHEMISTS DO
Chapter 1 URLs
“Unless our knowledge is measured and expressed in numbers, it does not amount to much.”
—Lord Kelvin
Learning Objectives
WHAT ARE SOME OF THE KEY THINGS WE WILL LEARN FROM THIS CHAPTER?
● Analytical science deals with the chemical characterization of matter—what, how much?, p. 2
● The analyst must know what information is really needed, and obtain a representative sample, pp. 6, 9
● Few measurements are specific, so operations are performed to achieve high selectivity, p. 11
● You must select the appropriate method for measurement, p. 12
● Validation is important, p. 15
● There are many useful websites dealing with analytical chem- istry, p. 16
Lord Kelvin (William Thomson, 1824–1907)
Analytical chemistry is concerned with the chemical characterization of matter and the answer to two important questions: what is it (qualitative analysis) and how much is it (quantitative analysis). Chemicals make up everything we use or consume, and knowledge of the chemical composition of many substances is important in our daily lives. Analytical chemistry plays an important role in nearly all aspects of chemistry, for example, agricultural, clinical, environmental, forensic, manufacturing, metallurgical, and pharmaceutical chemistry. The nitrogen content of a fertilizer determines its value.
Foods must be analyzed for contaminants (e.g., pesticide residues) and for essential
Everything is made of chemicals.
Analytical chemists determine what and how much.
nutrients (e.g., vitamin content). The air we breathe must be analyzed for toxic gases (e.g., carbon monoxide). Blood glucose must be monitored in diabetics (and, in fact, most diseases are diagnosed by chemical analysis). The presence of trace elements from gun powder on a perpetrator’s hand will prove a gun was fired by that hand.
The quality of manufactured products often depends on proper chemical proportions, and measurement of the constituents is a necessary part ofquality assurance. The carbon content of steel will influence its quality. The purity of drugs will influence their efficacy.
In this text, we will describe the tools and techniques for performing these different types of analyses. There is much useful supplemental material on the text website, including Excel programs that you can use, and videos to illustrate their use.
You should first read the Preface to learn what is available to you, and then take advantage of some of the tools.
1
1.1 What Is Analytical Science?
The above description of analytical chemistry provides an overview of the discipline of analytical chemistry. There have been various attempts to more specifically define the discipline. The late Charles N. Reilley said: “Analytical chemistry is what analytical chemists do” (Reference 2). The discipline has expanded beyond the bounds of just chemistry, and many have advocated using the nameanalytical scienceto describe the field. This term is used in a National Science Foundation report from workshops on
“Curricular Developments in the Analytical Sciences.” Even this term falls short of recognition of the role of instrumentation development and application. One suggestion is that we use the termanalytical science and technology(Reference 3).
The Federation of European Chemical Societies held a contest in 1992 to define analytical chemistry, and the following suggestion by K. Cammann was selected [Fresenius’ J. Anal. Chem.,343(1992) 812–813].
Analytical Chemistry provides the methods and tools needed for insight into our material world . . . for answering four basic questions about a material sample:
● What?
● Where?
● How much?
● What arrangement, structure or form?
These cover qualitative, spatial, quantitative, and speciation aspects of analytical science. The Division of Analytical Chemistry of the American Chemical Society developed a definition of analytical chemistry, reproduced in part here:
Analytical Chemistry seeks ever improved means of measuring the chemical compo- sition of natural and artificial materials. The techniques of this science are used to identify the substances which may be present in a m


![Fig. 2.23. Schematic of a microwave system. [From G. Le Blanc, LC / GC Suppl., 17(6S) (1999) S30.] (Courtesy of LC/GC Magazine).](https://thumb-ap.123doks.com/thumbv2/123dok/11868712.0/80.1263.505.930.377.637/fig-schematic-microwave-blanc-suppl-1999-courtesy-magazine.webp)