Use of the current edition of the electronic version of this book (eBook) is subject to the terms of the nontransferable, limited license granted on expertconsult.inkling.com. Access to the eBook is limited to the first individual who redeems the PIN, located on the inside cover of this book, at expertconsult.inkling.com and may not be transferred to another party by resale, lending, or other means.
Any screen.
Any time.
Anywhere.
Activate the eBook version
of this title at no additional charge.
Unlock your eBook today.
1 Visit expertconsult.inkling.com/redeem 2 Scratch off your code
3 Type code into “Enter Code” box 4 Click “Redeem”
5 Log in or Sign up 6 Go to “My Library”
It’s that easy!
Expert Consult eBooks give you the power to browse and find content, view enhanced images, share notes and highlights—both online and offline.
For technical assistance:
email [email protected] call 1-800-401-9962 (inside the US) call +1-314-447-8200 (outside the US)
Scan this QR code to redeem your eBook through your mobile device:
e.
Place Peel Off Sticker Here
THE REQUISITES
Breast Imaging
The Requisites Series
SERIES EDITOR
James H. Thrall, MD Radiologist-in-Chief Emeritus Massachusetts General Hospital
Distinguished Juan M. Taveras Professor of Radiology Harvard Medical School
Boston, Massachusetts
TITLES IN THE SERIES
Breast Imaging Cardiac Imaging Emergency Imaging Gastrointestinal Imaging Genitourinary Imaging Musculoskeletal Imaging Neuroradiology Imaging Nuclear Medicine Pediatric Imaging Thoracic Imaging Ultrasound
Vascular and Interventional Imaging
THE REQUISITES
Breast Imaging
THIRD EDITION
Debra M. Ikeda, MD, FACR, FSBI
Professor
Department of Radiology
Stanford University School of Medicine Stanford, California
Kanae K. Miyake, MD, PhD
Program-Specific Assistant Professor
Department of Diagnostic Imaging and Nuclear Medicine Kyoto University Graduate School of Medicine
Kyoto, Japan
Visiting Assistant Professor Department of Radiology
Stanford University School of Medicine Stanford, California
THE REQUISITES: BREAST IMAGING, THIRD EDITION ISBN: 978-0-323-32904-0 Copyright © 2017 by Elsevier Inc.
Previous editions copyrighted 2011 and 2004
All rights reserved. No part of this publication may be reproduced or transmitted in any form or by any means, electronic or mechanical, including photocopying, recording, or any information storage and re- trieval system, without permission in writing from the publisher. Details on how to seek permission, fur- ther information about the Publisher’s permissions policies, and our arrangements with organizations such as the Copyright Clearance Center and the Copyright Licensing Agency can be found at our website:
www.elsevier.com/permissions.
This book and the individual contributions contained in it are protected under copyright by the Publisher (other than as may be noted herein).
Notices
Knowledge and best practice in this field are constantly changing. As new research and experience broaden our understanding, changes in research methods, professional practices, or medical treatment may become necessary.
Practitioners and researchers must always rely on their own experience and knowledge in evaluat- ing and using any information, methods, compounds, or experiments described herein. In using such information or methods they should be mindful of their own safety and the safety of others, including parties for whom they have a professional responsibility.
With respect to any drug or pharmaceutical products identified, readers are advised to check the most current information provided (i) on procedures featured or (ii) by the manufacturer of each prod- uct to be administered, to verify the recommended dose or formula, the method and duration of admin- istration, and contraindications. It is the responsibility of practitioners, relying on their own experience and knowledge of their patients, to make diagnoses, to determine dosages and the best treatment for each individual patient, and to take all appropriate safety precautions.
To the fullest extent of the law, neither the Publisher nor the authors, contributors, or editors as- sume any liability for any injury and/or damage to persons or property as a matter of products liability, negligence or otherwise, or from any use or operation of any methods, products, instructions, or ideas contained in the material herein.
Library of Congress Cataloging-in-Publication Data Names: Ikeda, Debra M., author. | Miyake, Kanae K., author.
Title: Breast imaging / Debra M. Ikeda, Kanae K. Miyake.
Other titles: Requisites series.
Description: Third edition. | St. Louis, Missouri : Elsevier, [2017] | Series: Requisites | Includes bibliographical references and index.
Identifiers: LCCN 2016032302 | ISBN 9780323329040 (hardcover : alk. paper) Subjects: | MESH: Mammography | Breast Diseases--diagnosis | Ultrasonography, Mammary | Magnetic Resonance Imaging--methods
Classification: LCC RG493.5.R33 | NLM WP 815 | DDC 618.1/907572--dc23 LC record available at https://lccn.loc.gov/2016032302
Executive Content Strategist: Robin Carter Content Development Specialist: Angie Breckon Publishing Services Manager: Julie Eddy Book Production Specialist: Clay S. Broeker Design Direction: Amy Buxton
Printed in China
Last digit is the print number: 9 8 7 6 5 4 3 2 1
Pearl City, Hawaii and
For my father, Otto Masaru Ikeda, and brother Clyde Seiji Ikeda
Puowaina (Punchbowl), Honolulu, Hawaii Debra M. Ikeda
For my mother, Chikako Miyake Gifu, Japan
and
For my father, Akihide Miyake Tokiwacho, Kyoto, Japan
Kanae K. Miyake
vi
Contributors
Bruce L. Daniel, MD Professor of Radiology
Stanford University School of Medicine Stanford, California
Frederick M. Dirbas, MD Associate Professor of Surgery Stanford University School of Medicine Leader, Breast Disease Management Group Stanford Cancer Center
Stanford, California Dipti Gupta, MD Assistant Professor Section of Breast Imaging Northwestern Memorial Hospital Chicago, Illinois
R. Edward Hendrick, PhD, FACR, FSBI, FAAPM, FISMRM Clinical Professor of Radiology
University of Colorado-Denver School of Medicine Aurora, Colorado
Kathleen C. Horst, MD Assistant Professor
Department of Radiation Oncology Stanford University School of Medicine Stanford, California
Debra M. Ikeda, MD, FACR, FSBI Professor
Department of Radiology
Stanford University School of Medicine Stanford, California
Ellen B. Mendelson, MD, FACR, FSBI, FSRU
Lee F. Rogers Professor of Medical Education in Radiology Professor of Radiology
Department of Radiology
Feinberg School of Medicine, Northwestern University Chicago, Illinois
Kanae K. Miyake, MD, PhD Program-Specific Assistant Professor Diagnostic Imaging and Nuclear Medicine Kyoto University Graduate School of Medicine Kyoto, Japan
Visiting Assistant Professor Department of Radiology
Stanford University School of Medicine Stanford, California
Camila Mosci, MD, MSc Professor of Nuclear Medicine Department of Radiology University of Campinas Campinas, Sao Paulo, Brazil Dung H. Nguyen, MD, PharmD Clinical Assistant Professor Stanford University Stanford, California
Director of Breast Reconstruction Stanford Cancer Center
Palo Alto, California Andrew Quon, MD
Medical Director, Clinical PET-CT Associate Professor of Radiology Stanford University School of Medicine Stanford, California
vii
Foreword
The first two editions of Breast Imaging: The Requisites were both outstanding texts and captured the philoso- phy of the Requisites in Radiology series by presenting complex material in a concise, logical, and straightforward way, making the material very accessible to the reader. Drs.
Ikeda and Miyake and their contributors have again suc- ceeded in achieving these attributes for the third edition of their book. Important new material has been added, and material on all enduring methods has been updated.
In light of the trend toward standardized reporting in radiology, it is noteworthy that breast imaging has been an exemplar within the specialty for the use of standard- ized reporting through the use of BI-RADS®. Indeed, un- derstanding the use of this reporting system is crucial to successful clinical practice in breast imaging. To this end, Drs. Ikeda and Miyake have systematically incorporated the revised BI-RADS® 2013 system that encompasses ul- trasound and MRI reporting as well as mammography, and they explain how to use the BI-RADS® 2013 lexicon cor- rectly. Readers will find this material of daily practical use.
Screening and diagnostic applications of x-ray mammog- raphy remain the most commonly performed procedures in breast imaging, but the technology for performing these studies has changed dramatically over the last decade, with widespread use of digital imaging and increasing use of tomosynthesis. These advances in technology are compre- hensively described in the third edition of Breast Imaging:
The Requisites. Many positive consequences related to the use of digital mammography and tomosynthesis have been more firmly established since the previous edition, such as improved cancer detection and reduced callback rates.
Beyond x-ray–based mammography, no area of special- ization in radiology has seen more expansion of scope or complexity than breast imaging. The specialty now en- compasses the use of all medical imaging methods—x-ray, ultrasound, MRI, nuclear medicine—and addresses a spec- trum of applications that includes screening, diagnosis, surveillance, interventions, and assessment of therapeutic efficacy. Functional and molecular information is now in- corporated into the practice of breast imaging. Separate chapters of Breast Imaging: The Requisites are devoted to each of these topics. The chapters are laid out in a logi- cal fashion, with a succinct summary statement of key ele- ments at the end.
New material in the third edition incorporates substan- tial advances in our understanding of the challenges of diagnosing breast cancer and therewith development of optimal strategies for employing different imaging meth- ods. For example, strategies for enhanced surveillance us- ing ultrasound and MRI have been informed by advances in our understanding of the genetics of breast cancer and
genotype-related risks. Likewise, strategies incorporating nuclear medicine, ultrasound, and MRI methods have been developed to help better detect disease in women with dense breast tissue.
High-quality images are a fundamental basis for success- ful radiology practice. Presentation of high-quality images is even more important in textbooks in order to provide the reader with clear, easily comprehended examples of image findings. Drs. Ikeda and Miyake and their contributors have achieved a high standard in this regard. Readers will again find that this edition of Breast Imaging: The Requisites is generously illustrated with very high-quality material.
While the technology and scientific understanding of breast imaging continue to advance, the special relation- ship of breast imaging specialists and their patients has not changed. Breast imaging radiologists have a special respon- sibility as stewards of patient care in going from screen- ing to diagnosis, to assessment of surgical specimens, to clinical staging, and finally to assessment of therapeutic outcome and long-term follow-up. The intimate relation- ship between radiologists and their patients with breast disease is unique in radiology practice. As in the previous editions of Breast Imaging: The Requisites, Drs. Ikeda and Miyake have captured the importance of this relationship and especially the philosophy that the fundamental goal is to save women’s lives.
The Requisites in Radiology series is well into its third decade and is now an old friend to a large number of ra- diologists around the world. The intent of the series has always been to provide residents, fellows, and clinical practitioners with reliable, factual material, uncluttered with conjecture or speculation, that can serve as a durable basis for daily practice. As series editor, I have always asked writers to include what they use in their own practices and what they teach their own trainees and to not include extraneous material just for the sake of “completeness.”
Reference books are also valuable but serve a different purpose.
I would like to congratulate Drs. Ikeda and Miyake for sustaining the goals of the Requisites series and for pro- ducing another outstanding book. Readers will benefit from the authors’ knowledge and also from their experi- ence and wisdom in one of the most challenging areas of medical practice.
James H. Thrall, MD Radiologist-in-Chief Emeritus Massachusetts General Hospital Distinguished Taveras Professor of Radiology Harvard Medical School Boston, Massachusetts
viii
Preface
The specialty of breast imaging is a uniquely challenging and per- sonal combination of imaging, biopsy procedures, clinical corre- lation, advances in technology, and compassion. A breast cancer diagnosis is intensely personal and potentially devastating for the patient. The radiologist’s job is to detect and diagnose the can- cer and gently support the patient through discovery, diagnosis, treatment, and follow-up. The radiologist’s role has changed from simply identifying cancers to being deeply involved in diagnosis, biopsy, and follow-up. Instead of sitting alone in a dark room, the radiologist is truly part of a team of oncologic surgeons, patholo- gists, radiation oncologists, medical oncologists, plastic surgeons, geneticists, and, most importantly, the patient.
This is a very simple book. Its purpose is to help the first-year resident understand why the mammogram, the ultrasound, and the MRI look the way they do in benign disease or in cancer.
The other purpose is to help senior residents/fellows pass their boards. With careful scrutiny of each chapter, residents will know clinical scenarios in which cancers occur; develop a systematic method of analyzing images; be able to generate a differential diagnoses for masses, calcifications, and enhancement; and know how manage patients.
Even though the book is simple, the pictures and tools in the book can be adapted to your general clinical practice. Thus, when you come upon a tough case out in the “real world,” look to the skills that you learned in this book to solve problems. Use all the tricks you learned on each tough case, because there will be tough cases. Adversity is inevitable. If you welcome adversity as your personal challenge and opportunity, and if you use com- mon sense, you will most certainly succeed. Remember, the goal of imaging is for the good of the patient—to diagnose and treat breast cancer so that the patient will live. Therefore, with each challenging case, view the adversity of the difficult diagnosis as your responsibility, your challenge, and your opportunity. Keep using the tools in this book until you overcome your problem.
As Bruce Daniel told me when I was flailing around in the most difficult of MRI-guided procedures, within the realm of common sense, “Never give up!”
Two days before Christmas in 1986, in my junior year as a resident, my 62-year-old mother’s mammogram showed a 7-mm suspicious spiculated nonpalpable breast mass. The mass was detected because the University of Michigan had hired Visiting Professor Dr. Ingvar Andersson from Malmo, Sweden (principal investigator of the randomized, controlled, population-based Malmo Mammographic Screening Project), who updated our equipment, started a QA program, and taught faculty/trainees state-of-the-art breast imaging interpretation. Because of him, my mother underwent a brand-new diagnostic technique brought from Sweden: fine-needle aspiration under x-ray guidance using a grid coordinate plate. The aspirate showed cancer. We were dev- astated. My mom had a second opinion for surgery on Christmas Eve and underwent mastectomy 2 days after Christmas. On New Year’s Eve, we got the good news that it was a very small invasive tumor, that there were negative axillary lymph nodes, and that she had a good prognosis.
Naturally, I wanted to learn everything about breast imaging because of my experience of what happens within families when a loved one is diagnosed with breast cancer. I knew that diagno- sis and treatment of early-stage breast cancers can result in a long, healthy life for the woman. I knew that we, as radiologists, could train to find and diagnose early breast cancer, profoundly affect- ing women and their families for the better. So I learned breast imaging from excellent teachers. Dr. Miyake and I want you to learn breast imaging, find the little cancer like my mother’s tu- mor, and save her life again.
My mom is now 92 years old and living in Hawaii. Remember our story. I want everyone who reads this book to have the op- portunity to perceive and diagnose small cancers, intervene, and have this outcome. When this outcome is not possible, I want everyone who reads this book to use their knowledge to help their patient through her journey. Someday we may not need this book because there will be further advances in science. Until that happy day comes, we ask those who read this book to use your knowledge to help women.
Debra M. Ikeda, MD, FACR, FSBI
ix
Acknowledgments
I would like to thank my mentors, Dr. Edward A. Sickles and Dr. Ingvar Andersson, who inspired me, taught me breast cancer imaging, and have always supported my career. I especially thank my wonderful husband, Glenn C. Carpenter, who is so generously supportive, giving me the “gift of time” to work on the book. Most of all, I wish to thank my awesome co-editor, Dr. Kanae Kawai Miyake, who wrote, reviewed, and cropped images; trained as- sistants; provided an incredible database for our project; and has been so wonderful to work with as a meticulous, organized scientist, making sure every image, reference, and statement had appropriate scientific or clinical relevance. I was truly blessed when Dr. Kaori Togashi supported Dr. Miyake’s sabbatical from Kyoto University to work at Stanford. I have rarely seen anyone so dedicated and devoted to making complex ideas so very simple that even I can understand them! Dr. Miyake has done outstand- ing work to improve and update this book, and it could not have been done without her tenacity and generous nature. Our col- laboration and friendship is an experience I will never forget.
Dr. Debra M. Ikeda
It was a great pleasure for me to be a part of this book, having the opportunity to share these educational cases with readers world- wide. I have been working with Dr. Ikeda as a Visiting Assistant Professor at Stanford since October 2013, since which time we have been working on Breast Imaging together. I still remember that I read a previous edition of this book when I was a young radiologist and used to keep it on my desk so that I could refer to it when I met difficult cases. It was an indescribable honor for me to be able to contribute to the new edition.
The previous edition was an excellent book, providing fun- damental knowledge and useful tips to diagnose breast cancer, written in a reader-friendly manner. I was moved to tears when I read Dr. Ikeda’s preface, filled with her sense of responsibil- ity for patients, her strong fighting spirit to battle against breast cancer, and her consideration for all breast radiologists. Through editing the new edition, I have realized that she is truly such a person. She is a wonderful expert, an enthusiastic teacher, and an affectionate woman. Her noble intention and tenacious efforts inspired me, and her dedication and leading ideas made the book evolve. I hope that our book will provide practical help to pa- tients and doctors fighting against breast cancer as they face the difficulties that lay ahead of them. I greatly thank Dr. Debra M.
Ikeda for including me in this work.
I thank Dr. Kaori Togashi, the current chair of Department of Radiology at Kyoto University, Japan, who has always supported me and encouraged me as a radiologist and a nuclear medicine physiologist. I thank Dr. Junji Konishi, a former chair of Depart- ment of Radiology at Kyoto University, who helped me have the wonderful opportunity to work at Stanford. I thank my mentors, Dr. Yuji Nakamoto and Dr. Shotaro Kanao, who taught me PET and breast imaging while I was at Kyoto University. I thank my
beloved little son, Toma Kawai, who brings happiness into my life, and my husband and best friend, Toshiyuki Kawai, who al- ways supports my work and walks the path of joyful life together with me. I thank my dad, Akihide Miyake, who has affectionately looked over our family from the sky since the age of 36, and my mom, Chikako Miyake, who bravely raised three kids and always wishes happiness and good health to all.
Dr. Kanae K. Miyake
No book is completed without tremendous efforts on the part of many people. We wish to acknowledge our co-authors, Dr. R. Edward Hendrick, Dr. Ellen B. Mendelson, Dr. Dipti Gupta, Dr. Bruce L. Daniel, Dr. Kathleen C. Horst, Dr. Frederick M. Dirbas, Dr. Dung Hoang Nguyen, Dr. Andrew Quon, and Dr. Camila Mosci for their invaluable scientific and educational contributions in their book chapters. We wish to thank our assistants Adrian C.
Carpenter, Catherine M. Carpenter, and John Chitouras for their dogged, painstaking, but cheerful help with the massive files of images, references, tables, and text. We thank Mark Riesenberger for his fabulous HIPAA compliant, web-based IT support, without which we would have been frozen 2 years ago. We thank our Elsevier editors Robin Carter, Angie Breckon, and Julia Roberts for their support and (sometimes) gentle prodding to complete the book.
We thank Dr. Jafi Lipson, Dr. Sunita Pal, and Dr. Jennifer Kao for sharing ideas of what might be good tools or illustrations for teaching residents and providing images. We thank our physician contributors at Kyoto University, Japan, Dr. Shotaro Kanao and Dr. Yuji Nakamoto for their beautiful images and written contri- butions to the book to increase our knowledge of MRI and PET.
We thank Dr. Kaori Togashi, Radiology Chairman at Kyoto University, who generously supported Dr. Kanae Kawai Miyake in writing this book and in her research. We both wish to emu- late her superb example as a chairman, scientist, physician, and compassionate mentor to radiologists and women. We thank Dr. S. Sanjiv (Sam) Gambhir, Radiology Chairman at Stanford University, and the late Dr. Gary M. Glazer for their vision and sup- port of Stanford Breast Imaging, who were always and constantly seeking ways to provide the best technology and the earliest de- tection and keenly pursuing newest research for our women to save them from breast cancer.
We thank all the scientists, doctors, engineers, and physicists who support our breast cancer patients and women and who battle breast cancer on their behalf. We especially wish to recog- nize the struggle of our many breast cancer patients and women undergoing screening; this book was written for them, directed to all who wish to help them by learning about breast imaging.
Thank you.
Dr. Debra M. Ikeda and Dr. Kanae K. Miyake
x
Contents
Chapter 1
Mammography Acquisition: Screen-Film, Digital Mammography and Tomosynthesis, the Mammography Quality Standards Act, and Computer-Aided Detection 1
R. Edward Hendrick, Debra M. Ikeda, and Kanae K. Miyake
Chapter 2
Mammogram Analysis and Interpretation 30
Debra M. Ikeda and Kanae K. Miyake
Chapter 3
Mammographic Analysis of Breast Calcifications 75
Debra M. Ikeda and Kanae K. Miyake
Chapter 4
Mammographic and Ultrasound Analysis of Breast Masses 122
Kanae K. Miyake and Debra M. Ikeda
Chapter 5
Breast Ultrasound Principles 171
Dipti Gupta and Ellen B. Mendelson
Chapter 6
Mammographic and Ultrasound-Guided Breast Biopsy Procedures 218
Debra M. Ikeda and Kanae K. Miyake
Chapter 7
Magnetic Resonance Imaging of Breast Cancer and Magnetic Resonance Imaging–Guided Breast Biopsy 259
Kanae K. Miyake, Debra M. Ikeda, and Bruce L. Daniel
Chapter 8
Breast Cancer Treatment-Related Imaging and the Postoperative Breast 321
Kathleen C. Horst, Kanae K. Miyake, Debra M. Ikeda, and Frederick M. Dirbas
Chapter 9
Breast Implants and the Reconstructed Breast 357
Kanae K. Miyake, Debra M. Ikeda, Dung H. Nguyen, and Bruce L. Daniel
Chapter 10
Clinical Breast Problems and Unusual Breast Conditions 397
Debra M. Ikeda and Kanae K. Miyake
Chapter 11
18F-FDG PET/CT and Nuclear Medicine for the Evaluation of Breast Cancer 439
Camila Mosci, Kanae K. Miyake, and Andrew Quon
Index 466
xi
Video Contents
Chapter 1
Video 1-1A: Digital Breast Tomosynthesis, Projection Images
Video 1-1B: Digital Breast Tomosynthesis, Reconstructed Slices
Video 1-2: Digital Breast Tomosynthesis of the American College of Radiography Mammography Phantom
Chapter 2
Video 2-1: Digital Breast Tomosynthesis in Mediolateral Oblique Projection:
Cancer in a “Danger Zone”
Video 2-2A: Digital Breast Tomosynthesis, Mediolateral Oblique Projection:
Workup for a Possible Mass—Cancer Video 2-2B: Digital Breast Tomosynthesis,
Craniocaudal Projection: Workup for a Possible Mass—Cancer
Video 2-3A: Digital Breast Tomosynthesis, Mediolateral Oblique Projection:
Workup for a Possible Mass—Cancer Video 2-3B: Digital Breast Tomosynthesis,
Craniocaudal Projection: Workup for a Possible Mass—Cancer
Video 2-4A: Digital Breast Tomosynthesis, Mediolateral Oblique Projection:
Workup for a Possible Mass—
Summation Artifact
Video 2-4B: Digital Breast Tomosynthesis,
Craniocaudal Projection: Workup for a Possible Mass—Summation Artifact Video 2-5A: Digital Breast Tomosynthesis Showing
Asymmetry
Video 2-5B: Digital Breast Tomosynthesis with Spot Compression, Original View:
Workup for a Possible Mass—
Summation Artifact
Video 2-5C: Digital Breast Tomosynthesis with Spot Compression, Magnified View: Workup for a Possible Mass—
Summation Artifact
Video 2-6A: Digital Breast Tomosynthesis, Mediolateral Oblique Projection:
Characterization of a True Finding in the Extremely Dense Breast—Cancer Video 2-6B: Digital Breast Tomosynthesis,
Craniocaudal Projection:
Characterization of a True Finding in the Extremely Dense Breast—Cancer
Chapter 3
Video 3-1A: Systematic Search to Find Calcifications on Tomosynthesis, Standard View Video 3-1B: Systematic Search to Find
Calcifications on Tomosynthesis, Magnified View
Video 3-2: Skin Calcifications on Tomosynthesis Video 3-3: Noncalcified Vessels Leading to
Calcified Vessels on Magnified Tomosynthesis
Chapter 4
Video 4-1: Tomosynthesis for Evaluating Masses, Mediolateral Oblique Projection Video 4-2: Tomosynthesis showing
Circumscribed Mass in Dense Breast Tissue
Video 4-3A: Spiculated Mass on Tomosynthesis, Original View
Video 4-3B: Spiculated Mass on Tomosynthesis, Magnified View
Video 4-4A: Tomosynthesis Showing Spiculated Mass in the Outer Left Breast, Original View
Video 4-4B: Tomosynthesis Showing Spiculated Mass in the Outer Left Breast, Magnified View
Video 4-5A: Tomosynthesis Showing Summation Artifact, Original View
Video 4-5B: Tomosynthesis Showing Summation Artifact, Magnified View
Video 4-6A: Asymmetry: Summation Artifact on Tomosynthesis, Original View Video 4-6B: Asymmetry: Summation Artifact on
Tomosynthesis, Magnified View Video 4-6C: Asymmetry: Summation Artifact on
Spot Compressed Tomosynthesis, Original View
Video 4-6D: Asymmetry: Summation Artifact on Spot Compressed Tomosynthesis, Magnified View
Video 4-7A: Focal Asymmetry/Mass: Atypical Ductal Hyperplasia on Spot Compressed Tomosynthesis, Original View
Video 4-7B: Focal Asymmetry/Mass: Atypical
Ductal Hyperplasia on Spot
Compressed Tomosynthesis,
Magnified View
Video 4-8: Architectural Distortion: Radial Scar on Tomosynthesis
Video 4-9A: Associated Feature: Nipple Retraction on Tomosynthesis, Original View Video 4-9B: Associated Feature: Nipple
Retraction on Tomosynthesis, Magnified View
Video 4-10A: Spiculated Mass: Invasive Ductal Carcinoma on Tomosynthesis, Original View
Video 4-10B: Spiculated Mass: Invasive Ductal Carcinoma on Tomosynthesis, Magnified View
Video 4-11A: Spiculated Mass: Postbiopsy Scar on Tomosynthesis, Original View
Video 4-11B: Spiculated Mass: Postbiopsy Scar on Tomosynthesis, Magnified View Video 4-12A: Spiculated Mass: Radial Scar on Spot
Compressed Tomosynthesis, Original View
Video 4-12B: Spiculated Mass: Radial Scar on Spot Compressed Tomosynthesis, Magnified View
Chapter 6
Video 6-1: Vacuum-Assisted Ultrasound Biopsy Video 6-2: Tomosynthesis-Guided Needle
Localization
Video 6-3: Tomosynthesis for the Evaluation of Specimen
Chapter 9
Video 9-1: Silicone-Specific Magnetic Resonance Images of Intact Silicone Implants—
Radial Fold
Video 9-2: Silicone-Specific Magnetic Resonance Images of Intracapsular and
Extracapsular Rupture
Video 9-3: Silicone-Specific Magnetic Resonance Images of Direct Silicone Injections Video 9-4: Tomosynthesis of Direct Paraffin
Injections
Video 9-5: Mediolateral Oblique Tomosynthesis of Breast after Reduction Mammoplasty Video 9-6: Tomosynthesis Showing Skin
Calcifications around Replaced Nipple
after Reduction Mammoplasty
1 Mammography is one of the most technically challenging areas
of radiography, requiring high spatial resolution, excellent soft- tissue contrast, and low radiation dose. It is particularly challeng- ing in denser breasts because of the similar attenuation coeffi- cients of breast cancers and fibroglandular tissues. The Digital Mammographic Imaging Study Trial (DMIST) and other recent studies have shown that digital mammography offers improved cancer detection compared with screen-film mammography (SFM) in women with dense breasts (Pisano et al., 2005b). As of March 2015, 96% of the mammography units in the United States are digital units, and some sites are using digital breast tomosyn- thesis (DBT) systems for screening and diagnostic mammogra- phy. Computer-aided detection (CAD) systems specific to mam- mography are also in common use.
Randomized controlled trials (RCTs) of women invited to mammography screening conducted between 1963 and 2000 based on SFM have shown that early detection and treatment of breast cancer have reduced the proportion of late-stage breast cancers and led to a 20% to 30% decrease in breast cancer mor- tality among these women. More recent observational studies of screening programs in Europe have shown that screening mam- mography reduces breast cancer mortality by 38% to 48% among women screened compared with unscreened women (Broed- ers et al., 2012). A similar observational study in Canada showed breast cancer mortality reduced by 44% among screened women aged 40 to 49, 40% in screened women aged 50 to 59, 42% in screened women aged 60 to 69, and 35% in screened women aged 70 to 79 compared with unscreened women (Coldman et al., 2007). The different mammography screening recommen- dations of several major organizations are shown in Box 1.1 (Lee et al., 2010; Oeffinger et al., 2015; Siu, 2016).
In all of these studies, image quality was demonstrated to be a critical component of early detection of breast cancer.
To standardize and improve the quality of mammography, in 1987 the American College of Radiology (ACR) started a vol- untary ACR Mammography Accreditation Program. In 1992, the U.S. Congress passed the Mammography Quality Standards Act (MQSA; P.L. 102-539), which went into effect in 1994 and remains in effect with reauthorizations in 1998, 2004, and 2007. The MQSA mandates requirements for facilities perform- ing mammography, including equipment and quality assur- ance requirements, as well as personnel qualifications for physicians, radiologic technologists, and medical physicists involved in the performance of mammography in the United States (Box 1.2).
This chapter outlines the basics of image acquisition using SFM, digital mammography, and DBT. It reviews the quality assur- ance requirements for mammography stipulated by the MQSA and also describes the essentials of CAD in mammography.
Chapter 1
Mammography Acquisition
Screen-Film, Digital Mammography and Tomosynthesis, the Mammography Quality Standards Act, and
Computer-Aided Detection
R. Edward Hendrick, Debra M. Ikeda, and Kanae K. Miyake
CHAPTER OUTLINE
TECHNICAL ASPECTS OF MAMMOGRAPHY IMAGE ACQUISITION
Screen-Film Mammography Image Acquisition Digital Mammography Image Acquisition Tomosynthesis Acquisition
Views and Positioning
Image Labeling in Mammography IMAGE EVALUATION AND ARTIFACTS
QUALITY ASSURANCE IN MAMMOGRAPHY AND THE MAMMOGRAPHY QUALITY STANDARDS ACT
Screen-Film Mammography Quality Control
Full-Field Digital Mammography Quality Assurance and Quality Control
Digital Breast Tomosynthesis Quality Assurance and Quality Control
COMPUTER-AIDED DETECTION CONCLUSION
KEY ELEMENTS
SUGGESTED READINGS
BOX 1.1 Mammography Screening
Recommendations for Normal Risk Women from Several Major Organizations
American College of Radiology and Society of Breast Imaging:
Annual screening starting at age 40 and continuing until a woman’s life expectancy is less than 5-7 years
American Cancer Society: Annual screening ages 45-54, then bi- ennial screening until a woman’s life expectancy is less than 10 years, with the option to begin annual screening at age 40 and to continue annual screening beyond age 54.
United States Preventive Services Task Force: Biennial screening ages 50-74.
TECHNICAL ASPECTS OF MAMMOGRAPHY IMAGE ACQUISITION
Mammography is performed on specially designed, dedicated x-ray machines using either x-ray film and paired fluorescent screens (SFM) or digital detectors to capture the image. All mam- mography units are comprised of a rotating anode x-ray tube with matched filtration for soft-tissue imaging, a breast compres- sion plate, a moving grid, an x-ray image receptor, and an auto- matic exposure control (AEC) device that can be placed under or detect the densest portion of the breast, all mounted on a rotating C-arm (Fig. 1.1). A technologist compresses the patient’s breast between the image receptor and compression plate for a few seconds during each exposure. Breast compression is impor- tant because it spreads normal fibroglandular tissues so that can- cers can be better seen on the superimposed structured noise pattern of normal breast tissues. It also decreases breast thick- ness, decreasing exposure time, radiation dose to the breast, and the potential for image blurring as a result of patient motion and unsharpness.
Women worry about breast pain from breast compression and about the radiation dose from mammography. Breast pain during compression varies among individuals and may be decreased by obtaining mammograms 7 to 10 days after the onset of menses when the breasts are least painful. Breast pain is also minimized by taking oral analgesics, such as acetaminophen, before the mammogram or by using appropriately designed foam pads that cushion the breast without adversely affecting image quality or increasing breast dose.
Current mammography delivers a low dose of radiation to the breast. The most radiosensitive breast tissues are the epithelial cells, which, along with connective tissues, make up fibroglandu- lar elements. The best measure of breast dose is mean glandular dose, or the average absorbed dose of ionizing radiation to the radiosensitive fibroglandular tissues. The mean glandular dose received by the average woman is approximately 2 mGy (0.2 rad) per exposure or 4 mGy (0.4 rad) for a typical two-view examina- tion. Radiation doses from digital mammography exposures tend to be 20% to 30% lower than those from SFM. Radiation doses to thinner compressed breasts are substantially lower than doses to thicker breasts.
The main patient risk from mammographic radiation is the possible induction of breast cancer 5 to 30 years after exposure.
The estimated risk of inducing breast cancer is linearly pro- portional to the radiation dose and inversely related to age at exposure. The lifetime risk of inducing a fatal breast cancer as a result of two-view mammography in women aged 45 years old at exposure is estimated to be about 1 in 100,000 (Hendrick, 2010).
For a woman aged 65 at exposure, the risk is less than 0.3 in 100,000. The benefit of screening mammography is the detection of breast cancer before it is clinically apparent. The likelihood of an invasive or in situ cancer present in a woman screened at
age 45 is about 1 in 500. The likelihood that the cancer would be fatal in the absence of mammography screening is about 1 in 4, and the likelihood that screening mammography will convey a mortality benefit is 15% (RCT estimate for women aged 40–49) to about 45% (observational study estimate). Hence, the likelihood of screening mammography saving a woman’s life at this age is about 1 in 4400 to 1 in 13,000, yielding a benefit-to-risk ratio of 8:1 to 23:1. For a woman aged 65 at screening, the likelihood of a mortality benefit from mammography is about 1 in 2000 to 1 in 4000 (assuming a 25% to 50% mortality benefit), yielding a benefit-to-risk ratio of approximately 90:1 to 180:1. Screening mammography is only effective when regular periodic exams are performed.
The generator for a mammography system provides power to the x-ray tube. The peak kilovoltage (kVp) of mammogra- phy systems is lower than that of conventional x-ray systems, because it is desirable to use softer x-ray beams to increase both soft-tissue contrast and the absorption of x-rays in the image receptor. Low kVp is especially important for SFM, in which screen phosphor thickness is limited to minimize image blur.
Typical kVp values for mammography are 24 to 32 kVp for molybdenum (Mo) targets and 26 to 35 kVp for rhodium (Rh) or tungsten (W) targets. A key feature of mammography genera- tors is the electron beam current (milliampere [mA]) rating of the system. The higher the mA rating, the shorter is the expo- sure time for total tube output (milliampere second [mAs]). A compressed breast of average thickness (5 cm) requires about 150 mAs at 26 kVp to achieve proper film densities in SFM. If the tube rating is 100 mA (typical of the larger focal spots used for nonmagnification mammography), the exposure time would be 1.5 seconds. A higher output system with 150-mA output would cut the exposure time to 1 second for the same com- pressed breast thickness and kVp setting. Because of the wide range of breast thicknesses, exposures require mAs values rang- ing from 10 to several hundred mAs. Specifications for genera- tors are listed in Box 1.3.
BOX 1.2 Mammography Quality Standards Act of 1992
Congressional act to regulate mammography
Regulations enforced by the Food and Drug Administration (FDA) require yearly inspections of all U.S. mammography facilities All mammography centers must comply; noncompliance results
in corrective action or closure
Falsifying information submitted to the FDA can result in fines and jail terms
Regulations regarding equipment, personnel credentialing and continuing education, quality control, quality assurance, and day-to-day operations
C-arm
Foot pedals Bucky (moving grid) and digital detector or film cassette holder Compression paddle Field limiting cone
Collimator
X-ray tube Radiation
shield
Remote hand switch Control panel
C-arm foot pedal FIG. 1.1 Components of an x-ray mammography unit.
BOX 1.3 Mammography Generators Provide 24–32 kVp, 5–300 mA
Half-value layer between kVp/100 + 0.03 and kVp/100 + 0.12 (in millimeters of aluminum) for Mo/Mo anode/filter material Average breast exposure is 26–28 kVp (lower kVp for thinner or
fattier breasts, higher kVp for thicker or denser breasts) Screen-film systems deliver an average absorbed dose to the glan-
dular tissue of the breast of 2 mGy (0.2 rad) per exposure
Mo, molybdenum.
The most commonly used anode/filter combination is Mo/Mo consisting of an Mo anode (or target) and an Mo filter (25–30 μm thick). This is used for thinner compressed breasts (<5 cm thick).
Most current manufacturers also offer an Rh filter to be used with the Mo target (Mo/Rh), which produces a slightly more penetrat- ing (harder) x-ray beam for use with thicker breasts. Some manu- facturers offer other target materials, such as Rh/Rh, which is an Rh target paired with an Rh filter, and a W target paired with a Rh filter (W/Rh or with an aluminum [Al] filter [W/Al]). These alternative anode/filter combinations are designed for thicker (>5 cm) and denser breasts. Typically, higher kVp settings are used with these alternative target/filter combinations to create a harder x-ray beam for thicker breasts, because fewer x-rays are attenuated with a harder x-ray beam (Box 1.4). One of the best parameters to measure the hardness or penetrating capability of an x-ray beam is the half-value layer (HVL), which represents the thickness of Al that reduces the x-ray exposure by one-half. The harder the x-ray beam, the higher is the HVL. The typical HVL for mammography is 0.3 to 0.5 mm of Al. The Food and Drug Administration (FDA) requires that the HVL for mammography cannot be less than kVp/100 ± 0.03 (in millimeters of Al), so that the x-ray beam is not too soft (ie, does not contain too many low- energy x-rays that contribute to breast radiation dose but not to image contrast because they are all absorbed in breast tissue).
For example, at 28 kVp the HVL cannot be less than 0.31 mm of Al. There is also an upper limit on the HVL that depends on the target–filter combination. For Mo/Mo, the HVL must be less than kVp/100 +0.12 (in mm of Al); thus, for 28 kVp, the HVL must be less than 0.4 mm of Al.
The usual mammography focal spot size for standard contact (ie, nonmagnification) mammography is typically 0.3 mm. Mag- nification mammography requires a smaller focal spot, (about 0.1 mm) to reduce penumbra (geometric blurring of structures in the breast produced because the breast is closer to the x-ray source and farther from the image receptor to produce greater
“geometric” magnification). The effect of focal spot size on reso- lution in the breast is tested by placing a line pair (lp) pattern in the location of the breast at a specific distance (4.5 cm) from the breast support surface. For SFM, the larger 0.3-mm mam- mography focal spot used for standard, contact mammography should produce an image that resolves at least 11 lp/mm when the lines of the test pattern run in the direction perpendicular to the length of the focal spot (this measures the blurring effect of the length of the focal spot) and at least 13 lp/mm when the lines run parallel to the focal spot (measuring the blurring effect of the width of the focal spot). Thus, although the SFM image receptor can resolve 18 to 21 lp/mm, the geometry of the breast in contact mammography and the finite-sized larger focal spot reduce the limiting spatial resolution of the system to 11 to 15 lp/mm in the breast. The limiting spatial resolution of digital mammography systems is less (5–10 lp/mm), caused by pixelization of the image by the digital image receptor. In digital, a line is 1 pixel width, and a line pair is 2 pixels. For example, for a digital detector with 100-micron (0.1-mm) pixel size or pitch (the center-to-center distance between adjacent pixels), a line pair consists of 2 pixels or 200 microns (0.2 mm). Therefore, one can fit five line pairs (at 0.2 mm each) into a 1-mm length, or the
detector has a limiting spatial resolution of 5 lp/mm. By similar reasoning, a digital detector with 50-micron pixels has a limiting spatial resolution of 10 lp/mm.
The x-ray tube and image receptor are mounted on opposite ends of a rotating C-arm to obtain mammograms in almost any projection. The source-to-image receptor distance (SID) for mam- mography units must be at least 55 cm for contact mammogra- phy. Most systems have SIDs of 65 to 70 cm.
Geometric magnification is achieved by moving the breast farther from the image receptor (closer to the x-ray tube) and switching to a small focal spot, about 0.1 mm in size (Fig. 1.2).
Placing the breast halfway between the focal spot and the image receptor (see Fig. 1.2B) would magnify the breast by a factor of 2.0 from its actual size to the image size because of the divergence of the x-ray beam. The MQSA requires that mam- mography units with magnification capabilities must provide at least one fixed magnification factor of between 1.4 and 2.0 (Table 1.1). Geometric magnification makes small, high-contrast structures such as microcalcifications more visible by making them larger relative to the noise pattern in the image (increas- ing their signal-to-noise ratio [SNR]). Optically or electronically magnifying a contact image, as is done with a magnifier on SFM or using a zoom factor greater than 1 on a digital mammogram, does not increase the SNR of the object relative to the back- ground, because both object and background are increased in size equally. To avoid excess blurring of the image with geo- metric magnification, it is important to use a sufficiently small focal spot (usually 0.1 mm nominal size) and not too large a magnification factor (2.0 or less). When the small focal spot is selected for geometric magnification, the x-ray tube output is decreased by a factor of 3 to 4 (to 25–40 mA) compared with that from a large focal spot (80–150 mA). This can extend imag- ing times for magnification mammography, even though the grid is removed in magnification mammography. The air gap between the breast and image receptor provides adequate scat- ter rejection in magnification mammography without the use of an antiscatter grid.
Collimators near the x-ray tube control the size and shape of the x-ray beam to decrease patient exposure to tissues beyond the compressed breast and image receptor. In mammography, the x-ray beam is collimated to a rectangular field to match the image receptor rather than the breast contour, because x-rays striking the image receptor outside the breast do not contrib- ute to breast dose. By federal regulation, the x-ray field cannot extend beyond the chest wall of the image receptor by more than 2% of the SID. Thus for a 60-cm SID unit, the x-ray beam can extend beyond the chest wall edge of the image receptor by no more than 1.2 cm.
The compression plate and image receptor assembly hold the breast motionless during the exposure, decreasing the breast thickness and providing tight compression, better separating fibroglandular tissues in the breast (Fig. 1.3). The compression plate has a posterior lip that is more than 3 cm high and usually is oriented at 90 degrees to the plane of the compression plate at the chest wall. This lip keeps chest wall structures from super- imposing and obscuring posterior breast tissue in the image. The compression plate must be able to compress the breast for up to 1 minute with a compression force of 25 to 45 lb. The com- pression plate can be advanced by a foot-controlled motorized device and adjusted more finely with hand controls. Because the radiation dose to the breast is decreased in thinner breasts, breast compression, which thins the breast, also decreases radia- tion dose.
Screen-Film Mammography Image Acquisition In SFM, the image receptor assembly holds a screen-film cassette in a carbon-fiber support with a moving antiscatter grid in front of the cassette and an AEC detector behind it (see Fig. 1.3A).
BOX 1.4 Anode-Filter Combinations for Mammography
Mo/Mo Mo/Rh Rh/Rh
W/Rh, W/Ag, or W/Al
Ag, silver; Al, aluminum; Mo, molybdenum; Rh, rhodium; W, tungsten.
Screen-film image receptors are required to be 18 × 24 cm and 24 × 30 cm in size to accommodate both smaller and larger breasts (Box 1.5). Each size image receptor must have a mov- ing antiscatter grid composed of lead strips with a grid ratio (defined as the ratio of the lead strip height to the distance between strips) between 3.5:1 and 5:1. The reciprocating grid moves back and forth in the direction perpendicular to the grid lines during the radiographic exposure to eliminate grid lines in the image by blurring them out. One manufacturer uses a hexagonal-shaped grid pattern to improve scatter rejection; this grid is also blurred by reciprocation during exposure. Use of
a grid improves image contrast by decreasing the fraction of scattered radiation reaching the image receptor. Grids increase the required exposure to the breast by approximately a factor of 2 (the Bucky factor), because of the attenuation of primary, as well as scattered, radiation. Grids are not used with magnifi- cation mammography. Instead, in magnification mammography, scatter is reduced by collimation and by rejection of scattered x-rays due to a significant air gap between the breast and image receptor.
The AEC system, also known as the phototimer, is calibrated to produce a consistent film optical density (OD) by sampling the x-ray beam after it has passed through the breast support, grid, and cassette. The AEC detector is usually a D-shaped sen- sor that lies along the midline of the breast support and can be positioned by the technologist closer to or farther from the chest wall. If the breast is extremely thick or inappropriate technique factors are selected, the AEC will terminate exposure at a specific backup time (usually 4–6 seconds or 300–750 mAs) to prevent tube overload or melting of the x-ray track on the anode.
Screen-film cassettes used in mammography have an inherent spatial resolution of 18 to 21 lp/mm. Such resolution is achieved typically by using a single-emulsion film placed emulsion side
C D
A B
Magnification stand
FIG. 1.2 Magnification mammography improves resolution. Nonmagnified, or contact, mammography (A) and geometrically magnified mammography (B). Using a small or microfocal (0.1-mm) focal spot with the configura- tion shown in (B), higher spatial resolution can be obtained in the breast compared with (A) in which a larger (0.3-mm) focal spot is used. (C) Craniocaudal mammogram shows a possible benign mass in the inner breast.
(D) Microfocal magnification shows irregular borders not seen on the standard view.
TABLE 1.1 Mammography Focal Spot Sizes and Source- to-Image Distances
Mammography
Type Nominal Focal
Spot Size (mm) Source-to-Image Distance (cm)
Contact film screen 0.3 ≥55
Magnification 0.1 ≥55
The Mammography Quality Standards Act requires magnification factors between 1.4 and 2.0 for systems designed to perform magnification mammography.
down against a single intensifying screen that faces upward toward the breast in the film cassette. The single-emulsion film with a single intensifying screen is used to prevent the paral- lax unsharpness and crossover exposure that occur with double- emulsion films and double-screen systems. One manufacturer has introduced a double-emulsion film with double-sided screens (EV System, Carestream Health, formerly Eastman Kodak Health Group) with a thinner film emulsion and screen on top to mini- mize parallax unsharpness. Most screen-film processing combi- nations have relative speeds of 150 to 200, with speed defined as the reciprocal of the x-ray exposure (in units of Roentgen) required to produce an OD of 1.0 above base plus fog (1.15–1.2, because base plus fog OD is 0.15–0.2).
Film processing involves development of the latent image on the exposed film emulsion. The film is placed in an auto- matic processor that takes the exposed film and rolls it through liquid developer to amplify the latent image on the film, reducing the silver ions in the x-ray film emulsion to metallic silver, resulting in film darkening in exposed areas.
The developer temperature ranges from 92°F to 96°F. The film is then run through a fixer solution containing thiosulfate (or hypo) to remove any unused silver and preserve the film. The film is then washed with water to remove residual fixer, which if not removed can cause the film to turn brown over time. The film is then dried with heated air.
Film processing is affected by many variables, and the most important is developer chemistry (weak or oxidized chemistry makes films lighter and lower contrast), developer temperature (too hot may make films darker, and too cool may make films lighter), developer replenishment (too little results in lighter,
lower contrast films), inadequate agitation of developer, and uneven application of developer to films (causing film mottling;
Table 1.2).
Film viewing conditions must be appropriate (Fig. 1.4).
Because mammography viewboxes have high luminance levels (>3000 cd/m2 [3000 nit]), mammograms should be masked so that no light strikes the radiologist’s eye without passing through the exposed film. Because of high luminance levels film collima- tion of x-ray exposure should be rectangular and extend slightly beyond the edge of the image receptor so that film is darkened to its edges. Viewbox luminance should be reasonably uniform across all viewbox panels. In addition, the ambient room illumi- nation should be low (<50 lux, and preferably less) to minimize
“dazzle glare” from film surfaces. Both viewbox luminance and room illumination should be checked annually by the medical physicist as part of the site quality control program, as specified in the ACR Mammography Quality Control Manual.
Digital Mammography Image Acquisition
In digital mammography, the image is obtained in the same manner as in screen-film mammography, using a compression
Grid Detector
panel Compression
paddle
Carbon-fiber surface of image receptor
support Posterior
lip 3 cm
90 degrees Grid
Cassette Compression
paddle
Carbon-fiber surface of image receptor
support Posterior
lip 3 cm
90 degrees
AEC
detector Screen Film
A B
FIG. 1.3 Schematic of a compression paddle and image receptor of screen-film mammography (A) and of digital mammography (B), showing the components of the cassette holder, the compression plate, and the breast. The film emulsion faces the screen. AEC, automatic exposure control. (Adapted from Farria DM, Kimme-Smith C, Bassett LW: Equipment, processing, and image receptor. In Bassett LW, editor: Diagnosis of diseases of the breast, Philadelphia, 1997, WB Saunders, pp 32 and 34.)
BOX 1.5 Compression Plate and Imaging Receptor Both 18 × 24-cm and 24 × 30-cm sizes are required
A moving grid is required for each image receptor size
The compression plate has a posterior lip >3 cm and is oriented 90 degrees to the plane of the plate
Compression force of 25–45 lb
Paddle advanced by a foot motor with hand-compression adjustments
Collimation to the image receptor and not the breast contour
TABLE 1.2 Variables Affecting Image Quality of Screen- Film Mammograms
Film too dark Developer temperature too high Wrong mammographic technique
(excessive kVp or mAs) Excessive plus-density control Film too light Inadequate chemistry or replenishment
Developer temperature too low Wrong mammographic technique Lost contrast Inadequate chemistry or replenishment
Water to processor turned off Changed film
Film turns brown Inadequate rinsing of fixer Motion artifact Movement by patient
Inadequate compression applied Inappropriate mammographic technique
(long exposure times)
plate and an x-ray tube, with the screen-film cassette replaced by a digital detector (see Fig. 1.3B). Digital image acquisition has several potential advantages in terms of image availability, image processing, making annotations (Fig. 1.5), and CAD. One advantage is elimination of the film processor, which elimi- nates artifacts and image noise added during film processing.
The image contrast of digital mammography is different among vendors depending on the digital look-up curve, which governs
how digital signals are translated into pixel gray scale values.
Figure 1.6 shows digital mammograms that were obtained with two machines from different vendors demonstrating how the image contrast varies.
Digital mammography uses indirect or direct digital detec- tors. Indirect digital detectors use a fluorescent screen made of materials such as cesium iodide (CsI) to convert each absorbed x-ray to hundreds of visible light photons. Behind the fluorescent material, light-sensitive detector arrays made of materials such as amorphous silicon diodes or charge-coupled devices measure the produced light pixel by pixel. The weak electronic signal measured in each pixel is amplified and sent through an analog- to-digital converter, enabling computer storage of each pixel’s measured detector signal.
Direct digital detectors use detector elements that capture and count x-rays directly, although amplification and analog-to- digital conversion are still applied. Another method to produce digital mammograms involves amorphous selenium. An amor- phous selenium plate is an excellent absorber of x-rays and an excellent capacitor, storing the charge created by ionization when x-rays are absorbed. After exposure, an electronic device is used to read out the charge distribution on the selenium plate, which is in proportion to local exposure. This can be done by scanning the selenium plate with a laser beam or by placing a silicon diode array in contact with one side of the plate, with bias voltage applied, to read out the stored charge.
Each of these methods allows production of high-resolution digital images.
Another approach to full-field digital mammography (FFDM) is computed radiography (CR), which uses a photostimulable phosphor composed of barium fluorobromide doped with europium (BaFBr:Eu). Computed radiography uses the same dedicated mammography units as SFM, replacing the screen-film cassettes and film processor with CR cassettes (in sizes of 18 × 24 cm and 24 × 30 cm) and a CR processor. The phosphor plate within the CR cassette is used to absorb x-rays just as the screen in a screen-film cassette. Rather than emitting light immediately after exposure (through fluorescence), x-ray absorption in the phosphor causes electrons within the phosphor crystals to be promoted to higher energy levels (through photostimulation).
FIG. 1.4 Film-viewing conditions. Because mammography view- boxes have high luminance levels (>3000 cd/m2 [3000 nit]), mammograms should be masked so that no light strikes the radi- ologist’s eye without passing through the exposed film. Because of the high luminance, film collimation should be rectangular and extend slightly beyond the edge of the image receptor so that film is darkened to its edges. Viewbox luminance should be reasonably uniform across all viewbox panels. In addition, the ambient room illumination should be low (<50 lux, and preferably less) to mini- mize “dazzle glare” from film surfaces. Both viewbox luminance and room illumination should be checked annually by the medical physicist as part of the site quality control program (see the ACR Mammography Quality Control Manual, 1999 edition).
A B
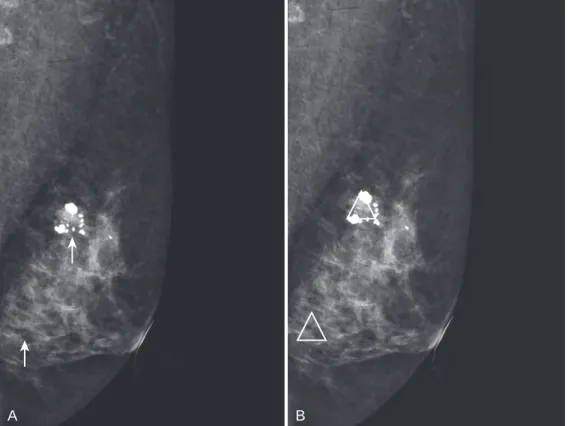
cc mag
find on lat and do mag lat
cc mag spot us scan
FIG. 1.5 Using digital mammography and picture archiving and communication systems (PACS) for screening re- call, two spiculated masses representing infiltrating ductal carcinoma on the craniocaudal view (A) were marked by computer-aided detection and were recalled. The radiologist annotates the images and sends them to PACS for the technologist to retrieve when the patient returns for workup (B).
The plate is removed from the cassette in the CR processor and a red laser light scans the phosphor plate point by point, releas- ing electrons and stimulating emission of a higher energy (blue) light in proportion to x-ray exposure. In conventional x-ray sys- tems, CR phosphor plates have an opaque backing and are read from only one side. In at least one FDA-approved CR system for
mammography (Fuji 5000D CR, Fujifilm Medical Systems), the CR cassette base is transparent and light emitted from the plate during laser scanning is read from both sides to increase reading efficiency.
No matter which digital detector is used, its job is to measure the quantity of x-rays passing through the breast, compression plate, grid (in contact mammography), and breast holder. The sig- nal measured in each pixel is determined by the total attenuation in the breast along a given ray.
The choice of an analog-to-digital converter determines how many bits of memory will be used to store the signal for each pixel;
the more bits per pixel, the more dynamic range there is for the image, but at a higher digital data storage cost. Specifically, if 12 bits per pixel are used, 212 or 4096 signal values can be stored. If 14 bits per pixel are used, 214 or 16,384 signal values can be stored. Usu- ally 12- to 14-bit storage per pixel is used. In either case, 2 bytes per pixel are required (8 bits = 1 byte) to store the image. For example, the GE Senographe 2000D and DS digital detectors have 1920 × 2304 pixel arrays, or 4.4 million pixels, requiring 8.8 million bytes (8.8 megabytes; MB) of storage per image. Other FFDM systems require up to 52 MB of storage per image.
Screen-film image receptors used for mammography have a line pair resolution of 18 to 21 lp/mm. To equal this spatial reso- lution, a digital detector would require 25-micron pixels, which would yield noisier images and pose a storage issue caused by the large data sets required to store those images. FFDM systems have spatial resolutions ranging from 5 lp/mm (for 100-micron pixels) to 10 lp/mm (for 50-micron pixels). In digital mammog- raphy systems, it is the size of the pixels, or more correctly their center-to-center distance (pitch), that determines (and limits) the spatial resolution of the imaging chain.
The lower limiting spatial resolution of FFDM systems com- pared with film is offset by the increased contrast resolution of FFDM systems. Unlike SFM, in which the image cannot be manipulated after exposure and processing, FFDM images can be optimized after image capture by image postprocessing and adjustment of image display. For fixed digital detectors, such as CsI and silicon diode arrays (used by GE) and selenium and amorphous silicon diode arrays (used by Hologic and Siemens), one image-processing step that can minimize image noise and structured artifacts is flat-field correction, or gain correction of each acquired digital image. This is done by making and stor- ing a sensitivity map of the digital detector and using that map to correct all exposures. Typically, slot-scanning devices (such as the older SenoScan digital system, Fischer Medical Systems) and CR systems do not perform flat-field correction of digital images.
Beyond this, all digital systems have the ability to process the acquired digital image to minimize or eliminate the signal dif- ference that results from the roll-off in thickness of the breast toward the skin line (thickness equalization); some devices add processing to help enhance the appearance of microcalcifica- tions (eg, GE Premium View and FineView). The window width and window level for all digital images viewed with soft copy display on review workstations can be adjusted, changing the contrast and brightness of the images, respectively, as well as digitally magnifying images.
Another important difference between SFM and FFDM is that screen-film images have a linear relationship between the loga- rithm of x-ray exposure and film OD only in the central portion of the characteristic curve. In FFDM, there is a linear relation- ship between x-ray exposure and signal over the entire dynamic range of the detector. Thus digital images (at least their “raw”
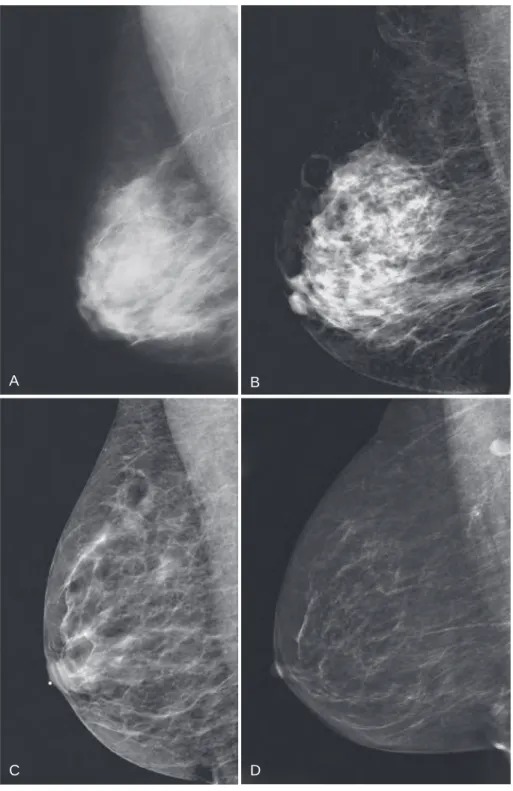
or “for processing” presentation) do not suffer contrast loss in underexposed or overexposed areas of the mammogram (as long as detector saturation does not occur); instead, they show similar contrast over the full dynamic range of signals. Different manufacturers apply different look-up tables to digital images in transforming them from initially acquired raw or for processing images to processed or for presentation images. These different GE
Hologic
A
B
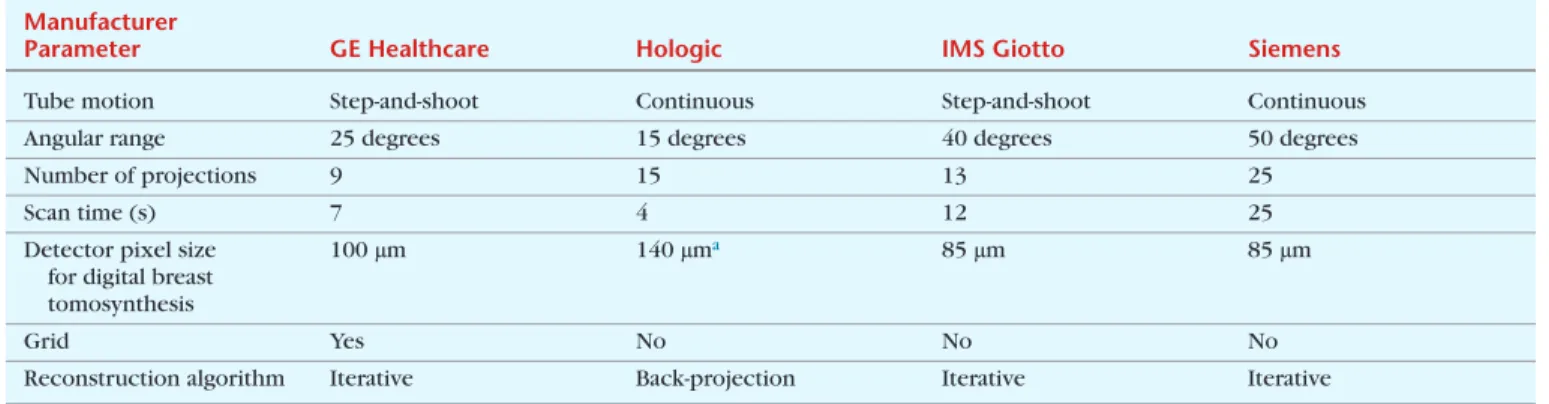
FIG. 1.6 Image contrast of digital mammography differs among vendors because of differences in image acquisition and post- processing. Full-field digital mammogram obtained with a GE ma- chine (GE Healthcare, Milwaukee, WI) (A) and with Hologic ma- chine (Hologic, Bedford, MA) (B) in the same patient. Mediolateral oblique (left) and craniocaudal views (right) are shown. The skin line and the Cooper’s ligaments are emphasized in B compared with A.
look-up tables affect the contrast of final presentation digital images. Some, such as Hologic’s linear look-up table, yield higher contrast images, whereas others, such as GE’s sigmoidal look-up table, yield images presented with less contrast and more like screen-film images. In either case, thickness equalization is used to equalize signal differences from the center of the breast to the skin line. FFDM also has the advantage of eliminating the variability and noise added by film processing that is inherent to SFM.
In terms of breast dose, FFDM has a mean glandular dose lower than, or comparable with, the radiation dose of SFM.
Results from the American College of Radiology Imaging Net- work (ACRIN) DMIST found the average single-view mean glan- dular dose for FFDM to be 1.86 mGy, 22% lower than the average SFM mean glandular dose of 2.37 mGy (Hendrick et al., 2010).
Specific manufacturers, especially those using slot-scanning tech- niques, produce lower doses than SFM. Slot-scanning systems have a narrow slot of detector elements that are scanned under the breast in synchronization with a narrow fan beam of x-rays swept across the breast. This design, although more technically difficult to implement, has the advantage of eliminating the need for a grid to reduce scattered radiation. Scatter is partially elimi- nated by the narrow slot itself. The absence of a grid reduces the amount of radiation to the breast needed to get the same SNR in the detector. Most full area digital detectors also have dem- onstrated lower breast doses compared with SFM, especially for thicker breasts.
Once captured and processed, the image data are transferred to a reading station for interpretation on high-resolution (2048
× 2560 or 5-Mpixel) monitors or printed on film by laser imag- ers (with approximately 40-micron spot sizes, so that film print- ing does not reduce the inherent spatial resolution of digital mammograms) for interpretation of hardcopy images on film
viewboxes or alternators (Fig. 1.7). Digital data can be stored on optical disks, magnetic tapes, picture archiving and communica- tion systems (PACS), or CDs for later retrieval.
The MQSA states that FFDM images must be made avail- able to patients as hardcopy films, as needed, which means the facility must have access to an FDA-approved laser printer for mammography that can reproduce the gray scale and spatial resolution of FFDM images. The images may also be given to the patient on a CD with an image viewer, if this is acceptable to the patient.
A number of studies have evaluated the performance of FFDM compared with SFM for screening asymptomatic women for breast cancer. Early studies showed comparable or slightly worse results (but not statistically significant differences) for receiver operating characteristic (ROC) curve area and sensitiv- ity (Lewin et al., 2001, 2002) or cancer detection rate (Skaane and Skjennald, 2004) of FFDM compared with SFM. Larger stud- ies, however, showed some benefits of FFDM compared with SFM. The ACRIN DMIST paired study (Pisano et al., 2005b) showed no difference overall, but found that FFDM had statisti- cally significantly higher ROC curve areas than SFM for women under age 50, for premenopausal and perimenopausal women, and for women with denser breasts (Breast Imaging Report- ing and Data System [BI-RADS] density categories C and D).
These findings are supported by Kerlikowske et al. (2011) who showed in clinical practice in the United States that FFDM had higher, but not necessarily significantly higher, sensitivity than SFM in most age groups, including women 40 to 49, premeno- pausal and perimenopausal women, and women with extremely dense breasts. The sensitivity of FFDM was significantly higher than for SFM among women aged 40 to 79 who had estrogen receptor– negative cancers, and especially so among women aged 40 to 49 (95% versus 55%; p = 0.007) The Oslo II trial
RAID PACSserver
Hi-resolution multimodality workstations Long-term storage Short-term storage
Digital acquisition and viewing stations
CD or DLT jukeboxes
FIG. 1.7 Schematic of a full-field digital mammography unit, workstation, picture archiving and communication system (PACS), or long-term storage and workstation displays. CD, compact disc; DLT, digital linear tape; RAID, redundant array of independent disks. (Adapted from figures provided by GE Healthcare, Waukesha, WI.)
BOX 1.6 Thirty-Five Food and Drug Administration-Approved Digital Mammography Units (as of May 2016) and Approval Dates
• GE Senographe 2000D Full Field Digital Mammography (FFDM) System: 1/28/00
• Fischer Imaging SenoScan Full Field Digital Mammography (FFDM) System: 9/25/01
• Lorad Digital Breast Imager Full Field Digital Mammography (FFDM) System: 3/15/02
• Lorad/Hologic Selenia Full Field Digital Mammography (FFDM) System: 10/2/02
• GE Senographe DS Full Field Digital Mammography (FFDM) System: 2/19/04
• Siemens Mammomat Novation DR Full Field Digital Mammography (FFDM) System: 8/20/04
• GE Senographe Essential Full Field Digital Mammography (FFDM) System: 4/11/06
• Fuji Computed Radiography Mammography Suite (FCRMS):
7/10/06
• Hologic Selenia Full Field Digital Mammography (FFDM) System with a Tungsten target: 11/2007
• Siemens Mammomat Novation S Full Field Digital Mammography