1 Towards an ecological geography of the sea 1 Gradual exploration of oceanic and shelf ecosystems 2 Availability of timely global oceanographic data. Tidal Fronts and Fluvial Currents of Marginal Seas 41 The ubiquitous “horizontal front” on a shallow pycnocline 43 .
Preface
Once again, my former colleagues at what is now the Bedford Institute of Oceanography have given me very willing support. I also remain acutely aware of the debt I owe to the many people who taught me enough about the oceans to risk starting this book, some of whom I listed in the foreword to the first edition in 1998.
Acknowledgments
Toward an Ecological Geography of the Sea
Before we proceed, it will be useful to reflect on how oceanographic research in the late 20th century has changed our understanding of the pelagic ecosystem, and to what extent the new observing systems that have matured in recent years have changed our knowledge changed about how oceanographic and ecological processes can best be partitioned.
The Progressive Exploration of Oceanic and Shelf Ecosystems
These data have already been used to suggest that a response of the oceanic inorganic carbon system to rising levels of carbon dioxide in the atmosphere is already observable. The published studies and datasets resulting from these programs obviously represent only a fraction of the new material available to establish an ecological geography of the sea.
The Availability of Timely Global Oceanographic Data from Satellites
Ten-day global integrations are available for the 1990s on the WOCE CD-ROMs. The analytical model used in the first ocean basin and global estimates of oceanic primary production from satellite data required (i) surface chlorophyll, (ii) assumed photosynthesis-light ratio, (iii) surface irradiance from solar angle and cloud cover climatology and (iv) parameters describing the chlorophyll profile.
Internal Dynamics of Satellite-Observed Algal Blooms
The blooms caused by the southwest monsoon in the Arabian Sea in June and July accumulate no more than 3.0% and 2.3%, respectively, of the production that occurs during each of these months. This is a difficult thing to do satisfactorily, given the complexity of the pelagic food web, not only taxonomically, but also spatially.

Our New Understanding of the Role of Very Small Organisms
Such figures suggest a blurring of the concept of dissolved and particulate organic matter (Longhurst et al., 1992). We should not forget that eukaryotic cells also contribute to the picofraction of the autotrophic cell population.
Biogeographic Partition of the Ocean
It must also continue historically, and an important goal of biogeographers has long been to understand the progressive distribution of species or higher taxonomic groups during the evolution of ocean basins and oceans. For this reason, a criterion very often used in even relatively recent global biogeographic systems of marine biota (e.g. Briggs, 1974) is the degree of endemism of the fauna in each region.
Taxonomic Diversity: The Shifting Baseline of Biogeography
Furthermore, the same technique distinguishes populations of Calanus finmarchicus from different regions of the North Atlantic: fifteen samples of C. This concept has led to the regime change in marine ecosystems that we will encounter frequently in the following chapters.
The Useful Results from 150 Years of Marine Biogeography
With all this one cannot help but agree, but unfortunately it is difficult to know what is on the mind of those who use the term biodiversity: is it political justice, a marketing ploy or an interesting analysis of the processes of microevolution. However, some of the major discontinuities in the distribution of benthic communities match those that form the basis of pelagic biogeography.
Biogeographic Regions of the Pelagos
He suggests that the Temperate zones are bounded equatorward by the Subtropical Convergence of each hemisphere and that, at least in the south, the oceanic Polar Front is the poleward boundary of the Sub-Antarctic zone. Vertical Ekman transport of opposite sign in the two gyres leads to the subduction and equatorward transport of Intermediate Water Masses to the interior of the ocean.
Geographic Component of Benthic–Pelagic Coupling
One was subsequently found in the Bristol Channel and I found another off the coast of Sierra Leone. A strict comparison of the first two pairs of isocommunities from Java and Great Britain showed that within-habitat diversity is similar in the two regions.
From Pristine to Modified Ecosystems
It became firmly established as an invasive species and continues to dominate spring diatom blooms in these regions. The conclusion is inevitable and difficult to deal with in the context of this book and in this troubled age.
Fronts and Pycnoclines
Ecological Discontinuities
Fronts and Frontal Systems
Oceanic Fronts and Eddy Streets
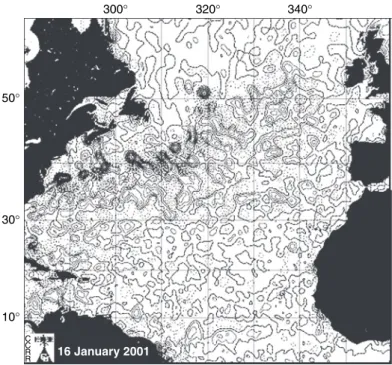
The northern wall of the Gulf Stream in the NW Atlantic forms a continuous feature with a frontal system extending SW-NE across the ocean towards N Scotland. Cyclonic eddies often lie equatorward of anticyclonic eddies, thus forming a ridge system in the SLA field.
Shelf-Edge and Upwelling Fronts
In the Indian Ocean in particular, this eddy field is associated with episodic biological enhancement, apparently forced by appropriate vertical motion associated with eddy dynamics. Here, the upwelling of cooler underground water is translated into offshore movement, usually in the form of cold jets associated with features of coastal morphology.

Tidal Fronts and River Plumes of the Shelf Seas
So not only is physical accumulation of plankton and nekton expected at the front, but the relatively stable, shallow pycnocline area just off the front generally supports the most intense production of phytoplankton. Tett (1981), on the other hand, suggested that vertical eddy diffusion from bottom friction should be stronger at the front than at either side, thus constantly supplying nutrients from the near-bounded layer.
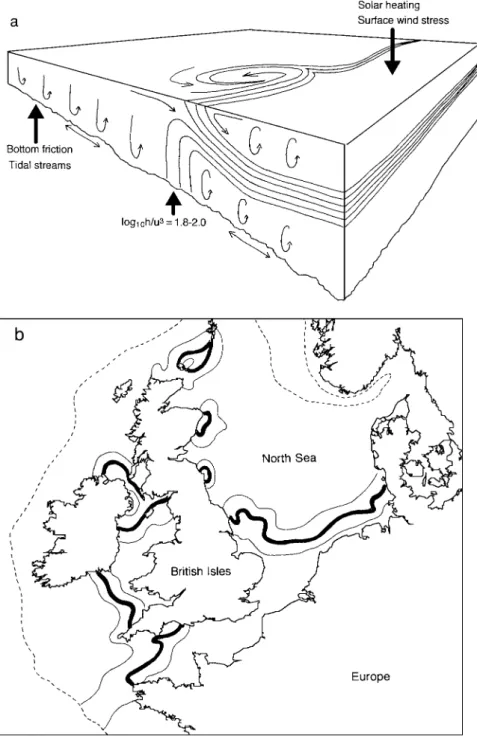
The Ubiquitous “Horizontal Front” at the Shallow Pycnocline
Small herbivores (
Physical Control of Ecological Processes
The resulting changes in the photosynthetic parameters of algal growth will then add new complexity to the overall biological response to irradiance. A simple relationship between seasonal values of Ic and Zcr results in characteristic changes in the strength of seasonal blooms at different latitudes (Follows and Dutkiewicz, 2003).
Ecological Consequences of Mesoscale Eddies and Planetary Waves
The North Atlantic subtropical front (see Chapter 3) is probably typical of mid-ocean frontal systems (Pingree, 1997; Pingree and Sinha, 2000). This is sufficient to account for most of the observed wave propagation seen in the SeaWiFS chlorophyll field, although other mechanisms must contribute.
Stratification and Irradiance: The Consequences of Latitude
Prominent in any textbook on biological oceanography are the ecological consequences of the balance between turbulence and mixing caused by surface wind stress and stratification caused by solar heating. Also due to the equatorward disappearance of the Coriolis parameter, changes in the scale taken by internal wave trains, which are involved in wind mixing of the surface layers of the ocean.
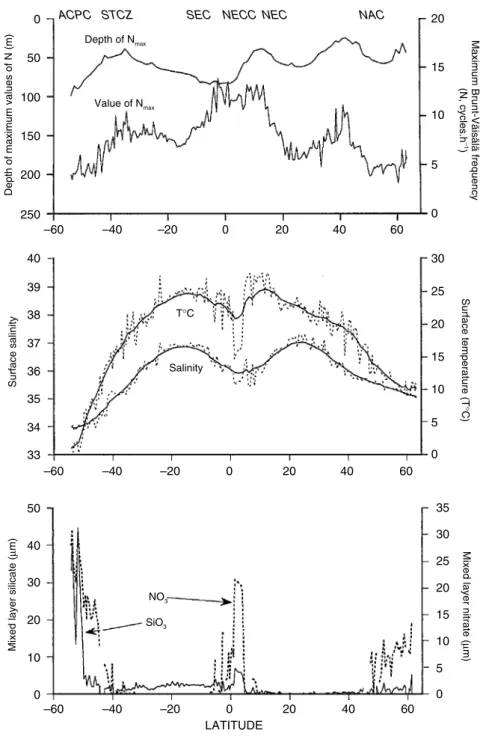
Regional and Latitudinal Resistance to Mixing in the Open Oceans
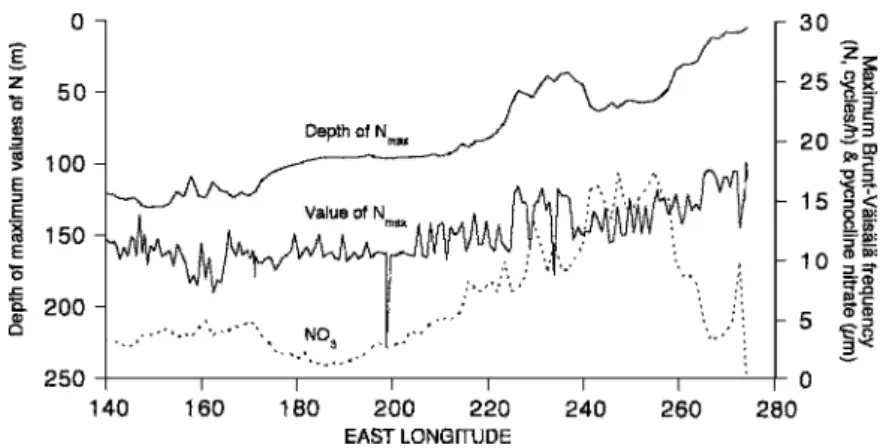
The discontinuity between the relative strengths of the tropical and subtropical pycnoclines is also stronger in the east. Here, an abrupt increase in Nmax values and a decrease in the pycnocline occur at the polar biome boundaries.
Rule-Based Models of Ecological Response to External Forcing
Low nutrient content and low turbulence - Ideally, this represents the phytoplankton in central gyres dominated by picophytoplankton, including autotrophic bacteria. Low Nutrient High Turbulence - This quadrant is either empty or represented by the case of the so-called HNLC conditions in the Southern Ocean.

Case 1—Polar Irradiance-Mediated Production Peak
This, it seems to me, is an inadequate characterization of the ecological conditions we can observe in the sea. To this end, I have proposed (Longhurst, 1985b) that we can classify the ecology of oceanic phytoplankton into six main cases or patterns, defined below, to be divided among the biogeochemical provinces that will be discussed later:.
Case 2—Nutrient-Limited Spring Production Peak
Another informative diagram could be constructed to show the consequences of the fact that nutrients known to be limiting to phytoplankton have three sources: atmospheric, river water, and from subpycnoclinal water. The subsequent gradual replenishment of the mixed layer with nitrate in late summer may be associated with a brief increase in primary production before dissipation due to autumn mixing and decreasing light.
Case 3—Winter–Spring Production with Nutrient Limitation
When the main biomass of these organisms decreases again towards the end of summer, a secondary accumulation of chlorophyll occurs that reaches a weak peak a few weeks later.
Case 4—Small-Amplitude Response to Trade Wind Seasonality
The photographic depth lies deeper, and in some cases much deeper, than the mixed layer. This situation occurs essentially year-round, and the pattern breaks down with deepening of the mixed layer only briefly and only in some regions.
Case 5—Large-Amplitude Response to Monsoon-like Reversal of Trade Winds
Therefore, in some areas that we might like to think of differently as Case 3 models, winter winds can force the mixed layer deeper than the phototic zone for several months seasonally. Equatorial regions of the Pacific Ocean have less seasonality in mixed layer depth, primary production rate, and chlorophyll accumulation than comparable Atlantic regions due to differences in the east–west dimension of the two oceans.
Case 6—Intermittent Production at Coastal Divergences
Even if we argue that ecosystem types are primarily determined by the action of the external environment on plant growth, we must also recognize the moderating effects of consumer organisms. In the jargon of general ecology, we need to evaluate both top-down and bottom-up forcing of the ecosystem.
Coastal Asymmetry, Geomorphology, and Tidal Forcing
The distribution of sediments and water types on the shelf determines, quite precisely, the composition of the benthic invertebrate and demersal fish faunas on the continental shelves. Ecological processes on continental shelves are therefore spatially fragmented, and only predictable from a specific knowledge of the forces that drive this fragmentation.
Nutrient Limitation: The Example of Iron
From there it is only a short step to a striking demonstration of the relationship between the seasonality of chlorophyll biomass and modeled dust deposition in the Southern Ocean (Ericksonet al., 2003). It is easy to see that the surface chlorophyll distribution (and the resulting primary production pattern) does not in any way match the subaerial Fe supply, but instead reflects those physical processes that induce (i) the vertical movement of deeper water into the photic zone and (ii) ) stability in the upper part of the water column.
Nutrient Distribution and the Consequences of Differing Supply Ratios
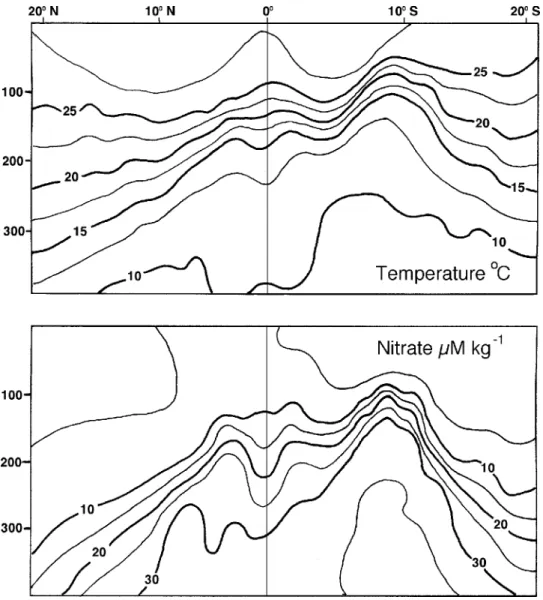
The distribution of nitrate in the oceans is much better described than that of Fe and reflects the formation of the nitrate molecule within the deep sea. Allowing for a modest input (modest, i.e. over a short time scale) from dry deposition, it is reasonable to infer from this calculation that the variable amount of Fe relative to N transported in vertical flux is likely both iron-limited (high-S) and nitrate-limited (low-S) regions in the surface waters of the oceans.
Regional Anomalies in Nutrient Limitation
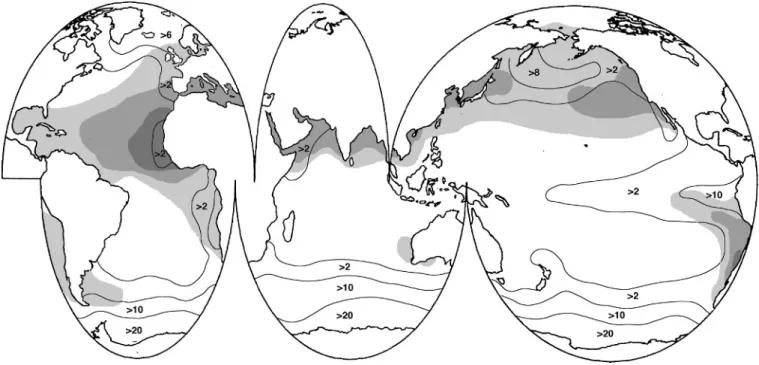
However, residual nitrate values in the euphotic zone of the two oceans are very different (Atlantic, about 05M kg−1; Pacific, 2–10M kg−1NO3). We can assume that the same phenomenon occurs in the Congo plume, because it is the root of the chlorophyll enhancement that lies seasonally over the equatorial currents.
Models of Regional Nutrient Flux and Limitation
How then should we assess the balance between the multiple mechanisms of bloom generation and limitation in the Southern Ocean. We are even uncertain about the relative magnitudes of the fluxes of labile iron across the sea surface and across the nutricline, although this must be critical to any quantitative understanding of Fe limitation in the ocean.
Biomes: The Primary Partition
The Four Primary Biomes of the Upper Ocean
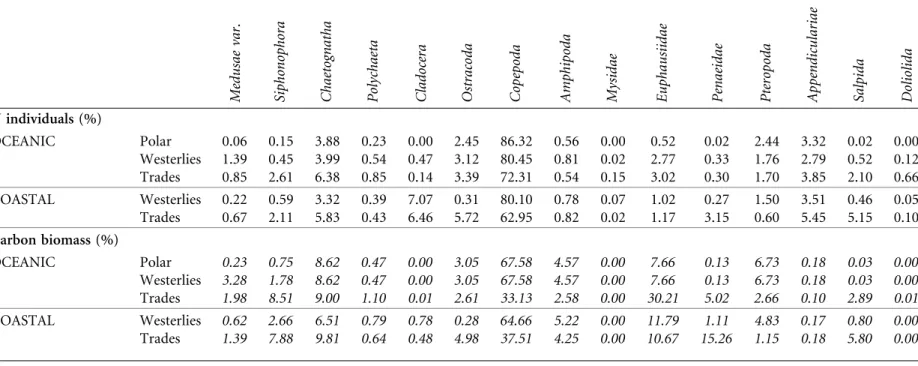
These counts were then regionally and seasonally stratified to represent first-order differences between polar, temperate, and tropical continental shelf oceans and faunas. Other data can also be used to confirm regional boundaries defined differently: consider the example of calanoid diversity in samples from the Continuous Plankton Recorder (CPR) survey in the North Atlantic.
Polar Biome
Apart from the consequences for the standing stock of phytoplankton cells, the annual cycle of the large copepods has another, often neglected, consequence. Less than 1% of the approximately 20,000 species of marine fish occur south of the Antarctic Convergence, and there are no Antarctic species of dense-billed pelagic fish.
Westerlies Biome
Some migratory herring stocks and other schooling clupeids spend much of the year in the open ocean and return to the coastal zone to spawn. Others, such as the North Pacific saury, spend the year in deep water.
Trades Biome
Four pelagic species of the cyanobacterium Trichodesmium(=Oscillatoria) contribute to these macroscopic cellular blooms, which occur seasonally during the windiest period of the year and can color the surface of the sea red as far as the eye can see; The global distribution of actively growing Trichodesmium populations is limited by the seasonal 20C sea surface isotherm (Carpenter, 1989). This is reflected in the temporal stability of the tropical biome and the climactic nature of the ecosystem.
Coastal Biome
In this biome, the pelagic ecosystem is the most taxonomically diverse and represents the climax community of the pelagos. It cannot therefore be assumed that there is a more than general relationship between the production of organic matter in the water column and the response of the benthic community below.
Provinces: The Secondary Compartments
To join part of the Southern Ocean with the Bay of Bengal for fishing purposes is a breathtaking denial of the natural order of the ocean and also (dare I say?) of political reality. The Arctic must be considered a marginal sea in the Atlantic Ocean, to which it is connected through the Fram Strait and the Norwegian-Greenland Sea.
Ecological Provinces in the Open Ocean
And, according to the authors, "if judicious choices are made in grouping the 14 provinces shown," the basic arrangement of provinces used in this book can be reproduced. The partitioning of the ocean required by biogeochemists should be useful for establishing models of (say) phytoplankton primary production to analyze a field of (say) satellite observations of chlorophyll.
Ways of Testing Static Province Boundaries in the Open Ocean
Applied to the North Atlantic provinces, and for the spring and autumn of 2003, this allowed their boundaries to be fine-tuned to match the distribution of properties in the sea during these periods, and suggested that another entity ("Slope Water") with advantage could be integrated into the partition. Finally, the use of an algorithm that isolates diatom-dominated regional phytoplankton biomass from other populations shows that the dynamic boundaries derived from the NW Atlantic temperature field were a good match for the boundaries between diatom-dominated and other phytoplankton populations.
A Statistical Test
This was done by examining the differences between seasonal mean values (for each parameter) across the boundaries between each pair of adjacent counties using analysis of variance and the Bonferroni-Dunn post hoc test. These same parameters confirm the reality of the east-west division of both the subtropical gyre and the tropical regions of the Atlantic Ocean.
Analytical Tests
For all parameters, the most significant boundaries were found to lie between provinces of the coastal and oceanic biomes (Sathyendranath et al., 1995), while within the oceanic provinces the most distinct boundaries lie north and south of the subtropical gyres. and thus between the provinces of the west and the trading biomes. The results obtained in this study almost entirely supported the distribution proposed here for the open Atlantic Ocean: NADR, NAST, NATR, WTRA and SATL.
Biogeographic Tests
In this case, onboard observations of water features down to 200 m were used to identify geographic discontinuities through inferred analyses. I think we can go little further at this point if we can assure ourselves that the boundaries proposed for the open ocean in this book have an objective reality.
Practicable and Useful Partitions in Coastal Seas
Here the Gulf of California is treated as one potential subunit of the California Current Province. I'm not proud of the solution presented, but it's the best I can make of a bad job.
Longer Term Responses: From Seasons to Centuries
Scales of External Forcing
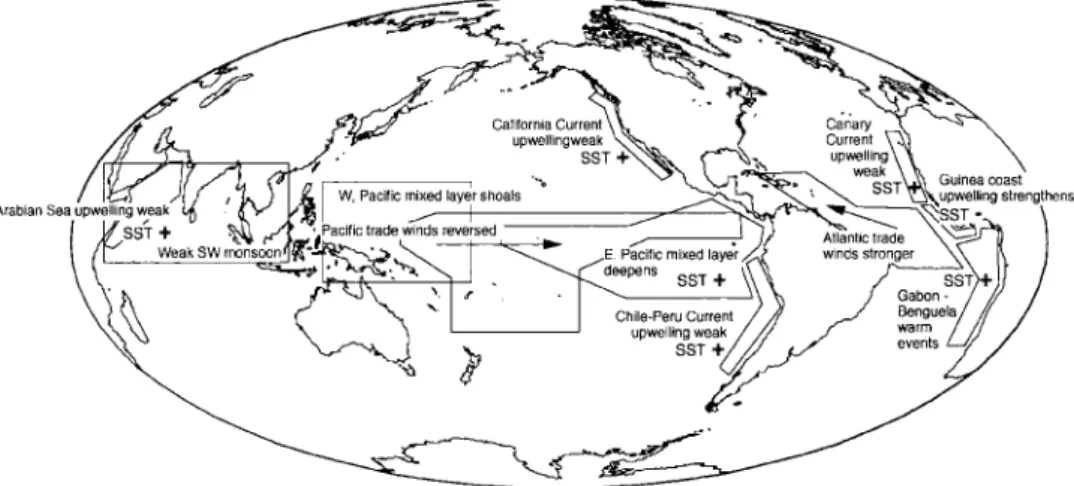
Because the integrated response of the atmosphere, cryosphere and ocean to changes in the Earth's radiation balance includes complex feedback mechanisms and non-linearities, it is not surprising that a steady state is not reached. Consider the Southern Oscillation Index (SOI, discussed later), which is used to indicate two, or sometimes three, states of the circulation of the tropical Pacific Ocean.
Recurrent, ENSO-Scale Changes of State
Anomalous conditions may also occur in the Atlantic trade wind zone during some Niño events, as previously mentioned. The effect of the location of the ITCZ on the surface temperature anomalies in the eastern tropical Atlantic is complex but observable.
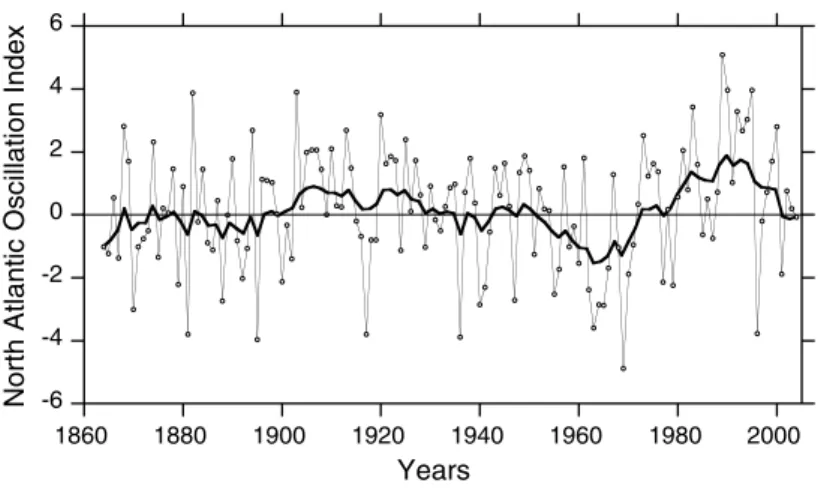
Multidecadal Trends and Changes
Comparison of trends in Cochin sea level and sardine oil catch confirms the predicted relationship. Both fishes provide evidence, in their time-dependent variability, of the extent to which the entire pelagic ecosystem is subject to long-term variability in tropical seas.
Conclusion: Stable Partitions in a Varying Ocean?
There may be some changes in the effective coordinates of the eastern part of the zonal province, which represents the transition between the subarctic and subtropical regimes (North Pacific Transition Zone Province). Despite the considerable lack of chlorophyll biomass along the equator, it is still possible to determine the location of the equatorial currents and thus, by inference, the locations of the equatorial provinces.
The Atlantic Ocean
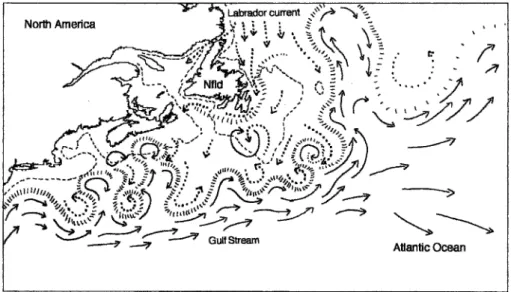
With a power of about 40–45 W, the Gulf Stream feeds a southeasterly current (the Azores Current) directly into the gyral circulation and a northeasterly current (the North Atlantic Current), part of which circulates in the gyre only when it crosses the European continent encounters. The passage of Gulf Stream water over the ridge is often marked by a southerly loop related to the topography.
Atlantic Polar Biome
In the North Atlantic, the bifurcation of the Gulf Stream over the Newfoundland Basin adds complexity to the gyral system, which is reflected in its dynamic biogeography and requires us to recognize divisions within the gyral circulation, although they may not be readily identifiable at the surface . the features. The topography of the Midocean ridge limits the main gyral recirculation in the western basin, so there are important biological differences between the eastern and western parts of the range.
Boreal Polar Province (BPLR)
The strong nitrocline at the halocline of the Arctic Ocean is not mediated by local biology. Retreat of the ice edge can happen quickly (10 km per day in the Bering Sea), and in 3 months the edge moves several hundred kilometers.

Atlantic Arctic Province (ARCT)
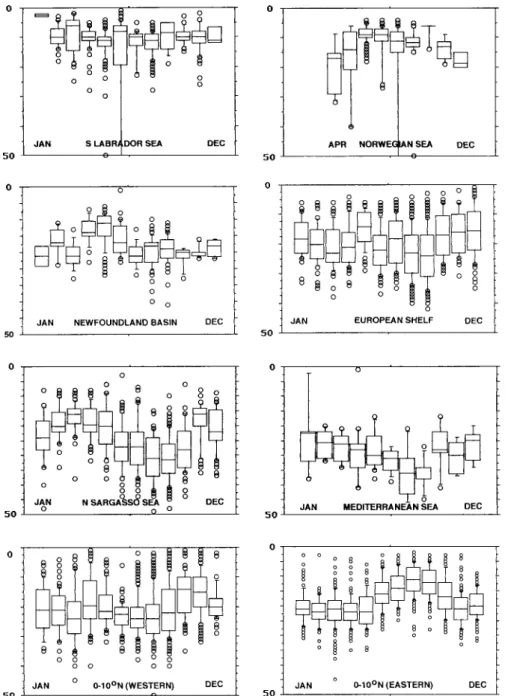
The Levitus data show that near-surface stratification develops first in the northeast quadrant of the Labrador Sea. Similar conditions are now also occurring in the northern part of the Norwegian basin, where the mixed layer can exceed 30 m.

Atlantic Subarctic Province (SARC)
The species of herbivorous plankton in the SARC part of the Barents Sea and their life cycles are similar to those of the Norwegian Sea and at OWS I. They all perform diel migration, but Meganyctiphaness spends much of the year in the benthic habitat and swarms only on the surface. to reproduce.

Atlantic Westerly Winds Biome
North Atlantic Drift Province (NADR)
Only north of the OPF was the chlorophyll maximum within the mixed layer, and maximum values were needed here. New production continues at the deep chlorophyll maximum during the oligotrophic summer period after the end of spring bloom in the mixed layer.
Gulf Stream Province (GFST)
The water contained in a ring is gradually modified to the characteristics of the surrounding water mass. Together with cross-frontal mixing of relatively pigment-rich slope water, this should result in the cold north wall of the Gulf Stream being observed at the surface as a chlorophyll front.
North Atlantic Subtropical Gyral Province (NAST-E, NAST-W)
There are also important morphological and ecological differences between Sargassum in this province and in the NATR south of the STC (Niermann, 1986; Butler et al., 1983, and references therein). This should follow from the generalization that the C/chl ratio decreases with increasing depth of the VKM.
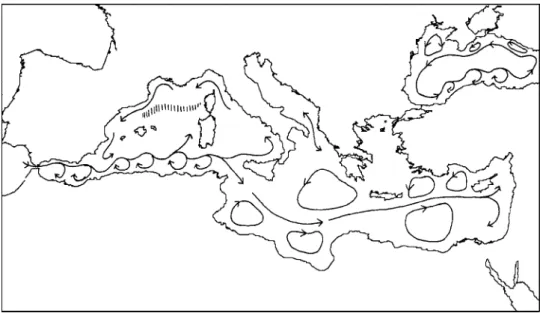
Mediterranean Sea, Black Sea Province (MEDI)
The shores of the Black Sea are steep - only in the southern part of the basin. In the Black Sea, however, due to the less complex coastal topography, it is more uniform there.
Atlantic Trade Wind Biome