He is a member of the American Accounting Association and the Institute of Management Accountants. We integrate the discussion of behavioral considerations in implementing activity-based costing with the technical material in the chapter.
Objective 2
Some representations of the value chain collectively refer to the first two steps as technology development.1. This winning combination of quality products and low prices has made Trader Joe's one of the most popular retailers in the United States.
Objective 4
We illustrate a five-step decision-making process using the example of the Daily News, a newspaper in Boulder, Colorado. The left side of Exhibit 1-5 provides an overview of the decision-making processes at the Daily News.
Objective 6
Classify each cost item (a–h) as one of the business functions of the value chain in Exhibits 1–2 (page 25). Classify each of the actions (a–g) as a step in the five-step decision-making process (identify the problem and uncertainties; obtain information; make predictions about the future; make decisions by choosing between alternatives; implement the decision, evaluate performance, and learn).
Objective 1
For example, the number of vehicles assembled is the cost determining factor for the total cost of steering wheels. Period costs are all costs in the income statement except cost of goods sold.
Total manufacturing costs incurred in 2017. Total manufacturing costs refers to all direct manufacturing costs and manufacturing overhead costs incurred during 2017 for all
Exhibit 2-8 takes the visual representation in Exhibit 2-7 and shows how inventory costs and period expenses would appear on the income statement and cost of goods manufactured schedule of a manufacturing company. We begin by tracing the flow of direct materials shown on the left in Exhibit 2-7 and in Panel B in Exhibit 2-8.
STEP 4
The cost of goods produced refers to the cost of goods brought to completion, regardless of whether they were started before or during the current period.
Cost of goods manufactured in 2017. Cost of goods manufactured refers to the cost of goods brought to completion, whether they were started before or during the current
These period costs include e.g. salaries for salespeople, depreciation on computers and other equipment used in marketing, and expenses for renting storage space for distribution. As the goods are sold, their costs are shown in the income statement as goods consumption. Some companies classify $40 as a direct programming labor cost for the product for which the software is being written and $10 as an overhead cost.
Government contracts often compensate contractors based on the “cost of a product” plus a predetermined profit margin. As Figure 2-11 illustrates, product cost measures range from a narrow set of costs for financial statements—a set that includes only production costs—to a broader set of costs for reimbursement under government contracts, to an even broader set of costs. of the costs for pricing and product mix decisions.
Objective 8
Period costs are expensed in the accounting period in which they occur and are all costs on the income statement except cost of goods sold. For example, for the purpose of external reporting in a manufacturing company, the inventoriable cost of a product includes only production costs. What is the total cost of producing each vehicle if 80 vehicles are produced each month.
To better understand the profitability of the business, the owner has asked you for an analysis of the costs - which costs are fixed, which costs are variable and so on for each event. Indirect manufacturing labor 60 Prepare an income statement and supporting cost of goods schedule for the year ended December 31, 2017.
Objective 1
Coverage contribution per entity recognizes the close link between selling price and variable costs per unit. The income statement in Exhibit 3-1 is called a contribution income statement because it groups costs into variable costs and fixed costs to emphasize contribution margin. Contribution Margin Percentage = Contribution Contribution>Quantity of Units Sold Revenue>Quantity of Units Sold.
The contribution margin percentage is a useful tool for calculating how a change in revenue changes the contribution margin. In the previous sections, we used the number of packages sold as input to the contribution income statement, the method of equations, the contribution method for margins, and the graph method to calculate Emma's operating income for different amounts of packages sold.
Objective 2
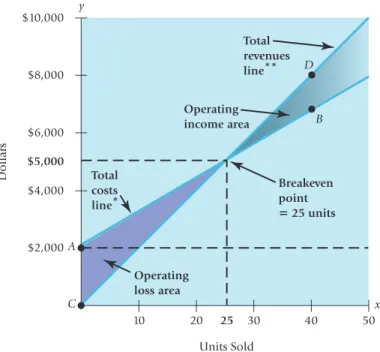
Calculate (a) the break-even point in units and revenue and (b) the number of windows Bernard Windows must install and the revenue needed to achieve the target operating income of $100,000. Can we use the graph method and the graph in Exhibit 3-2 to determine how many units Emma must sell to earn operating income of $1,200. Net income is operating income plus non-operating income (such as interest income) minus non-operating expenses (such as interest expense) minus income taxes.
How can managers determine the break-even point or product needed to achieve a target operating income. Fixed costs increased, but the increase in contribution margin resulted in large increases in operating income.
Objective 5
Using the spreadsheet, Emma can immediately see how many units she needs to sell to achieve certain operating income levels, given alternative levels of fixed costs and variable costs per unit that she faces. Margin of safety = Budgeted (or actual) revenue - Break-even revenue Margin of safety (in units) = Budgeted (or actual) sales quantity - Break-even quantity. The high margin of safety gives Emma confidence that she is unlikely to suffer a loss.
A low margin of safety increases the risk of a loss, which means Emma will have to look for ways to lower the break-even point by reducing fixed costs or increasing contribution margin. Number of units needed to be sold at $200 selling price to earn target operating income from.
Objective 6
Operating leverage describes the effects that fixed costs have on changes in operating income as changes occur in units sold and contribution margin. If fixed costs are $0 as in Option 3, the contribution margin equals operating income and the operating leverage ratio equals 1.00 at all sales levels. Managers and management accountants must manage the level of fixed costs and variable costs to balance the risk-return trade-offs in their firms.
Nike reduces the risk of loss by increasing variable costs and decreasing fixed costs. This means that Emma is selling a package of 3 units of GMAT Success and 2 units of GRE Guarantee.
Objective 7
The sales mix is the quantities (or share) of different products (or services) that make up a company's total unit sales. For Emma, this is the combination of the number of units sold for GMAT Success and the number of units sold for GRE Garantie. For example, if the sales mix changes to 3 units of GMAT Success for every 7 units of GRE Guarantee, the breakeven point increases from 75 units to 100 units, consisting of 30 units of GMAT Success and 70 units of GRE Guarantee.
Breakeven volume increases because the sales mix has shifted to a lower margin product, the GRE Guarantee (which is $30 per unit versus $80 per unit of GMAT Success). This shift to smaller cars increased the breakeven point as the sales mix shifted to lower margin products.
Objective 8
Fixed costs of recruiting, including administrative salaries and expenses of the recruiting department, are $250,000. Calculate the budgeted operating income for each of the following deviations from the original budget data. The managing director at Appolo suggests increasing the average price of the packages by $900 to lower the break-even point in units.
Calculate the effect this will have on the profitability of the exhibition, assuming fixed costs will be the same as last year. This price per unit is the average unit price applicable to each of the identical or similar units produced during that period.
Objective 3
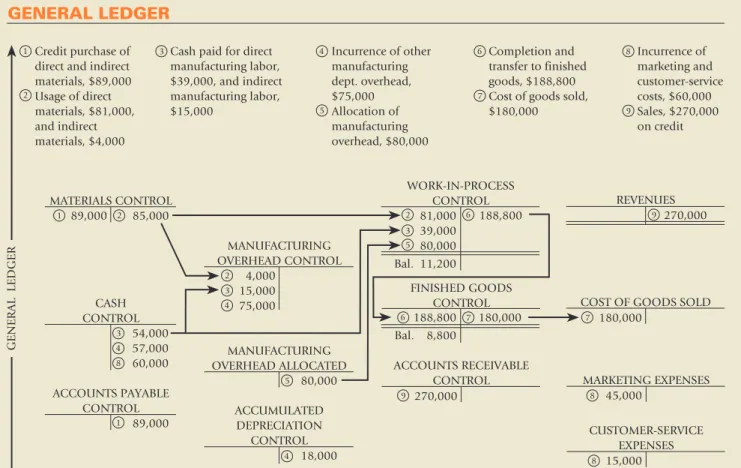
Managers try to approximate actual manufacturing costs and actual direct manufacturing labor hours when calculating budgeted indirect costs. First, the actual production cost rate at the end of the fiscal year is calculated. Under normal costing, the manufacturing cost allocated to the job is $3,520 (the budgeted rate of $40 per direct manufacturing labor@hour * 88 hours).
Based on the total amount of manufacturing overhead allocated in 2017 (before pro rata share) in the ending balances of the Work in Process Control, Finished Goods Control and Cost of Goods Sold accounts. How should managers dispose of under- or over-allocated manufacturing overhead at the end of the accounting year. The company uses a normal costing system and allocates production overhead costs based on direct labor hours in production.
Production costs (manufacturing department) USD 20 per machine hour. Production cost (finishing department) USD 16 per direct labor hours Machine hours (manufacturing department) for May 2,000 machine hours Direct labor hours (finishing department) for May 1,200 labor hours.
Compute the Rate per Unit of Each Cost-Allocation Base
Compute the Total Cost of the Products by Adding All Direct and Indirect Costs Assigned to the Products. Exhibit 5-2 presents the product costs for the simple and complex
Plastim's simple costing system might be overpricing the simple S3 lens (assigning too much cost to it) and underpricing the complex C5 lens (assigning it too little cost). In contrast to the single indirect cost pool in Plastim's simple cost system, each of the activity-related cost pools is homogeneous. Plastim's ABC system uses molding machine hours, a cost allocation base at the output unit level, to allocate machine operating costs to products.
Plastim's ABC system uses set-up hours, a batch-level cost allocation basis, to allocate set-up costs to products. Plastim's ABC system uses square feet, a product-supporting cost allocation basis, to allocate design costs to products.
Select the Activities and Cost-Allocation Bases to Use for Allocating Indirect Costs to the Products. Following guideline 2 (subdivide into homogeneous cost pools) and guideline
Exhibit 5-4, column 2, shows the cost hierarchy category, and column 4 shows the cost allocation base and the estimated amount of the cost allocation base for each activity described in column 1. For example, in their ABC Plastim system, managers measure mold complexity by to the number of parts in the mold and the area of the mold (parts-square feet). In this step, Plastim's managers attempt to assign estimated indirect costs for 2017 to activities (see Ex- step, Plastim's managers attempt to assign estimated indirect costs for 2017 to activities (see Exhibit 5-4, column 3) based on the cause-and-effect relationship between the base for distribution of costs for activity and costs.
Of course, the strength of the cause-and-effect relationship between the cost allocation base and the cost of an activity varies across cost pools. For each activity, Plastim's operational staff indicates the total amount of the cost allocation base that will be used by each type of lens (remember that Plastim operates at capacity).
Compute the Total Cost of the Products by Adding All Direct and Indirect Costs Assigned to the Products. Exhibit 5-5 presents the product costs for the simple and complex
Management accountants use the cost hierarchy to first calculate the total costs of each product. Homogeneous cost pools and the choice of cost allocation bases, linked to the cost hierarchy, give Plastim managers greater confidence in the activity and product cost numbers from the ABC system. They set cost reduction targets for the unit cost of the cost allocation base in various areas of activity.
All store support costs (all costs other than cost of goods sold) are allocated to product lines using each product line's cost of goods sold as the cost allocation basis. Trade support costs for each product line by activity are obtained by multiplying the total cost allocation base amount for each product line by the activity cost rate.
