The study will provide an overview of issues relevant to Sri Lanka's poverty measurement methodology and poverty information system. This study consists of three main parts: (1) an overview of conceptual approaches to poverty measurement, (2) an overview of international best practice in poverty measurement, and (3) an overview of the data requirements (and typical sources) for poverty measurement. .
GOOD PRACTICE IN POVERTY MEASUREMENT 27 1 Monetary approaches to poverty measurement 28
DATA REQUIREMENTS FOR POVERTY
The uses of poverty measurement
A slightly different categorization of the purposes of measurement is often cited in the literature (Kanbur and Squire 2001, Asra and Santos-Francisco 1998). For the poor themselves, so that they can better understand their situation and act more effectively on their own behalf?” This paper is based on the belief that the main purpose of poverty measurement is to reduce or eradicate poverty (and poverty measurement is for the poor in that sense), and.
Approaches to defining and measuring poverty
- Monetary approach
- Capabilities approach
- Social exclusion approach
- Participatory approach
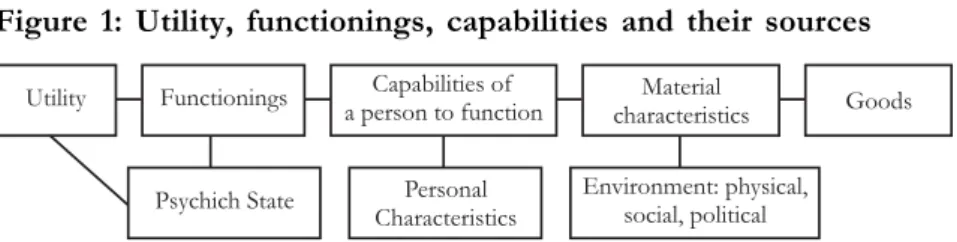
While the basic concepts discussed in Chapter 1 are relevant to all purposes and types of "poverty measurement," the differences in these purposes become more apparent as we move from concepts to measurement (Chapter 2) and finally to identifying the requirements of data. (Chapter 3). The capabilities approach was first introduced by Amartya Sen in the essay "Equality of What?" delivered as the Tanner Lecture on Human Values in 1979.15 He defines poverty as being unable to do certain things; lack of ability to function or lack of “essential freedoms that [a person] enjoys to lead the kind of life that he or she values” (Sen 1999).
Issues in defining poverty
- Poverty in what space?
- Poverty is multidimensional
- Absolute vs. relative
- Subjective or objective?
- Poverty and inequality
- Direct and indirect definitions of poverty
- The dynamics of poverty
- Poverty and vulnerability
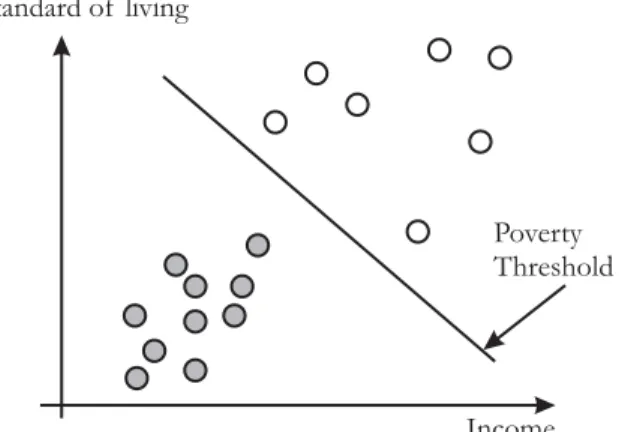
A distinction often made in the literature is that between direct and indirect measures of poverty (Sen 1981). 30 This focus only on those below the poverty line is known as the "focus axiom" of poverty.
Summary
Any exercise involving the measurement of poverty must address the problems of: (1) Identification (Who are the poor?), and (2) Aggregation (How can the phenomenon of poverty be described or summarized in a scalar index?) . In sections 2.2 and 2.3 I focus on two main aspects of poverty measurement that have either apparently, or in fact, been ignored in the objective-quantitative approach.
Monetary approaches to poverty measurement
- Choice of indicator
- Choice of unit of analysis
- Choice of poverty line
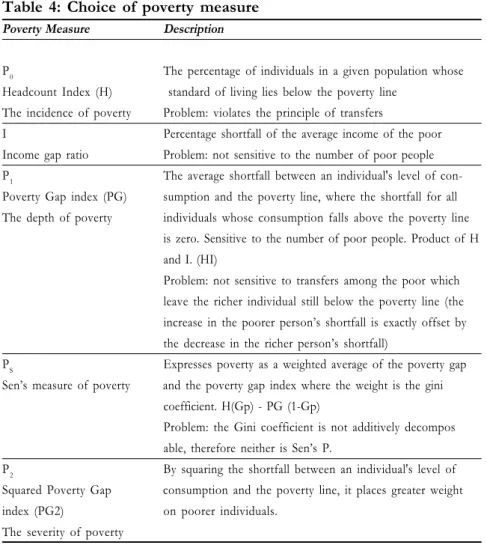
- Choice of poverty measure
- Uses and limitations of monetary measures
An example of its use is the Ministry of Labor's calculation of the poverty line for Uzbekistan (World Bank 1994, cited in Olson Lanjouw 1997). Sen (1976) attempted to remedy this by constructing a poverty measure (S) that explicitly included inequality below the poverty line.
Incorporating multidimensionality in poverty measurement .1 Introduction
- Choice of dimensions and indicators
- Choice of thresholds
- Choice of weights, or how to aggregate?
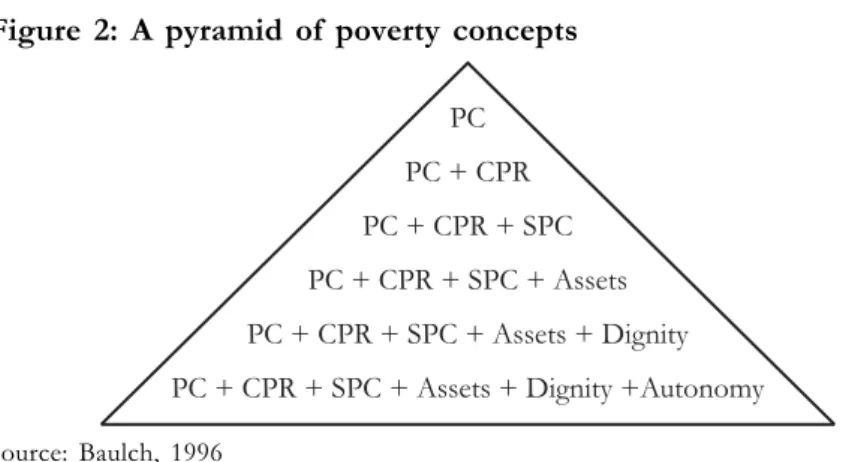
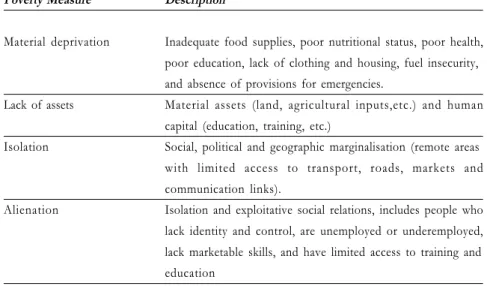
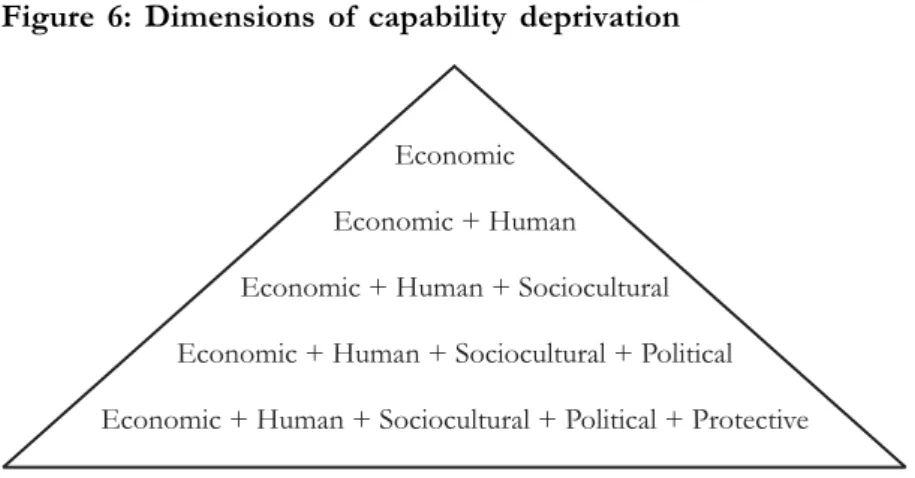
Figure 6 below provides an alternative representation of the multiple dimensions of poverty, defined in terms of asset deprivation (see section 2.6). However, the discussion of the problem of choosing thresholds in the dimensions is rare (compared to that in the monetary approach). 74 The application of the subjective approach to measuring social exclusion in Great Britain is an example of this.
The whole problem in this approach lies in the formalization of the membership function (Fusco 2003).
Measuring the dynamics of poverty
- Measuring chronic poverty using panel data
- Measuring chronic poverty without panel data
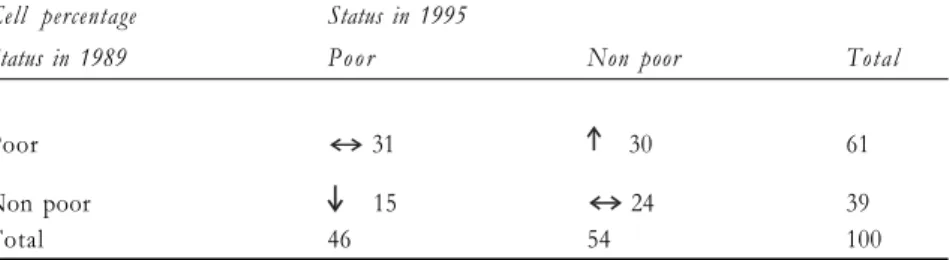
In the table below, the last row and last column show the total percentages of poor and non-poor in the relevant years. Duncan et al. 1993) found that periods of poverty in the Netherlands were associated with labor market events (job loss, shorter working hours) and family formation (divorce or separation). In the example in Table 12, households that are always below the poverty line are classified as persistently poor, while households that always remain above it are classified as never poor.
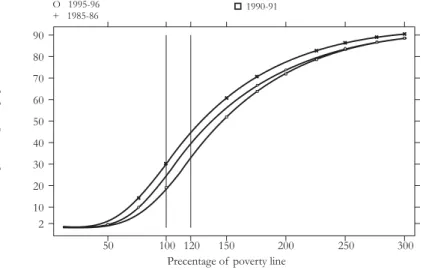
The precision with which the poverty line is estimated is important in measuring poverty, especially when the spelled approach is used.
Measuring vulnerability
Indicators that are observed at one point in time but provide information on long-term processes are useful measures or proxies of chronic poverty. It does not distinguish between (1) upward and downward fluctuations, whereas it is mainly the latter that affect the poor (2) fluctuations that are aggregated (worse for the poor) versus fluctuations that are distributed over time and (3) fluctuations, that vary in severity versus fluctuations that are moderate and equal (See Box 1.3 in World Bank 2001). World Bank 2001) and Moser (1998) identify the following indicators as useful in assessing a household's risk exposure: (1) physical assets (housing, equipment and land) (2) human capital (health and education) (3) labor and ( 4) stocks (food, money or valuables) are a measure for households.
Another approach to measuring vulnerability is to measure the occurrence of risks or shocks (usually total risks such as crime, natural disasters).89.
Measuring voicelessness and powerlessness
Capability approaches to poverty measurement
- Choice of indicator
- Choice of unit of analysis
- Choice of poverty line
- Choice of poverty measure
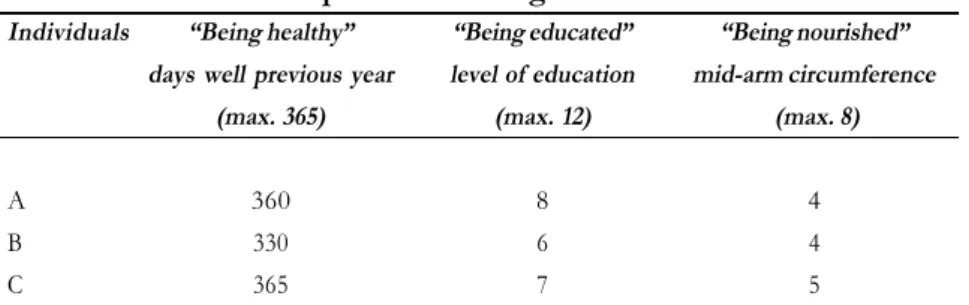
Within the capability approach, the identification problem is addressed in the literature, especially in terms of the choice of indicator. In the first application of fuzzy set theory to the measurement of poverty, Cerioli and Zani (1990) presented a method for calculating a multidimensional deprivation ratio and functioning indices for dichotomous variables (which are traditional sets; not owning a good implies a deprivation of the good, possession implies an achievement in the relevant functioning), categorical variables and continuous variables. An individual can be considered better than another if the value of one of the functions in the functioning vector is higher than that of the other, provided that the value of none of the remaining functions is lower (similar to the Pareto criteria ).
Thus, the principle of equal weighting is implicit in the rule (no weight is given to distance or depth of deprivation).
Social exclusion approaches to poverty measurement
- Choice of indicator(s)
- Choice of unit of analysis
- Choice of poverty line
- Choice of poverty measure
- The contribution of the social exclusion approach
Some of the defining characteristics of social exclusion that determine how these choices are made are: (1) the multidimensionality of the concept, which includes political, cultural and social as well as material aspects of exclusion,105 (2) relativity (3) focus on dynamics and (4) ) social interaction (Bossert et al. 2003). In this work, I examine the implications of these characteristics for the measurement of social exclusion. Social exclusion is defined as non-participation in the labor market and long-term unemployment.
This method has great potential for identifying what societies themselves consider aspects of social exclusion.
Participatory approaches to poverty measurement Participatory appraisals
- Choice of indicator
- Choice of unit of analysis
- Choice of poverty line
- Choice of poverty measure
114 The results of the ranking of different groups are brought together and the piles are scored. The final score of each household is the average of the scores it received from three reference groups. The advantage of the participatory approach is that it can be used to identify location-specific poverty indicators and indicators of deprivation.
On the one hand, the identification of the poorest takes place at the micro level (village level) and does not provide a means of consistent comparison.
Other approaches to poverty measurement .1 Poverty monitoring
- Poverty maps 117
- Subjective measures of poverty
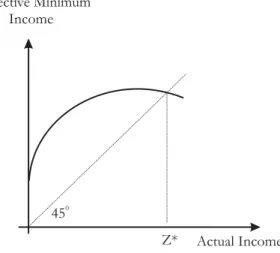
However, the subjective approach to poverty, which is described in this section, has a monetary dimension, where subjective estimates of the poverty line are derived from respondents, as well as a non-monetary dimension where measures of "deprivation" are based. directly to the issues that respondents consider important in determining well-being. A segment of the developed countries' literature on poverty can be called the subjective or consensus approach to poverty measurement. 119. Adequate means no more and no less than what the respondent considers to be the minimum consumption needs of the family.
Regarding your family's food consumption over the past one month, which of the following is true.
Summary
It is now clear that any single indicator of poverty will not adequately describe or measure the complex phenomenon that it is. The multidimensionality of poverty is now firmly acknowledged and we are much closer to measuring it than we were a decade ago. We are also much better at measuring the dynamics of poverty than we were a few years ago.
The availability of panel data has led to methodological improvement in distinguishing between the short-term and permanent poor and tracking movements into and out of poverty.
Introduction
Sources of data
- Censuses and surveys Censuses
- Qualitative data
- Administrative data
- Combining survey and census data
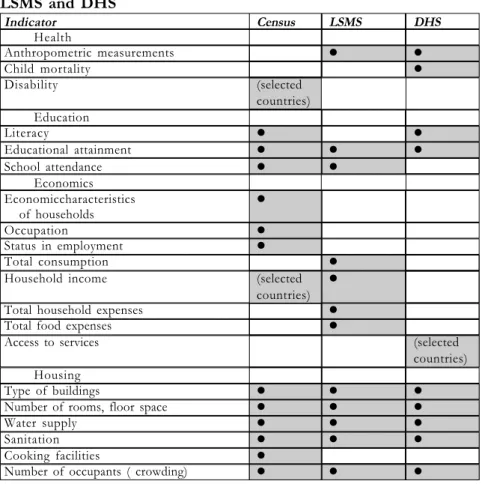
A population census usually contains descriptive statistics of the housing stock, access to basic services such as water, electricity and sanitation, information on education and employment patterns, and population statistics. Depending on the scope of the survey, these surveys are also useful for poverty analysis, although they are usually not as useful as multi-topic surveys such as the LSMS. A criticism of household survey data is that expenditure is often collected at the household level rather than at the individual level.
The agricultural census provides basic information on the organization and structure of the sector and the use of agricultural resources.
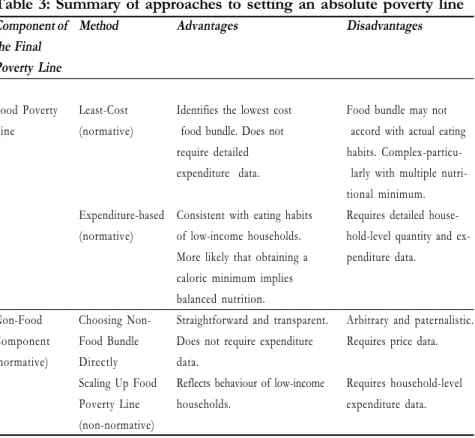
Specific data issues
- Collecting panel data: is it worth it?
- Non-compatible data
Collecting panel data is difficult and expensive, which makes many developing countries reluctant to undertake such a project. Some scholars deplore the lack of panel data (Baulch 1996b, Appleton 1996), especially to be able to quantify and analyze chronic poverty. While there are methodologies that can be used in place of panel data, these are usually second best or worst.
The National Urban Employment Survey (NUES), conducted by Mexico's National Institute of Statistics, Geography and Information, conducts extensive quarterly surveys and is structured to generate panels that allow one-fifth of the sample to be followed over five quarters.
Poverty information/monitoring systems
- Assessing sources for a poverty monitoring system
- Maintaining international comparability
- Rationalizing data collection nationally
- Features of a poverty information strategy
The implication is very clear that much can be done in many countries through poverty measurement and analysis. For example, the goal of a poverty mapping initiative is to produce subnational maps of poverty indicators that demonstrate a high degree of comparability from one country to another. For example, to exploit the synergy effects that can be achieved by combining the full coverage of a census with the rich information of a survey.
A sequential information strategy is intended as a management tool for governments and central statistical agencies to provide an enabling framework to meet the information needs of poverty reduction strategies and economic development plans.
Summary
Finally, analysis of the dynamics of poverty led to the demand for (5) longitudinal data. Destitution in India”, Paper presented at the WIDER Conference on Inequality, Poverty and Human Well-Being, Helsinki, 30-31 May. Available online at http://www.undp.org/poverty/publications/pov_red/review_of _poverty_concepts.pdf.
Hong Kong” in John Dixon and David Macarov (eds.) Poverty: A Persistent Global Reality, London: Routledge.