Many of the designations used by manufacturers and sellers to distinguish their products are claimed as trademarks. Where these designations appear in this book, and Pearson was aware of a trademark claim, the designations are initialized or capitalized.
General Approach and Mathematical Level
Summary of the Changes in the Ninth Edition
Content and Course Planning
Emphasis is on the use of models and information about statistical models that can be obtained from graphical tools. Examples, case studies, and a large number of exercises teach the student how to use these distributions.
Computer Software
Comparisons of treatments within blocks are highlighted along with the topic of randomized complete blocks. Two new and special features are the presentations of response surface methodology (RSM) and robust parameter design.
Supplements
StatCrunch is web-based statistical software that allows users to perform complex analyses, share datasets, and generate compelling reports from their data. An online survey tool that allows users to quickly build and administer surveys via a web form.
Acknowledgments
Overview: Statistical Inference, Samples, Populations, and the Role of Probabilityand the Role of Probability
Much has been said and written about Japan's “industrial miracle,” which began in the mid-twentieth century. Much of the success of the Japanese is attributed to the use of statistical methods and statistical thinking among the management staff.
Use of Scientific Data
The second is the variation between the observed values and the actual amount of sulfur monoxide in the air at that moment. It is the natural variation from study to study that must be taken into account in the decision-making process.
Variability in Scientific Data
We often focus only on certain properties or characteristics of the objects or objects in the population. In the former, the quality of the conclusions will depend on proper planning of the experiment.
The Role of Probability
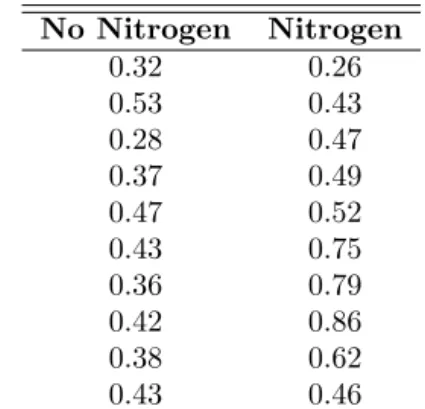
Note that the general appearance of the data may suggest to the reader that the use of nitrogen increases stem weight on average. Most of the no-nitrogen observations appear to be below the center of the data.
How Do Probability and Statistical Inference Work Together?
Sampling Procedures; Collection of Data
While sampling appears to be a simple concept, the complexity of the questions to be answered about the population or populations necessitates that the sampling process is at times very complex. While the concept of sampling is discussed in a technical way in Chapter 8, here we will endeavor to provide some sensible concepts of sampling.
Simple Random Sampling
Within the nitrogen group (or non-nitrogen group) there is considerable variation in stem weights. In corrosion fatigue research, the experimental units are the samples that are the subject of corrosion.
Why Assign Experimental Units Randomly?
Measures of Location: The Sample Mean and Median
In the case of the two-sample data set of Example 1.2, the two measures of central tendency for the individual samples are Note, however, that in the case of the stem weight data, the sample mean value for no nitrogen is quite similar to the mean value.
Other Measures of Locations
Measures of Variability
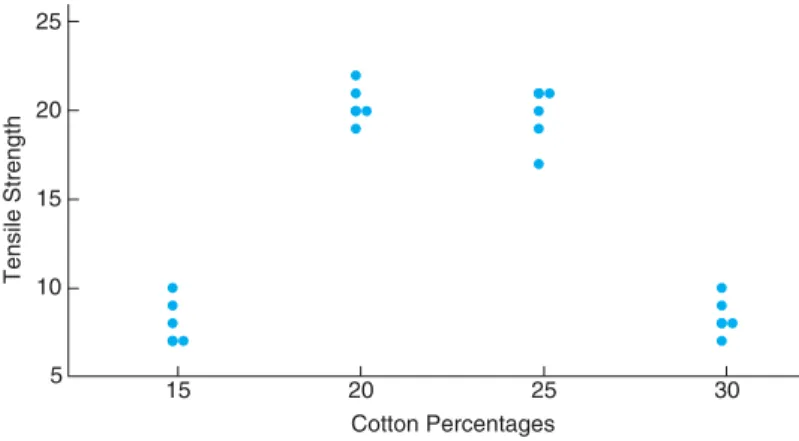
Measures of location in a sample do not provide a proper summary of the nature of a data set. If the purpose of such an experiment is to detect differences between the two populations, the task is performed in the case of data set B.
Sample Range and Sample Standard Deviation
Units for Standard Deviation and Variance
Which Variability Measure Is More Important?
Discrete and Continuous Data
Calculate the sample variance and sample standard deviation for both control and treatment groups. 18 Chapter 1 Introduction to Statistics and Data Analysis the drug was successful and is the sample proportion in which the drug was not successful.
What Kinds of Problems Are Solved in Binary Data Situations?
Statistical Modeling, Scientific Inspection, and Graphical DiagnosticsDiagnostics
But sets of data are often used to learn about certain characteristics of the population. In this section, the role of sampling and the display of data for improving statistical inferences is examined in detail.
Scatter Plot
Two points become clear from the two data illustrations here: (1) The type of model used to describe the data often depends on the purpose of the experiment;. Often, plots can illustrate information that allows the results of the formal statistical inference to be better communicated to the scientist or engineer.
Stem-and-Leaf Plot
Leaves with multiple digits belonging to the same stem are usually separated by commas in the stem-and-leaf plot. Another way is through the use of the frequency distribution, where the data, grouped into different classes or intervals, can be constructed by counting the leaves associated with each stem and noting that each stem defines a class interval.
Histogram
Decimal points in data are usually ignored when all digits to the right of the decimal point represent a leaf. In Figure 1.8(b) we see that the distribution is symmetric, while in Figure 1.8(c) it is skewed to the left.
Other Distinguishing Features of a Sample
General Types of Statistical Studies: Designed
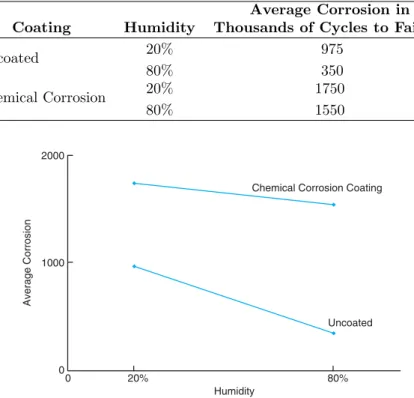
Statistical methods are used that use measurements of the central tendency in the corrosion measurement, as well as measurements of the variability. Is there an interaction between coating type and relative humidity that influences its impact on alloy corrosion?
What Is Interaction?
The information provided in Example 1.3 nicely illustrates the types of engineering questions that have been asked and answered by the use of statistical methods used in the planned experiment presented in this text. me). Suppose that in this example 24 samples of silicone rubber are selected and 12 are assigned to each of the curing temperature stages.
What If Factors Are Not Controlled?
Sample Space
The example given in section 1.7, where cholesterol and sodium in the blood were observed in a group of individuals, represented an observational study (as opposed to a designed experiment), and yet the process generated data and the outcome is subject to uncertainty . Even though the data has been in the files for decades, the process is still called an experiment.
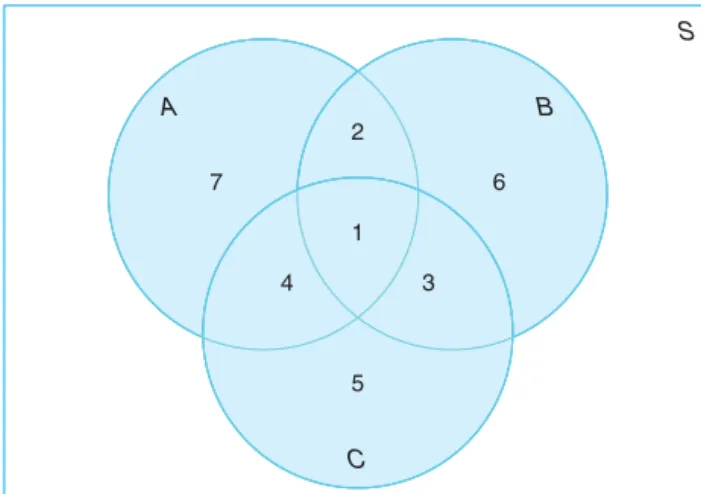
The set of all possible outcomes of a statistical experiment is called the sample space and is represented by the symbol S
- Events
- Counting Sample Points
- Probability of an Event
- Additive Rules
- Conditional Probability, Independence, and the Product RuleRule
The probability that at least one occurs is the sum of the probabilities of the individual events occurring. What is the probability that the life of the component is less than or equal to 6000 hours.

Conditional Probability
The probability that the plane departed on time, given that it arrived on time, is. In Example 2.34, it is important to know the probability that the flight arrives on time.
Independent Events
The Product Rule, or the Multiplicative Rule
Bayes’ Rule
Total Probability
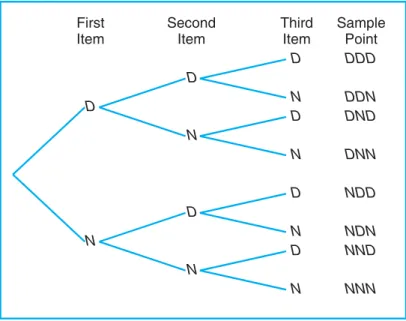
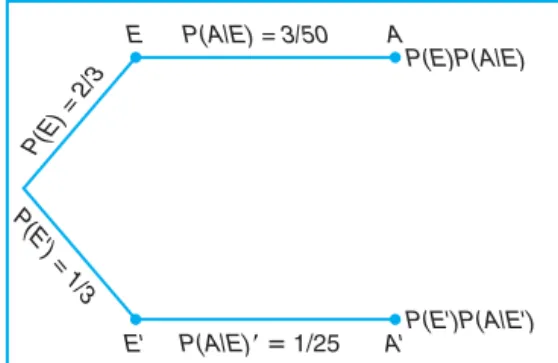
From past experience it is known that 2%, 3% and 2% of the products produced by each machine are defective respectively. Referring to the tree diagram of Figure 2.15, we find that the three branches give the probabilities.
Bayes’ Rule
Potential Misconceptions and Hazards;
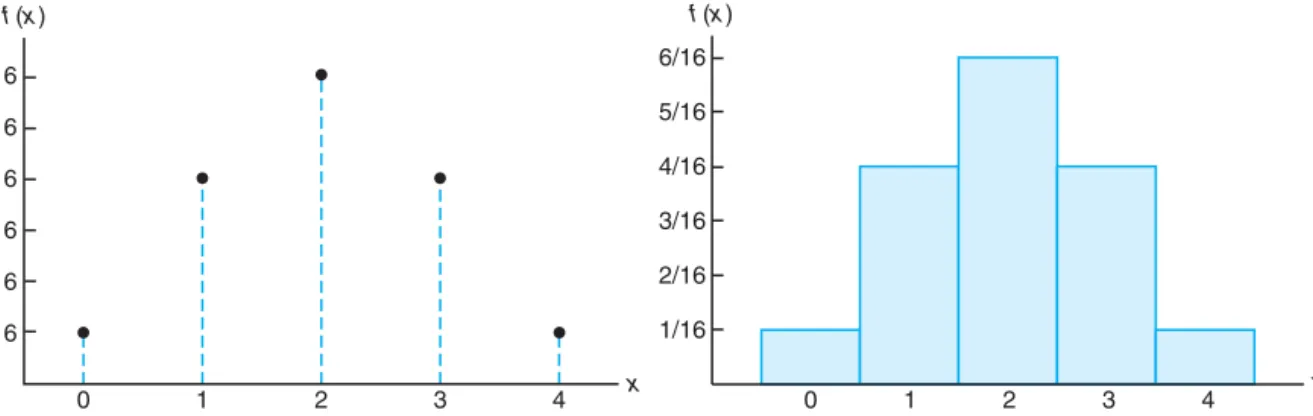
The probability distribution shows, in equation form or graphically, the total information needed to describe a probability structure. Thus, the probability distribution will reveal the probability structure for the number of defective items from the number selected from the process.
Concept of a Random Variable
The possible outcomes and the values of the random variable Y, where Y is the number of red balls, are. In that regard, let X be a random variable defined by the number of items observed before a defect is found.
Discrete Probability Distributions
84 Chapter 3 Random Variables and Probability Distributions on a continuous scale, it is called a continuous random variable. Note that the random variables Y and M in Examples 3.1 and 3.2 both represent count data, Y the number of red balls and M the number of correct hat matches.
- Continuous Probability Distributions
- Joint Probability Distributions
To determine the probability that the winning bid is less than the preliminary bid estimateb, we have. If x is the number of defective sets purchased by the hotel, find the probability distribution of X. Express the results graphically as a probability histogram.
Statistical Independence
The continuous random variables of Example 3.20 are statistically independent, since the product of the two marginal distributions gives the joint density function. Checking for statistical independence of discrete random variables requires more thorough investigation, since it is possible that the product of the marginal distributions equals the joint probability distribution for some but not all combinations of (x, y).
What Are Important Characteristics of Probability Distributions and Where Do They Come From?
Project: Take 5 class periods to observe the shoe color of individuals in class. Assume the shoe
Potential Misconceptions and Hazards;
Complete a frequency table for each color category. a) Estimate and interpret the meaning of the probability distribution. The general nature of the probability distribution for a specific scientific phenomenon is not clear from what is learned in this chapter.
Mean of a Random Variable
The expected lifespan of a device is an important parameter for its evaluation. Find the average number of hours before the component and therefore the DVD player fails.
Variance and Covariance of Random Variables
We will now extend our concept of the variance of a random variable X to include random variables related to X. Find the mean and variance of the random variable X by plotting the number of power outages that hit this subdivision.
Means and Variances of Linear Combinations of Random VariablesRandom Variables
Two additional properties that will be very useful in subsequent chapters involve the expected values of the sum, difference, and product of these two random variables. However, let us first prove a theorem about the expected value of the sum or difference of functions of the given variables.
What If the Function Is Nonlinear?
- Chebyshev’s Theorem
- Potential Misconceptions and Hazards;
- Introduction and Motivation
- Binomial and Multinomial Distributions
In Section 4.2 we said that the variance of a random variable tells us something about the variability of the observations about the mean. If the probability distribution of the random variable X is the number of cartons sold from this lot.
The Bernoulli Process
144 Chapter 5 Some Discrete Probability Distributions testing items as they come off the assembly line, where each trial may indicate a defective or non-defective item. This means that the probability of picking a heart on the first draw is 1/4, and on the second draw the conditional probability is 13/51 or 12/51, depending on whether a heart appeared on the first draw. : so this would no longer be considered a set of Bernoulli trials.
Binomial Distribution
Then the probability distribution of the binomial random variable X is the number of successes in nine dependent trials. Note that when n= 3 andp= 1/4, the probability distribution of X, the number of defectives, can be written as
Where Does the Name Binomial Come From?
That is, we want to find a formula that gives the probability of x successes in n trials for a binomial experiment. What is the probability that among the 20 selected and tested from the shipment, there will be exactly 3 shipments, each of which will contain at least one defective device.
Areas of Application
It is too expensive to test all the wells in the area, so 10 are randomly selected for testing. Example 5.5: Find the mean and variance of the binomial random variable of Example 5.2, and then use Chebyshev's theorem (on page 137) to interpret the interval μ±2σ.
Multinomial Experiments and the Multinomial Distribution
Hypergeometric Distribution
In general, we are interested in the probability of selecting x successes from the k items labeled successes and n−x failures from the N −k items labeled failures when a random sample of size is selected from N items. Accordingly, the probability distribution of the hypergeometric variable is called the hypergeometric distribution, and its values are denoted by h(x;N, n, k), because they depend on the number of successes k in the set N from which we select items. .
Hypergeometric Distribution in Acceptance Sampling
Therefore, the probability of choosing 5 cards without replacement, 3 of which are red and 2 of which are black is given by . The probability distribution of the hypergeometric random variable X, the number of successes in a random sample of size chosen from among N elements, of which is labeled success and N labeled failure, is.
Relationship to the Binomial Distribution
Negative Binomial and Geometric Distributions
A drug will be considered successful if it effectively brings some degree of relief to the patient. The total number of possible orders is equal to the number of splits of the first six trials into two groups, with 2 failures assigned to one group and 4 successes assigned to the other group.
What Is the Negative Binomial Random Variable?
We might be interested in the probability that the first head occurs on the fourth toss. What is the probability that the fifth item examined is the first defective item found.
Applications of Negative Binomial and Geometric Distributions
Poisson Distribution and the Poisson Process
Properties of the Poisson Process
The probability distribution of the Poisson random variable In addition, certain important continuous distributions used in reliability theory and queuing theory depend on the Poisson process.
Nature of the Poisson Probability Function
Approximation of Binomial Distribution by a Poisson Distribution
- Potential Misconceptions and Hazards;
- Continuous Uniform Distribution
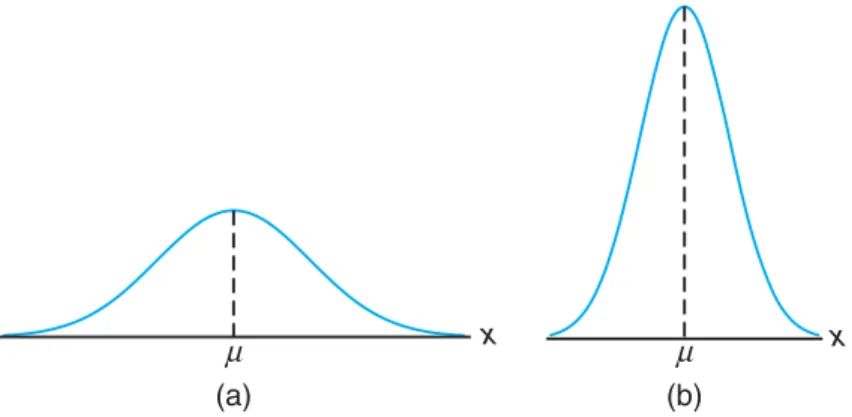
- Normal Distribution
- Areas under the Normal Curve
What is the probability that a satisfactory device will be considered unsatisfactory based on the test. What is the probability that the missile will be detected by only one screen?
![Figure 6.1: The density function for a random variable on the interval [1, 3].](https://thumb-ap.123doks.com/thumbv2/123dok/11244610.0/193.779.281.634.105.309/figure-6-1-density-function-random-variable-interval.webp)