Business Case Models for Fixed Broadband Wireless
Access based on WiMAX Technology and the 802.16
Standard
October 10, 2004
The Business Case for Fixed Broadband Wireless Access based on WiMAX Technology and the IEEE 802.16 Standard
Introduction
The term WiMAX1 (Worldwide Interoperability for Microwave Access) has become synonymous with the IEEE 802.16 Wireless Metropolitan Area Network (MAN) air interface standard. In its original release the 802.16 standard addressed applications in licensed bands in the 10 to 66 GHz frequency range. Subsequent amendments have extended the 802.16 air interface standard to cover non-line of sight (NLOS) applications in licensed and unlicensed bands in the sub 11 GHz frequency range. Filling the gap between Wireless LANs and wide area networks, WiMAX-compliant systems will provide a cost-effective fixed wireless alternative to conventional wire-line DSL and cable in areas where those technologies are readily available. And more importantly the WiMAX technology can provide a cost-effective broadband access solution in areas beyond the reach of DSL and cable. The ongoing evolution of IEEE 802.16 will expand the standard to address mobile applications thus enabling broadband access directly to WiMAX-enabled portable devices ranging from smartphones and PDAs to notebook and laptop computers. This paper will provide a detailed business case analysis for the WiMAX technology in fixed wireless applications in the sub 11 GHz frequency range.
Mobile applications based on IEEE 802.16e will be addressed in a future paper.
For fixed wireless applications, two demographic scenarios and two market models are analyzed, one market model in which the operator only elects to offer services to residential customers and the second in which both residential and small to medium business customers are addressed. Many of the business case assumptions used in the analysis are typical of parameters an operator would experience in most developed countries where wireless access provides a competitive alternative to DSL, Cable and/or aggressively-priced leased lines.
WiMAX Architecture and Applications
A wireless MAN based on the WiMAX air interface standard is configured in much the same way as a traditional cellular network with strategically located base stations using a point-to-multipoint architecture to deliver services over a radius up to several kilometers depending on frequency, transmit power and receiver sensitivity. In areas with high population densities the range will generally be capacity limited rather than range limited
1 The WiMAX Forum is an organization with more than 150 member companies with the goals of promoting worldwide adoption of the IEEE 802.16 air interface standard and to develop a suite of conformance tests to ensure equipment interoperability.
due to limitation in the amount of available spectrum. The base stations are typically backhauled to the core network by means of fiber or point-to-point microwave links to available fiber nodes or via leased lines from an incumbent wire-line operator. The range and NLOS capability makes the technology equally attractive and cost-effective in a wide variety of environments. The technology was envisioned from the beginning as a means to provide wireless “last mile” broadband access in the Metropolitan Area Network (MAN) with performance and services comparable to or better than traditional DSL, Cable or T1/E1 leased line services. The market segments that will be addressed in conjunction with the business case analysis are:
1. Residential and SOHO High Speed Internet Access. Today this market
segment is primarily dependent on the availability of DSL or cable. In some areas the available services may not meet customer expectations for performance or reliability and/or are too expensive. In many rural areas residential customers are limited to low speed dial-up services. In developing countries there are many regions with no available means for internet access. The analysis will show that the WiMAX technology will enable an operator to economically address this market segment and have a winning business case under a variety of demographic conditions.
2. Small and Medium Business. This market segment is very often underserved in areas other than the highly competitive urban environments. The WiMAX
technology can cost-effectively meet the requirements of small and medium size businesses in low density environments and can also provide a cost-effective alternative in urban areas competing with DSL and leased line services.
3. WiFi Hot Spot Backhaul: WiFi hot spots are being installed worldwide at a rapid pace. One of the obstacles for continued hot spot growth however, is the availability of high capacity, cost-effective backhaul solutions. This application can also be addressed with the WiMAX technology. And with nomadic
capability, WiMAX can also fill in the coverage gaps between WiFi hot spot coverage areas.
The WiMAX architecture and applications are illustrated in figure 1.
Figure 1: The WiMAX Wireless Architecture
The following applications are not included in the business case analysis; nevertheless they are worthy of mention in that they represent additional potential revenue sources for the wireless operator.
1. Cellular Backhaul: In the US the majority of backhaul is done by leasing T1 services from incumbent wire-line operators. With the WiMAX technology cellular operators will have the opportunity to lessen their independence on backhaul facilities leased from their competitors. Outside the US, the use of point- to-point microwave is more prevalent for mobile backhaul, but WiMAX can still play a role in enabling mobile operators to cost-effectively increase backhaul capacity using WiMAX as an overlay network. This overlay approach will enable mobile operators to add the capacity required to support the wide range of new mobile services they plan to offer without the risk of disrupting existing services.
In many cases this application will be best addressed through the use of 802.16 based point-to-point links sharing the PMP infrastructure.
2. Public Safety Services and Private Networks: Support for nomadic services and the ability to provide ubiquitous coverage in a metropolitan area provides a tool for law enforcement, fire protection and other public safety organizations enabling them to maintain critical communications under a variety of adverse conditions. Private networks for industrial complexes, universities and other campus type environments also represent a potential business opportunity for WiMAX.
Business Case Considerations and Assumptions
An accurate business case analysis must take into account a wide variety of variables.
These will be described in this section along with the assumptions used in the business case analysis.
Demographics
Demographics play a key role in determining the business viability of any
telecommunications network. Traditionally, demographic regions are divided into urban, suburban and rural areas. In our analysis a fourth area has been added called exurban.
Exurban areas are primarily residential and compared to suburban areas are further from the urban center with lower household densities. DSL availability is limited due to the distance between the end-user and the switching center and cable in many cases is simply too expensive.
Rural areas for the purpose of the business case analysis are defined as small cities or towns that are located far from a metropolitan area. Customer densities can be fairly high in these areas but they tend to be underserved due to their remote location. The following table summarizes the characteristics that will generally be encountered in each of the four geographical areas under consideration for a new wireless service provider.
Area Characteristics
Urban • Highest density of potential WiMAX customers
• Many multiple tenant office and residential buildings
• Smaller WiMAX cell sizes to meet capacity requirements
• Strong competition: Drive by market size and availability of alternate access technologies
Due to the competitive environment a new operator can expect:
• Lower market penetration
• Higher marketing and sales expense Other considerations:
• Licensed spectrum would be desirable to minimize potential for interference
Area Characteristics
Suburban • Moderate density of potential WiMAX customers
• Higher percentage of single family residences also...
• Business parks, strip malls, etc
• Cable and/or DSL may not be available universally
• Increase in WiMAX cell radius but still capacity limited with limited spectrum assignments
New operator can expect:
• Somewhat higher market penetration compared to urban Exurban • Upscale residential neighborhoods with moderate to low
household density
• Fewer business establishments
• High concentration of computers, cell phones, etc.
• Cable and/or DSL not universally available
• Larger WiMAX cell sizes, more likely terrain & range limited
• Requirements of architectural boards, environmental impact studies, etc. may add to BS site development costs
• High percentage of commuters to suburban & urban areas
• Expect higher market penetration for fixed BB internet access Rural
(small, relatively isolated small cities and towns)
• Distant from major Metro Areas
• Residential and small business
• Very little if any, cable or DSL (rely on dial-up or satellite)
• High pent-up demand for internet access
• Limited competition New operator can expect:
• Very high WiMAX market penetration and rapid adoption rate Other considerations:
• High capacity backhaul may be a challenge
Table 1: Demographic Characteristics
Services
Following is a description of the services used in the business case with the assumed first year ARPUs. These ARPUs are competitive with or below current cable, DSL, and leased line services in most developed countries. For the business case analysis the ARPUs are assumed to drop 5% per year after the first year. Wire-line operators generally offer several types of services for SME but for the sake of simplicity only two service levels have been assumed for this analysis.
In addition to high speed internet access, it is assumed the operator will also offer voice services to residential and SME customers. Other revenue sources include one-time activation fees and equipment rental fees for operator-supplied customer premise equipment. These fees are assumed to stay constant over the business case period.
Regulator imposed taxes and tariffs are not included in the analysis since these costs are generally passed through to the end-customer and will therefore, have little or no impact on the business case.
End Customer Service Description
1st Year Monthly
ARPU
Other Revenue
Residential
Residential Internet A “best effort”
service (assume 384kbps with 20:1 over-subscription)
$30 $10/month for
equipment lease and one-time $50 service activation fee
Residential POTS VOIP Service $20 Option Small Medium Business
Basic Service 0.5 Mbps CIR, 1 Mbps PIR
$350 Premium Service 1.0 Mbps CIR, 5
Mbps PIR
$450
$35/month
equipment lease fee and one-time $500 service activation
Local Access (POTS) T1/E1 $200 Option
WiFi Hot Spot Backhaul 1.5 Mbps CIR, 10+Mbps PIR
$650 $25/month equipment lease fee and one-time $500 activation fee Table 2: Services and ARPU
Market Adoption Rate
It generally takes a period of time for consumers to “buy-in” to a new technology, a new service or a new provider of that service. For some consumers the technology, service and/or provider have to be well-tested before they will sign up for the service. Mobile phones and more recently, WiFi (IEEE 802.11) has helped establish a general acceptance of wireless access so it is reasonable to expect that WiMAX technology will have a fairly rapid adoption rate. The rates charged for services by the operator will also have a
marked effect on how quickly the technology and services will be adopted and regions that are currently underserved will have a quicker adoption rate than areas that are currently well served. Figure 2 shows the market adoption rate2 to reach 90% of the expected mature market penetration for a 3, 4 and 5 year adoption curve respectively. In the business case scenarios that follow we will assume a 4 year adoption rate for a metro area deployment, where competition is likely to be the strongest and a 3 year adoption rate in rural areas where there is likely to be high pent-up demand due to the lack of suitable broadband access alternatives.
Figure 2: Market Adoption Rate Used for Business Case Analysis
2 The adoption rate curve roughly follows the shape defined by the Rogers Innovation Adoption Curve. For more information see www.valuebasedmanagement.net
0%
10%
20%
30%
40%
50%
60%
70%
80%
90%
100%
0 1 2 3 4 5 6
Years
% of Mature Market Penetration
5 Yr Adoption Curve Areas with very strong competition
with pricing and services
4 Yr Adoption Curve Areas with moderate
competition
3 Yr Adoption Curve Underserved areas
with high pent-up demand and few
broadband alternatives
Frequency Band Alternatives
A key decision with regard to spectrum choice is whether to use licensed or unlicensed spectrum. The use of licensed spectrum has the obvious advantage of providing
protection against interference from other wireless operators. The disadvantage is dealing with the licensing process. This process varies depending on local regulations from either being very simple and quick to complex and lengthy and in countries where auctions are used, it can be expensive in highly sought-after regions.
The use of unlicensed spectrum gives the wireless operator the advantage of being able to deploy immediately but runs the risk of interference from neighboring wireless operators in the future. In general our feeling is that the use of licensed spectrum is desirable in major metropolitan areas where multiple wireless operators are more likely. License- exempt spectrum on the other hand, is often a good choice in rural areas where there are likely to be fewer operators. In these areas interference mitigation is easily accomplished through frequency coordination between the operators. A good practice when deploying with unlicensed spectrum is to size hubs such that no more than half the available band is used. This enables the use of automatic channel selection to enable auto-selection of channels that are not subject to interference from other wireless operators.
The three frequency bands that are of primary interest with today’s prevailing regulations are:
• The license-exempt 5.8 GHz (known as Universal National Information Infrastructure (UNII) Band in the U.S.)
• The licensed 2.5 GHz (known as Multipoint Distribution Service (MDS) Band, aka Broadband Radio Service (BRS) in U.S.)
• The licensed 3.5 GHz Band
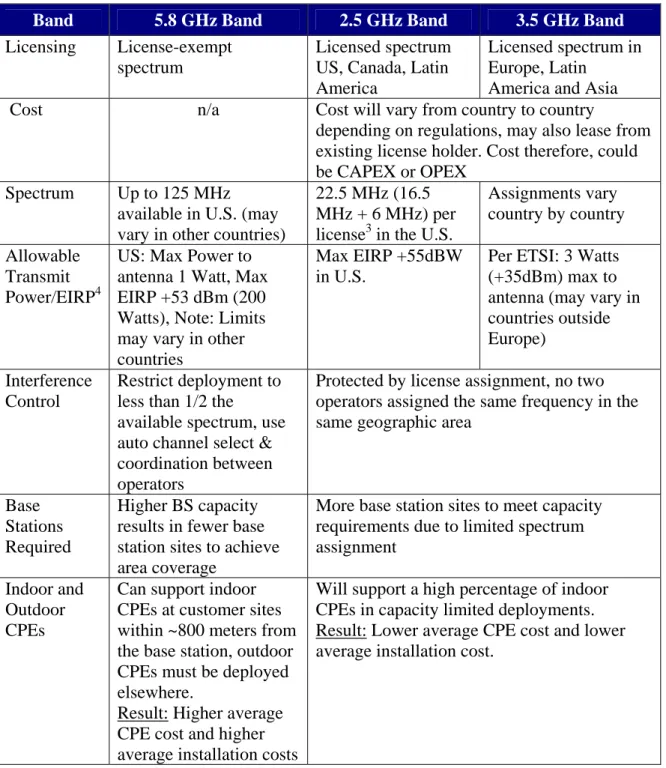
A summary of these bands and relevant considerations for the WiMAX business case is provided in the following table. In our analysis we will use the 3.5 GHz band for metro area deployment and the 5.8 GHz unlicensed band for rural area deployment.
Band 5.8 GHz Band 2.5 GHz Band 3.5 GHz Band Licensing License-exempt
spectrum
Licensed spectrum US, Canada, Latin America
Licensed spectrum in Europe, Latin
America and Asia
Cost n/a Cost will vary from country to country
depending on regulations, may also lease from existing license holder. Cost therefore, could be CAPEX or OPEX
Spectrum Up to 125 MHz available in U.S. (may vary in other countries)
22.5 MHz (16.5 MHz + 6 MHz) per license3 in the U.S.
Assignments vary country by country Allowable
Transmit Power/EIRP4
US: Max Power to antenna 1 Watt, Max EIRP +53 dBm (200 Watts), Note: Limits may vary in other countries
Max EIRP +55dBW in U.S.
Per ETSI: 3 Watts (+35dBm) max to antenna (may vary in countries outside Europe)
Interference Control
Restrict deployment to less than 1/2 the
available spectrum, use auto channel select &
coordination between operators
Protected by license assignment, no two operators assigned the same frequency in the same geographic area
Base Stations Required
Higher BS capacity results in fewer base station sites to achieve area coverage
More base station sites to meet capacity requirements due to limited spectrum assignment
Indoor and Outdoor CPEs
Can support indoor CPEs at customer sites within ~800 meters from the base station, outdoor CPEs must be deployed elsewhere.
Result: Higher average CPE cost and higher average installation costs
Will support a high percentage of indoor CPEs in capacity limited deployments.
Result: Lower average CPE cost and lower average installation cost.
Table 3: Comparison of Relevant Frequency Bands
3 In accordance with FCC band-plan revision, June 10, 2004 Report and Order (FCC 04-135).
4 EIRP is the effective radiated power compared to an isotropic radiator and is equal to the antenna gain in dB plus the power at the antenna input port in dBm or dBW.
Geographic Scenarios for Business Case Analysis
For the business case analysis three different scenarios are analyzed, the characteristics of which are summarized in table 4.
Scenario 1: Scenario 2: Scenario 3:
Geographical Area Description
Major City/Metropolitan Area Small Rurally Located City or
Town Market Segment Residential Residential, SME &
WiFi Backhaul
Residential & SME
Size 125 sq-km 16 sq-km
Population ~1,000,000 ~25,000
Residential Density 6000 HH/sq-km in urban center, 1500 HH/sq-km in suburban area, 500 HH/sq-km in exurban area
600 HH/sq-km
Total Households ~390,000 ~9,600
Total SME n/a ~24,000 n/a
Adoption Rate 4 years 3 Years
Frequency Band Licensed 3.5 GHz Band Unlicensed 5.8 GHz
Channel BW 3.5 MHz, FDD 10 MHz, TDD
Assumed Spectrum 28 MHz (2 x 14 MHz) 60 MHz
Table 4: Summary of Business Case Scenarios
Capital Expense (CAPEX) Items Base Station, Edge and Core Network
The business case assumes a green field deployment and as such it must include an allowance for core and edge network equipment in addition to WiMAX-specific equipment (see figure 3). Most of this equipment must be in place prior to offering services. Base stations and base station equipment need not be installed in totality at the outset, but can be deployed over a period of time to address specific market segments or geographical areas of interest to the operator. Nevertheless, in a metro area, it is desirable to install a sufficient number of base stations to cover an addressable market large enough to quickly recover the fixed infrastructure costs. It is also desirable in the case of fixed services involving operator-installed outdoor CPEs with directional antennas, to locate and deploy base stations in such way so as to minimize the possibility of having to insert other base stations within the same coverage area to add capacity. This approach would
generally require potentially expensive truck-rolls to redirect outdoor CPE antennas and can be avoided with careful long range market analysis and RF planning. If sufficient spectrum is available, base station capacity can be increased by simply adding additional channels to all or to selected base stations as required to match base station capacity to growing customer requirements. This is an ideal way to phase the deployment and grow the wireless network capacity to match customer growth. In the business case analysis base station capacity is determined by using a 20:1 over-booking factor for “best effort”
residential services assuming 384 kbps average data rate and 1:1 for SME committed information rate (CIR) services. For the residential case this conservative over-booking factor should enable WiMAX subscribers to experience performance during peak periods superior to what many DSL and cable customers experience today. In scenarios 1 and 2 it is assumed that all the base stations necessary to meet long term capacity requirements would be deployed prior to offering services. In scenario 3, a single base station is deployed to cover the region and two channels added in year 3 to increase capacity. In very large metropolitan areas an operator may choose to deploy base stations over several years to spread out the capital investment by dividing the area into smaller geographic regions and fully covering one region prior to moving on to the next.
The business case also assumes the deployment of a high capacity point-to-point wireless backhaul connection for each base station to a point of presence or fiber node for
connection to the core network. This can also be accomplished by means of leased T1/E1 lines in which case, rather than a capital expense there would be an operating expense.
Table 5 summarizes the base station and infrastructure costs that have been assumed for the three business case scenarios. For scenarios 1 and 2 it is assumed that a spectrum license is obtained through an auction process at a cost of $.01 per MHz pop5. In some countries licenses can be obtained at no initial cost but with an annual “lease” fee. In these cases the cost to the operator would be entered as an operating expense rather than a capital expense.
5 This is an order of magnitude higher than the average price paid for WCS licenses recently auctioned by the FCC in the 2.3 GHz band. It could however, reflect a possible auction price in a highly competitive market with many bidders.
Figure 3: Network Description
Description Scenario 1 Scenario 2 Scenario 3 Comments WiMAX
Equipment
$35K per Base Station for 4 Sector/Channel configuration
+$7K per channel for additional channels / sectors
Other Base Station Equipment
$15K Covers any necessary
cabinets, network interface cards, etc.
Backhaul Link
$25K for a PtP microwave link
$100K Allows for at least one multiple hop in rural area
Core & Edge Equipment
$400K $500K $100K Router or ATM
Switch, NMS, etc.
Spectrum License
Assume $.01 per MHz Pop n/a Assumes license is acquired via an auction process or other up-front investment Base Station
Acquisition
& Civil Works
$50K Average per base station
$50K Includes indoor and outdoor site
preparation, indoor to outdoor cabling, etc.
Table 5: CAPEX for Network Infrastructure
Global Internet PSTN
Customer Premise Equipment
Edge Traffic Aggregation
Core Central Office Network Management
VOIP Server, etc.
Wireless PMP Access
Base Station
PtP Wireless Backhaul
Fiber Network
CPE Equipment
WiMAX equipment manufacturers will be providing CPE hardware in a variety of port configurations and features to address the needs of different market segments. Residential CPEs are expected to be available in a fully integrated indoor self-installable unit as well as an indoor/outdoor configuration with a high gain antenna for use on customer sites with lower signal strength. In the business case analysis a percentage breakdown of each is assumed in accordance with the frequency band, cell radius and propagation conditions that are likely to be encountered in the different geographical areas.
CPEs for SME will generally be configured with T1/E1 ports in addition to 100BT Ethernet ports. These units are priced higher for the business case, consistent with the added performance.
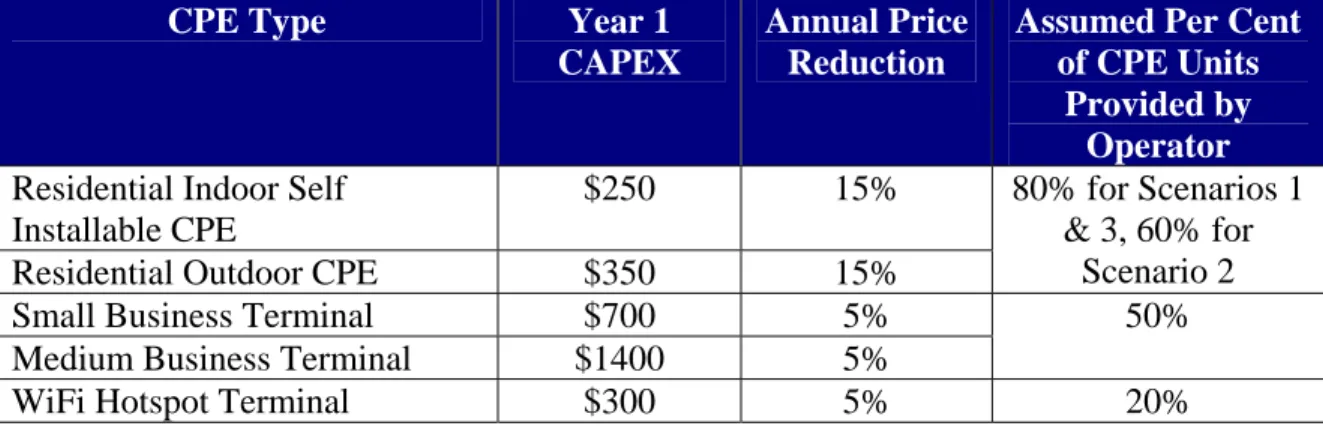
For both the residential and SME market segment it is assumed that a percentage of customers will opt to supply their own equipment rather than pay an equipment lease fee to the operator. This has the effect of reducing the CPE CAPEX and CPE maintenance expense. It also however, reduces operator revenues derived from equipment lease fees.
Because of this interrelationship the impact on the payback period is not significant.
The business case analysis assumes that the price of residential terminals will drop by about 15% per year due to growing volumes and manufacturing efficiencies and lower volume business terminals will drop by about 5% per year.
The CPE costs used in the business case analysis are summarized in the following table.
CPE Type Year 1
CAPEX
Annual Price Reduction
Assumed Per Cent of CPE Units
Provided by Operator Residential Indoor Self
Installable CPE
$250 15%
Residential Outdoor CPE $350 15%
80% for Scenarios 1
& 3, 60% for Scenario 2
Small Business Terminal $700 5%
Medium Business Terminal $1400 5%
50%
WiFi Hotspot Terminal $300 5% 20%
Table 6: CPE CAPEX
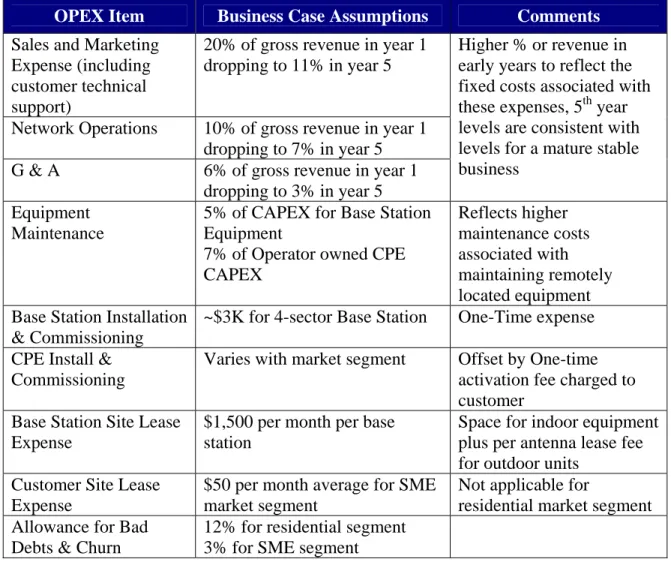
Operating Expense (OPEX) Items
A summary of the OPEX items that are used in the business case analysis are summarized in table 7.
OPEX Item Business Case Assumptions Comments Sales and Marketing
Expense (including customer technical support)
20% of gross revenue in year 1 dropping to 11% in year 5
Network Operations 10% of gross revenue in year 1 dropping to 7% in year 5 G & A 6% of gross revenue in year 1
dropping to 3% in year 5
Higher % or revenue in early years to reflect the fixed costs associated with these expenses, 5th year levels are consistent with levels for a mature stable business
Equipment Maintenance
5% of CAPEX for Base Station Equipment
7% of Operator owned CPE CAPEX
Reflects higher maintenance costs associated with maintaining remotely located equipment Base Station Installation
& Commissioning
~$3K for 4-sector Base Station One-Time expense CPE Install &
Commissioning
Varies with market segment Offset by One-time activation fee charged to customer
Base Station Site Lease Expense
$1,500 per month per base station
Space for indoor equipment plus per antenna lease fee for outdoor units
Customer Site Lease Expense
$50 per month average for SME market segment
Not applicable for
residential market segment Allowance for Bad
Debts & Churn
12% for residential segment 3% for SME segment
Table 7: OPEX Summary
The Business Case
Scenario 1: Residential Market Segment in a Metro Area Environment
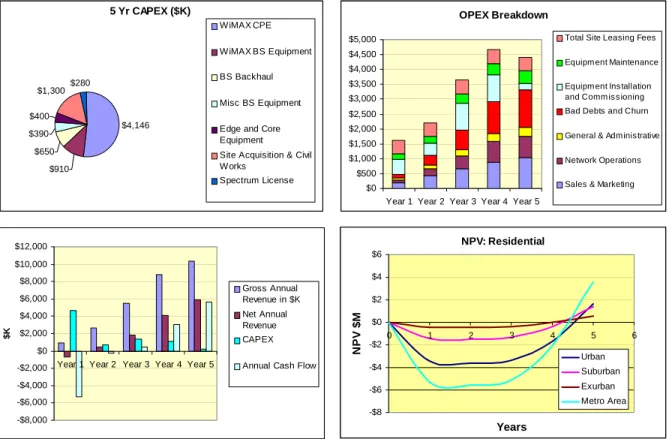
A market financial summary for scenario 1 is provided in table 8. The financial details are provided in the graphs shown in figure 4. The spectrum available to the operator is assumed to be limited to 28 MHz (2 x 14 MHz). The WiMAX base station equipment uses 3.5 MHz channels with frequency division duplexing. A 4-sector base station
therefore, can be deployed using one channel pair per sector. Due to the limited spectrum, the base stations in each of the three geographical areas are capacity limited rather than range limited and 26 base stations are required to provide services to 6.3% of the
addressable residential market. With a 4 year market adoption rate (see figure 2) to reach 90% of the target market penetration, installation and commissioning costs peak in years 3 and 4. This contribution to OPEX plays a lesser role in the 5th year as the annual rate of customer growth slows.
The CAPEX is dominated by WiMAX CPEs since it is assumed for this scenario that 80% of the equipment would be provided by the operator. This of course is offset by the
$10 per month equipment rental fees. As CPE prices decline we would expect a higher percentage of CPEs to be purchased by the customer to avoid the rental expense.
With an internal rate of return (IRR) of 90% this is clearly an attractive business model.
Scenario 1 Summary: Residential Market Segment in Metro Area
Frequency Band 3.5GHz WiMAX Base Stations Deployed 26
Channel BW in MHz 3.50 Aggregate Payload in Mbps 1,005
Spectrum Required in MHz 28 Coverage Area in sq-km 125
Addressable Market Average Data Density Mbps/sq-km 8
Households Covered 388,254 Population in Coverage Area 1,009,461
Businesses Covered n/a
% of Indoor Residential CPEs 60%
Market Adoption Curve 4 Years % Res CPEs Supplied by Operator 80%
Residential Market 6.3% % SME CPEs Supplied by Operator n/a
Residential Voice Services 23% ARPU Price Erosion 5%
SME Market n/a Avg # Subscribers per BS 946
SME Voice Services n/a Total CAPEX per Subscriber $328
WiFi Hot Spots Backhauled n/a Total CAPEX in $M $8.1
Net Present Value (5 yrs) $M $3.6 Internal Rate of Return (IRR) 90%
Spectrum
Assumed CPE Mix Market Penetration (5th yr)
Deployment Data
Table 8: Market Summary for Scenario 1
Figure 4: Financial Summary for Scenario 1
Scenario 2: Residential, SME and WiFi Backhaul Market Segment in a Metro Area Environment
The business case for scenario 2 is summarized in table 9 and in figures 5 and 6. This deployment scenario covers the same geographical area as scenario 1 but requires 37 additional base station sites to provide the added capacity necessary to address the SME market and to provide backhaul connections for 30 WiFi hot spots in addition to the residential market segment. Even though the number of business customers is less than one-tenth the number of residential customers the higher ARPU doubles the gross revenue (see graphs in figure 6) and improves the payback by more than six months as compared to a residential-only market segment.
With the resulting smaller average cell sizes an increased number of indoor residential CPEs can be supported as compared to scenario 1. These units being lower cost it is reasonable to conclude that more customers will choose to buy rather than rent their equipment. This, coupled with the assumption that a higher percentage of business
customers will buy their own equipment, lowers the CPE contribution to less than 30% of the total CAPEX.
5 Yr CAPEX ($K)
$4,146
$910
$650
$390
$400
$1,300$280
WiMAX CPE WiMAX BS Equipment BS Backhaul Misc BS Equipment Edge and Core Equipment Site Acquisition & Civil Works
Spectrum License
OPEX Breakdown
$0
$500
$1,000
$1,500
$2,000
$2,500
$3,000
$3,500
$4,000
$4,500
$5,000
Year 1 Year 2 Year 3 Year 4 Year 5
Total Site Leasing Fees
Equipm ent Maintenance
Equipm ent Ins tallation and Comm is sioning Bad Debts and Churn
General & Administrative
Network Operations
Sales & Marketing
-$8,000 -$6,000 -$4,000 -$2,000
$0
$2,000
$4,000
$6,000
$8,000
$10,000
$12,000
Year 1 Year 2 Year 3 Year 4 Year 5
$K
Gross Annual Revenue in $K Net Annual Revenue CAPEX Annual Cash Flow
NPV: Residential
-$8 -$6 -$4 -$2
$0
$2
$4
$6
0 1 2 3 4 5 6
Years
NPV $M
Urban Suburban Exurban Metro Area
Scenario 2 Summary: Residential & SME Market Segment in Metro Area
Frequency Band 3.5GHz WiMAX Base Stations Deployed 63
Channel BW in MHz 3.50 Aggregate Payload in Mbps 2,470
Spectrum Required in MHz 28 Coverage Area in sq-km 125
Addressable Market Average Data Density Mbps/sq-km 20
Households Covered 388,513 Population in Coverage Area 1,010,134
Businesses Covered 24,312
% of Indoor Residential CPEs 80%
Market Adoption Curve 4 Years % Res CPEs Supplied by Operator 60%
Residential Market 6.4% % SME CPEs Supplied by Operator 50%
Residential Voice Services 23% ARPU Price Erosion 5%
SME Market 7.8% Avg # Subscribers per BS 423
SME Voice Services 52% Total CAPEX per Subscriber $456
WiFi Hot Spots Backhauled 30 Total CAPEX in $M $12.2
Net Present Value (5 yrs) $M $12.8 Internal Rate of Return (IRR) 107%
Spectrum
Assumed CPE Mix Market Penetration (5th yr)
Deployment Data
Table 9: Market Summary for Scenario 2
Figure 5: Financial Summary for Scenario 2
5 Yr CAPEX ($K)
$3,507
$2,205
$1,575
$945
$500
$3,150
$280
WiMAX CPE WiMAX BS Equipment BS Backhaul Misc BS Equipment Edge and Core Equipment Site Acquisition & Civil Works
Spectrum License
OPEX Breakdown
$0
$1,000
$2,000
$3,000
$4,000
$5,000
$6,000
$7,000
$8,000
$9,000
Year 1 Year 2 Year 3 Year 4 Year 5
Total Site Leasing Fees
Equipm ent Maintenance
Equipm ent Ins tallation and Comm is sioning Bad Debts and Churn
General & Administrative
Network Operations
Sales & Marketing
-$15,000 -$10,000 -$5,000
$0
$5,000
$10,000
$15,000
$20,000
$25,000
Year 1 Year 2 Year 3 Year 4 Year 5
$K
Gross Annual Revenue in $K Net Annual Revenue CAPEX Annual Cash Flow
NPV: Residential +SME & WiFi Backhaul
-$15 -$10 -$5
$0
$5
$10
$15
0 1 2 3 4 5 6
Years
NPV $M
Urban Suburban Exurban Metro Area
Figure 6: Customer Adoption and Revenue Contribution
Scenario 3: Residential Market Segment in a Rurally Located Small City or Town Scenario 3, summarized in table 10 and figure 7, is representative of many small cities or towns throughout the world in developed as well as developing countries. Geographically distant from a major metropolitan area, these areas are among the most underserved insofar as broadband access is concerned. A wireless operator should be able to quickly achieve high market penetration in these venues. Therefore, a 3-year market adoption rate is assumed for this case with a residential market penetration at 5 years reaching 20%.
The use of spectrum in one of the license-exempt bands can also be considered since it is not likely that more than a few operators would elect to address these types of markets.
With only 2 to 3 operators, coordination for interference control is straightforward since it is to the advantage of each operator to mitigate the potential for interference in order to maintain quality of service.
In this case a range limited rather than capacity limited deployment scenario is assumed with a single 5.8 GHz base station providing coverage for the entire 16 sq-km. Because of the extended range 80% of the CPEs are assumed to be outdoor units.
One of the key challenges in remotely located deployment areas is the establishment of a suitable high capacity backhaul connection to a distant fiber node. In this case a Point-to- point OC-3 (155Mbps) link would provide backhaul capacity for the single base station with sufficient excess capacity to backhaul a second base station via a base station to base station link if warranted by higher than expected market demand. In the analysis it is assumed that a multi-hop point-to-point microwave link would be necessary to connect the “master” base station to a distant fiber node or switching center. A small CAPEX investment and an IRR of 131% makes this a very attractive market opportunity.
Customer Adoption
0 5,000 10,000 15,000 20,000 25,000 30,000
0 1 2 3 4 5 6
Years
Residential
0 500 1,000 1,500 2,000 2,500 3,000
SME
Residential SME
Gross Revenue in $K
$0
$2,000
$4,000
$6,000
$8,000
$10,000
$12,000
0 1 2 3 4 5 6
Years
Residential & SME
$0
$50
$100
$150
$200
$250
$300
WiFi Backhaul
Residential SME WiFi Backhaul
Scenario 3 Summary: Residential & SME Market Segment in Rural Area
Frequency Band 5.8GHz UNII WiMAX Base Stations Deployed 1
Channel BW in MHz 10 Aggregate Payload in Mbps 69
Spectrum Required in MHz 60 Coverage Area in sq-km 16
Addressable Market Average Data Density Mbps/sq-km 4
Households Covered 9,772 Population in Coverage Area 25,407
Businesses Covered 733
% of Indoor Residential CPEs 20%
Market Adoption Curve 3 Years % Res CPEs Supplied by Operator 80%
Residential Market 20.0% % SME CPEs Supplied by Operator 50%
Residential Voice Services 50% ARPU Price Erosion 5%
SME Market 5.5% Avg # Subscribers per BS 1,992
SME Voice Services 80% Total CAPEX per Subscriber $368
WiFi Hot Spots Backhauled n/a Total CAPEX in $M $0.7
Net Present Value (5 yrs) $M $1.1 Internal Rate of Return (IRR) 131%
Spectrum
Assumed CPE Mix Market Penetration (5th yr)
Deployment Data
Table 10: Market Summary for Scenario 3
Figure 7: Financial Summary for Scenario 3
5 Yr CAPEX ($K)
$419
$49
$100
$15
$100
$50
$0
WiMAX CPE WiMAX BS Equipment BS Backhaul Misc BS Equipment Edge and Core Equipment Site Acquisition & Civil Works
Spectrum License
OPEX Breakdown
$0
$100
$200
$300
$400
$500
$600
$700
Year 1 Year 2 Year 3 Year 4 Year 5
Total Site Leasing Fees
Equipm ent Maintenance
Equipm ent Ins tallation and Comm is sioning Bad Debts and Churn
General & Administrative
Network Operations
Sales & Marketing
-$600 -$400 -$200
$0
$200
$400
$600
$800
$1,000
$1,200
$1,400
Year 1 Year 2 Year 3 Year 4 Year 5
$K
Gross Annual Revenue in $K Net Annual Revenue CAPEX Annual Cash Flow
NPV: Residential
-$0.6 -$0.4 -$0.2
$0.0
$0.2
$0.4
$0.6
$0.8
$1.0
$1.2
0 1 2 3 4 5 6
Years
NPV $M
Comparing the Three Business Case Scenarios
A NPV comparison of the three scenarios is shown in the graph in figure 8. The accompanying table in figure 8 provides a summary of the WiMAX base stations required to meet the capacity and coverage requirements in each of the three business case scenarios. The chart clearly shows the business advantage of adding the SME market segment to the residential-only scenario.
Figure 8: Comparison of Scenarios 1, 2 and 3
Payback Sensitivity
The market related parameters selected for the business case analysis will fit many specific markets but obviously not all markets. The three scenarios already provided some insight as to the impact of market penetration variation. Other variables that are likely to vary from one situation to another are the market adoption rate and the initial ARPU necessary to attract customers or to entice customers to switch from their current provider to a new wireless access provider. In actual practice these two parameters are not independent but for this exercise they are assumed to be so. The two graphs in figure 9 shows the NPV sensitivity for the scenario 2 business case to both a longer and shorter market adoption rate and to a 25% reduction in the initial ARPUs.
1 2 3
5.8 GHz
Urban # BSs 17 48
Range 1.0 km 0.6 km
Suburban # BSs 7 12
Range 1.6 km 1.2 km
Exurban # BSs 2 3
Range 2.1 km 1.7 km
Rural # BSs 1
Range 2.3 km
Frequency Band 3.5 GHz Base Station Deployment Summary Scenario
Deployment Comparisons
-$15 -$10 -$5
$0
$5
$10
$15
0 1 2 3 4 5 6
NPV in $M
Scenario 1 Scenario 2 Scenario 3
Figure 9: Sensitivity Analysis for Scenario 2
Conclusions and Summary
There are many other demographic situations that can be analyzed and a host of alternative assumptions that can be made. Hopefully the scenarios and assumptions selected for the business case analysis in this paper will provide the reader with a good perspective regarding the attributes and business opportunities that will be realized when deploying a wireless MAN using the WiMAX IEEE 802.16d technology.
Some conclusions that can be drawn from the analysis are:
1. A winning business case can be realized with a WiMAX based network in a wide variety of demographic environments.
2. Addressing the SME market along with the residential market is a good business decision; it not only reduces the payback period by about 6 months but also reduces the investment risk since competitive forces in the two market segments are relatively independent.
3. Providing backhaul for WiFi hot spots is not a viable standalone business and does not contribute a great deal to the business case in conjunction with the residential and/or SME market. It does however represent a good source of additional revenue with little additional capital investment. It is also a business that is efficient to sell and manage in that long term agreements would generally be made with WiFi operators to cover an entire geographic region.
Scenario 2: NPV Sensitivity to Adoption Rate
-$15 -$10 -$5
$0
$5
$10
$15
$20
$25
0 1 2 3 4 5 6
NPV in $M
3 Yr Adoption Rate Base Case 5 Yr Adoption Rate
Scenario 2: NPV Sensitivity to Reduced ARPU
-$15 -$10 -$5
$0
$5
$10
$15
0 1 2 3 4 5 6
NPV in $M
Base Case
25% ARPU 1st Yr Price Reduction
4. If an operator chooses to cherry-pick regions for deployment, the lower density and underserved areas require less initial investment, provide a faster payback and can be deployed with license-exempt spectrum with minimal risk of interference.
This also provides a new operator the opportunity to build a reputation for quality of service in a low risk environment before deploying in the more highly
competitive urban areas. A caveat to this strategy however is that the longer the highly competitive areas are ignored the more entrenched the existing providers of DSL and cable services become.
5. In developing countries due to the lack of suitable access alternatives and high pent-up demand, one can expect higher market penetrations and quicker adoption rates than those assumed in this paper. Although these parameters are partially offset by lower revenues per customer due to prevailing economic conditions, it is reasonable to expect even higher returns than those shown here.
As mentioned earlier in this paper, the infrastructure deployed to address the residential and SME market segments can also be shared with other wireless access applications such as cellular backhaul, public safety services and private networks. Public safety services would make use of the nomadic capability of IEEE 802.16d. These applications provide additional revenue opportunities for the WiMAX operator with minimal added CAPEX and OPEX.
An application that has been mentioned but not covered in this paper is mobile
applications based on IEEE 802.16e. The availability of portable devices based on IEEE 802.16e in the near future will provide additional business opportunities for the WiMAX operator. A further description of mobile applications and the associated business case will be the subject of a future white paper.
Appendix: Acronyms Used in this Paper and Other Related Acronyms NPV Net Present Value: The future value of an investment depending on a particular
cost of capital. 10% is assumed in the business case examples
IRR Internal Rate of Return: The cost of capital that results in a NPV of zero at the end of the period, in this case, 5 years
ARPU Average Revenue per User: The expected average customer revenue
CIR Committed Information Rate: A minimum customer data rate guaranteed by a service level agreement between the customer and the operator
PIR Peak Information Rate: Maximum allowable data rate that a customer may encounter during non-busy hours also specified in service level agreement CPE Customer Premises Equipment: Equipment that resides at the customer or
subscriber end of the network
SME Small and Medium Enterprise: Small and medium sized businesses LAN Local Area Network: WiFi, based on IEEE 802.11 is a wireless LAN
technology
MAN Metropolitan Area Network: WiMAX, based on IEEE 802.16 is a wireless MAN technology
LOS Line of Sight: Both ends of a wireless link are in visual sight of one another NLOS Non Line of Sight: Line of sight between ends of a wireless link is blocked by
buildings or other obstacles
MDS Multipoint Distribution Service: In conjunction with the ITFS band this frequency band covers 2495 to 2690 MHz in the U.S.
BRS Broadband Radio Service: New descriptor for the MDS band per FCC release June 10, 2004
ITFS Instructional Television Fixed Service
UNII Universal National Information Infrastructure: Refers to the license-exempt 5150-5350 MHz and 5725-5825 MHz Bands
ISM Instructional, Scientific and Medical: A series of license-exempt bands, of primary interest is 5725-5850 MHz which overlaps the UNII band. WiFi devices use the 2.4 GHz ISM bands in addition to the 5 GHz UNII band.
ETSI European Telecommunications Standards Institute