How to Calculate Bibliometric Using VOSviewer with Publish or Perish (Using Scopus Data): Science Education
Keywords
Dwi Novia Al Husaeni*, Dwi Fitria Al Husaeni
Pendidikan Ilmu Komputer, Universitas Pendidikan Indonesia, Bandung, Indonesia
*Correspondence: E-mail: [email protected]
A B S T R A C T A R T I C L E I N F O
The purpose of this study is to analyze and demonstrate step-by-step bibliometric data analysis using VOSViewer completely and systematically using article data taken from Scopus. A step-by-step analysis is provided to make first-time users easily follow how to use VOSviewers. This research makes it possible to provide easy data analysis by utilizing capture tools and providing analysis of research developments related to science education. The method used in this study is to perform bibliometric analysis to produce various types of visualizations, namely network visualization, overlay visualization, and density visualization.
The analysis was carried out by the number of publications obtained related to a predetermined topic of 200 documents with the range of article publication years from 2013 - 2023.
As a practical example, we evaluate the analysis of articles that discuss the keywords used for data collection, namely
"Science Education". We found that VOSviewer can be used for shock results in 3 forms of visualization.
© 2022 Universitas Pendidikan Indonesia
Article History:
Submitted/Received 03 Feb 2022 First Revised 16 Mar 2022 Accepted 03 Mei 2022
First Available online 05 Mei 2022 Publication Date 01 Dec 2022
____________________
Keyword:
Bibliometric, Science Education, Scopus,
VOSviewer.
Indonesian Journal of Educational Research and Technology
Journal homepage: http://ejournal.upi.edu/index.php/IJERT/
Indonesian Journal of Educational Research and Technology 2 (3) (2022) 247-274
DOI:https://doi.org/10.17509/ijert.v4i1.57213
1. INTRODUCTION
Data analysis using the bibliometric method which is displayed visually with the help of data search tools is urgently needed in today's era, where technology is growing, and human life is heavily influenced by technology. The disaster tools used in bibliometric data analysis are used to obtain research developments from various fields of science. One example of a tool that can be used as data-prone software in bibliometric data analysis is VOSviewer.
VOSviewer is a software that can be used to visualize publication data (Van Eck & Waltman, 2017). This software is very useful for researchers, librarians, and publication database managers to analyze publication data and collaboration networks. VOSViewer offers a text mining function that can be used to build and visualize correlations in article or publication excerpts (Pradhan, 2017). Publication maps can be displayed in several ways and functions, such as zooming, scrolling, and searching system mapping. Thus, articles can be mapped in more detail. VOSviewer presents and represents specific information about bibliometric chart maps. In addition, VOSviewer also provides three forms of visualization, namely network visualization, overlay visualization, and density visualization.
VOSViewer has recently been very popular in analyzing the position of research to be carried out and measuring the novelty of a study. We can display large bibliometric maps in an easy way to interpret a relationship via VOSViewer. VOSViewer has several characteristics, including being able to map various types of bibliometric analysis, supporting several major bibliographic databases, ignoring the time dimension, being limited to analysis of small to medium amounts of data, is intended for text processing functions, using layout and cluster techniques, uses visualization features expanse and density.
Many studies on VOSViewer include research discussing guidelines for using the VOSviewer application (Van Eck and Waltman, 2010), research on the stages of bibliometric data analysis with VOSviewer using google scholar indexed article data (Al Husaeni &
Nandiyanto, 2022), research on bibliometric mapping with VOSviewer in agriculture (Tupan, 2016), Bibliometric analysis on chemical engineering (Nandiyanto et al., 2021), and bibliometric analysis on bioenergy management using the VOSviewer application (Soegoto et al., 2022). Although many have researched bibliometric data analysis using VOSviewer, only a few have conducted research that discusses how to make a bibliometric analysis using VOSViewer which is discussed in detail with several pictures of the steps accompanied by examples. Even research on research steps using Scopus data is still ongoing. not yet available.
SCOPUS is a library database that already has standards and a reputation in international journals. Journals indexed by Scopus can also have a high reputation on an international scale.
Scopus itself is under the auspices of Elsevier which is one of the international scale scientific publications that has successfully indexed more than 22,000 article titles from 5,000 publishers.
Therefore, this research was conducted to be able to display bibliometric data analysis steps related to computer and personal computer research using Scopus-indexed article data and other tools such as VOSviewer and Publish or Perish. This research is expected to be used as a reference to be able to carry out big data analysis more easily by using VOSViewer with Scopus data. In addition, it is hoped that this research can also be used as a reference by first- time users because we provide a step-by-step process when using VOSviewer, Publish or Perish with the Scopus database.
DOI:https://doi.org/10.17509/ijert.v4i1.57213 p- ISSN 2775-8419 e- ISSN 2775-8427
2. METHOD
2.1. Preparation of Analysis Tools and Materials
In carrying out data analysis in a bibliometric way using VOSviewer, several applications must be prepared, including:
i) The VOSviewer application (Figure 1), this application is used as software that can visualize the analysis result data to be mapped later.
Figure 1. VOSviewer application logo.
ii) Reference management applications, applications that can be used for reference management are Publish or Perish (Figure 2) and Mendeley (Figure 3). This reference management application is used to collect research data which will later be used and analyzed bibliometrically using VOSviewer. In this study, we use Publish or Perish as reference management software.
Figure 2. Publish or Perish (PoP) application logo.
Figure 3. Mendeley application logo.
iii) Number processing application (Ms.Excel), ms.Excel (Figure 4) is used to assist in processing search results in article data using the Publish or Perish (PoP) reference manager application.
Figure 4. Microsoft Excel application logo.
2.2. Data retrieval
The article data used in this research is research data from articles that have been published in journals that have been indexed by Scopus. In addition, the article data obtained using the Publish or Perish reference manager application must also discuss the keywords used, namely "Science Education" with a range of 2013 - 2023.
DOI:https://doi.org/10.17509/ijert.v4i1.57213
2.3. Research Data Mapping
The application used for research data mapping is VOSviewer. The search result data uses the Publish or Perish application, then is saved in *.ris and *.csv formats. After the storage process is complete, the data in *.csv format is processed in such a way using the Microsoft Excel application. Data with *.ris format is used to process data on VOSviewer. In the VOSviewer application, power will be converted into a data map that is connected to one another.
3. RESULTS AND DISCUSSION 3.1. Scopus API Key Generation
In collecting data using Scopus, the first step that must be taken before collecting data is to register the API Key on the Scopus web. The steps for registering the Scopus API Key are as follows.
i) Open the Scopus Page
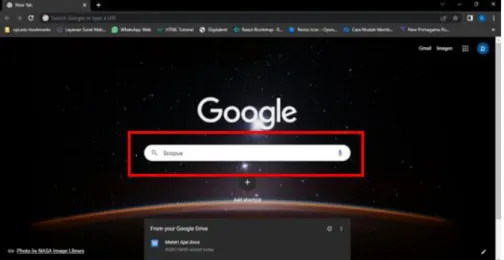
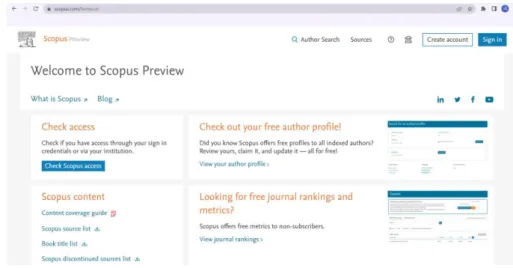
To open the Scopus page, you can use Chrome or other browser applications. The trick is to type "Scopus" in the search box (Figure 5) and then click "enter". Then select a web page with the address “scopus.com” (Figure 6). After that, the start page of the Scopus web will appear as shown in Figure 7.
Figure 5. Scopus web search.
Figure 6. Scopus web address.
DOI:https://doi.org/10.17509/ijert.v4i1.57213 p- ISSN 2775-8419 e- ISSN 2775-8427
Figure 7. Scopus main page.
ii) Login Scopus Account
After successfully logging into the Scopus web, the next step is to log in to the Scopus account that was created by entering the registered email (Figure 8).
Figure 8. Login to Scopus Account.
iii) Enter the Scopus API Page
After successfully logging in, a display will appear as shown in Figure 9. Then the next step that must be taken is to click "Scopus API" which is on the Scopus page.
Figure 9. Click Scopus API on Scopus page.
iv) After that, select the My API Key menu (Figure 10).
DOI:https://doi.org/10.17509/ijert.v4i1.57213
Figure 10. Click My API Key Menu.
v) Copy of registered API Key (Figure 11).
Figure 11. Copy API Key.
vi) If the API Key has not appeared, then you can create a new API by selecting the "Create API Key" menu (Figure 12).
Figure 12. Create API Key.
vii) After that, fill in the "API Label" data with the desired API label, for website URLs you can fill it in or leave it blank (Figure 13).
Figure 13. Fill label API data.
DOI:https://doi.org/10.17509/ijert.v4i1.57213 p- ISSN 2775-8419 e- ISSN 2775-8427
viii) After that check the box "I agree with the API Service Agreement" (Figure 14).
Figure 14. “I agree with the API Service Agreement” Column.
ix) Then also check the "I agree with the TDM Provisions" box, and the final step is to click the "submit" button (Figure 15).
Figure 15. “I agree with the TDM Provisions” Column and Submit button.
x) After that, you will be asked to enter a confirmation email and enter the email you used to log into your Scopus account (Figure 16).
Figure 16. Email Confirmation.
xi) Then you can return to the "My API Key" page, and you can save the registered API key.
3.2. Data Used
The data taken through Scopus is used as an example for this research. This means that every article data in Scopus that is following the research theme will be used as a file to be used in VOSviewer. The steps of data collection are as follows.
i) Open the Publish or Perish Application
DOI:https://doi.org/10.17509/ijert.v4i1.57213
The first step that must be taken in data collection is to open a reference manager application, namely Publish or Perish (Figure 17). After the Publish or Perish application opens, the Publish or Perish main page will appear as shown in Figure 18.
Figure 17. Open the Publish or Perish application.
Figure 18. The main page Publish or Perish application.
ii) Select Scopus** data source to retrieve Scopus-indexed article data (Figure 19).
Figure 19. Choose Scopus** data resource.
iii) After that, enter the data or research keywords that you will be looking for starting from authors, affiliations, publications names, title words, and keywords. For example, we enter two search keywords through the "publications name and keyword fields" (Figure 20).
DOI:https://doi.org/10.17509/ijert.v4i1.57213 p- ISSN 2775-8419 e- ISSN 2775-8427
Figure 20. Fill field publications name and keywords.
iv) Also, enter the year range of the research you are looking for; in this example, we enter the year range 2013-2023. After completing entering the year range, press the search button to start the search (Figure 21).
Figure 21. Fill in the year range and click the search button.
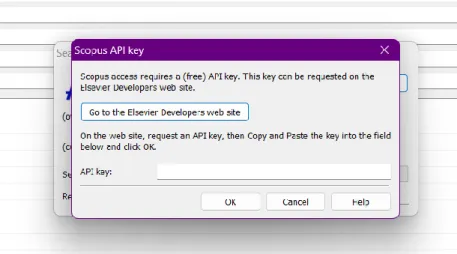
v) After you click the “Search” button, a pop-up will appear as shown in Figure 22.
Figure 22. Pop Up after clicking the search button.
vi) In the pop-up shown in Figure 22, you must enter the Scopus API key that you got in the previous step (Figure 23).
Figure 23. Fill API Key Scopus in API Key Column.
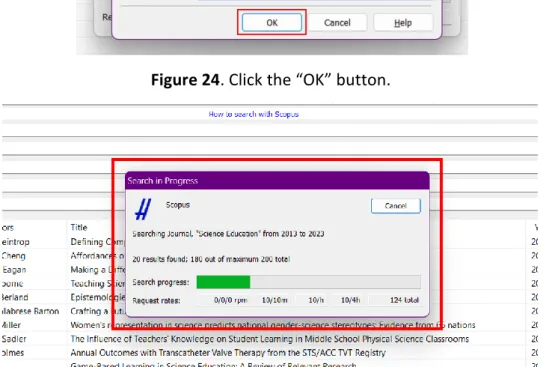
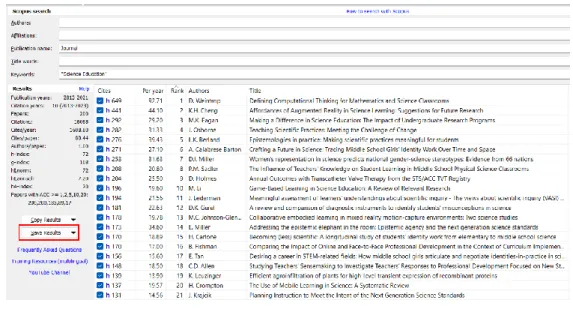
vii) If so, then click the “Ok” button (Figure 24), then the data search process will be carried out (Figure 25). While the data search process is in progress, what must be done is to wait until the data search process is finished.
DOI:https://doi.org/10.17509/ijert.v4i1.57213
Figure 24. Click the “OK” button.
Figure 25. Data search process.
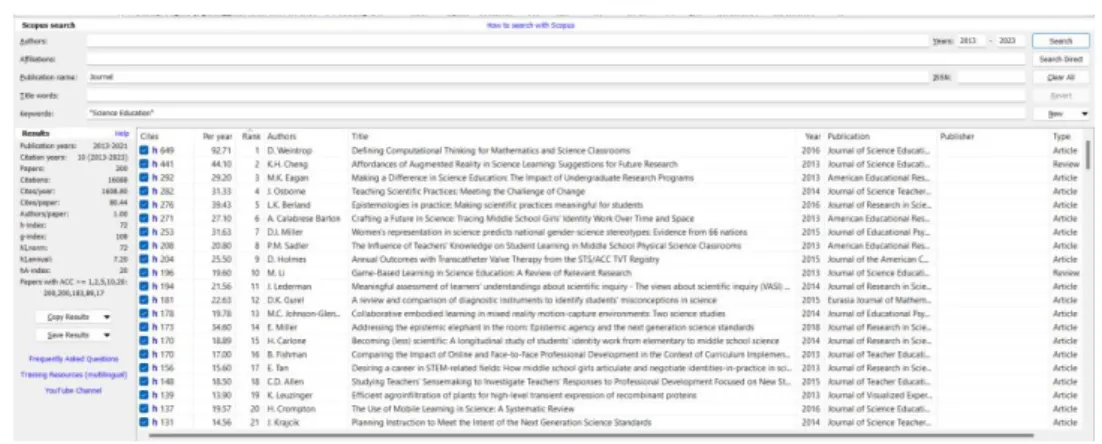
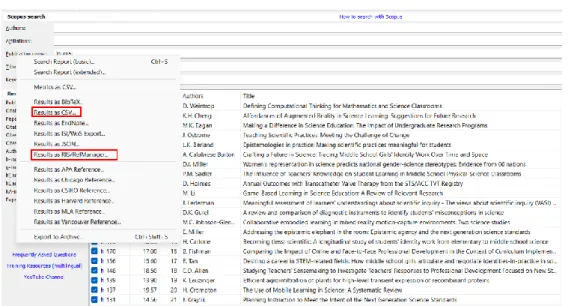
viii) If the search process is complete, a list of publications that match the search keywords that were entered in the previous stage will appear (Figure 26).
Figure 26. List of data search result publications.
The data search process was completed. As explained in the Method, the search result data must be saved in 2 formats namely *.ris and *.csv so that it can be processed again using Ms. Excel and VOSviewer. The steps for storing search results publication data in Publish or Perish are as follows.
i) Click the “Save Results” button on the Publish or Perish page (Figure 27).
DOI:https://doi.org/10.17509/ijert.v4i1.57213 p- ISSN 2775-8419 e- ISSN 2775-8427
Figure 27. Save results button.
ii) After you press the “Save Results” button various kinds of save options will appear, then you just need to save in .RIS and .CSV types (Figure 28).
Figure 28. Choose *.ris and *.csv format.
iii) Then you will get two file formats as shown in Figure 29.
Figure 29. File *.ris format and *.csv format.
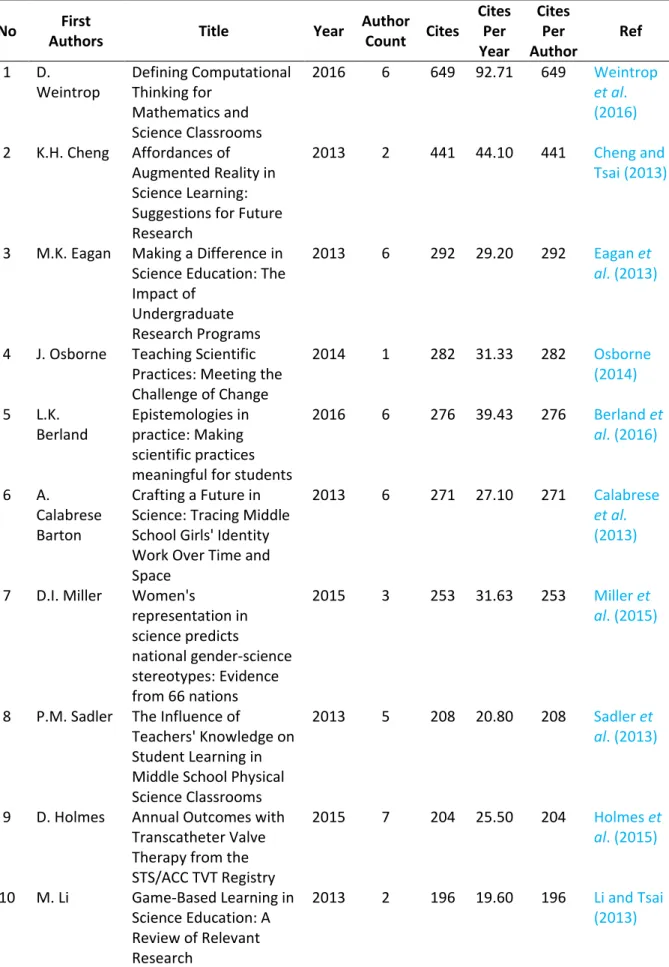
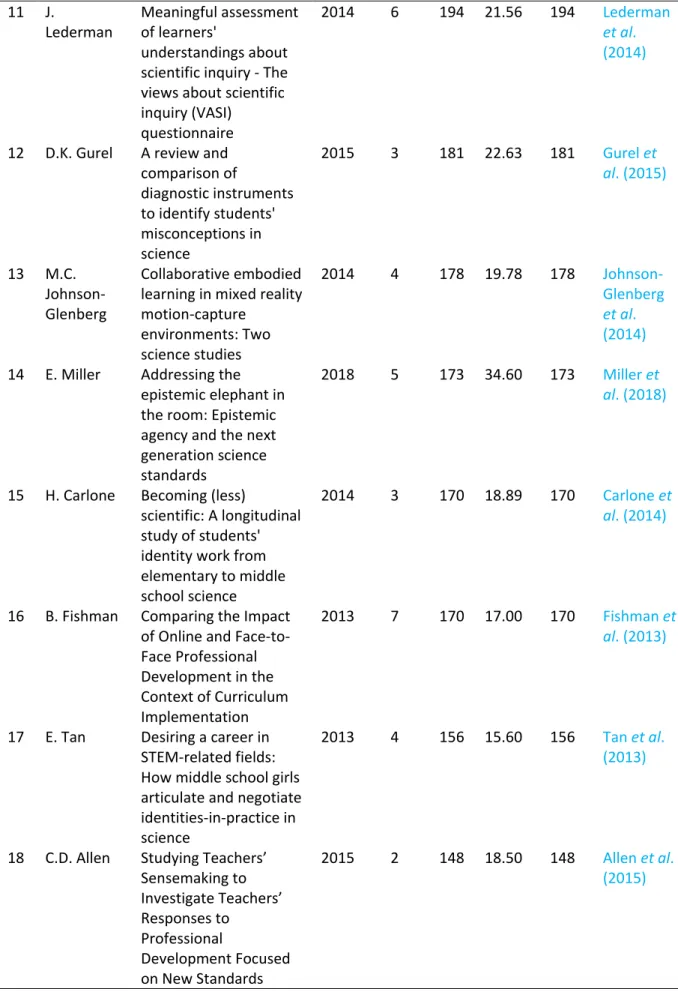
Up to this point, you have obtained publication data sourced from the SCOPUS database which is ready to be used for analysis using the VOSviewer application. The data displayed by Publish or Perish is in the form of metadata such as the author's name, title, year, the journal that published it, and the publisher of the article found. Table 1 shows 20 examples of search data from Publish or Perish search results used in VOSviewer analysis based on the number of citations. We got 200 articles about "Science Education" published in Journal indexed Scopus. The number of citations is 16088, the number of citations per year is
DOI:https://doi.org/10.17509/ijert.v4i1.57213
1608.80, the number of citations per article is 80.44, the author of each article is 1.00, the h- index is 72, and the g-index is 108 (see Table 2).
Table 1. Science Education Research Data based on 20 top citations.
No First
Authors Title Year Author
Count Cites
Cites Per Year
Cites Per Author
Ref
1 D.
Weintrop
Defining Computational Thinking for
Mathematics and Science Classrooms
2016 6 649 92.71 649 Weintrop et al.
(2016)
2 K.H. Cheng Affordances of Augmented Reality in Science Learning:
Suggestions for Future Research
2013 2 441 44.10 441 Cheng and Tsai (2013)
3 M.K. Eagan Making a Difference in Science Education: The Impact of
Undergraduate Research Programs
2013 6 292 29.20 292 Eagan et al. (2013)
4 J. Osborne Teaching Scientific Practices: Meeting the Challenge of Change
2014 1 282 31.33 282 Osborne (2014)
5 L.K.
Berland
Epistemologies in practice: Making scientific practices meaningful for students
2016 6 276 39.43 276 Berland et al. (2016)
6 A.
Calabrese Barton
Crafting a Future in Science: Tracing Middle School Girls' Identity Work Over Time and Space
2013 6 271 27.10 271 Calabrese et al.
(2013)
7 D.I. Miller Women's
representation in science predicts
national gender-science stereotypes: Evidence from 66 nations
2015 3 253 31.63 253 Miller et al. (2015)
8 P.M. Sadler The Influence of
Teachers' Knowledge on Student Learning in Middle School Physical Science Classrooms
2013 5 208 20.80 208 Sadler et al. (2013)
9 D. Holmes Annual Outcomes with Transcatheter Valve Therapy from the STS/ACC TVT Registry
2015 7 204 25.50 204 Holmes et al. (2015)
10 M. Li Game-Based Learning in Science Education: A Review of Relevant Research
2013 2 196 19.60 196 Li and Tsai (2013)
DOI:https://doi.org/10.17509/ijert.v4i1.57213 p- ISSN 2775-8419 e- ISSN 2775-8427
Table 1 (continue). Science Education Research Data based on 20 top citations.
11 J.
Lederman
Meaningful assessment of learners'
understandings about scientific inquiry - The views about scientific inquiry (VASI)
questionnaire
2014 6 194 21.56 194 Lederman et al.
(2014)
12 D.K. Gurel A review and comparison of
diagnostic instruments to identify students' misconceptions in science
2015 3 181 22.63 181 Gurel et al. (2015)
13 M.C.
Johnson- Glenberg
Collaborative embodied learning in mixed reality motion-capture
environments: Two science studies
2014 4 178 19.78 178 Johnson- Glenberg et al.
(2014)
14 E. Miller Addressing the epistemic elephant in the room: Epistemic agency and the next generation science standards
2018 5 173 34.60 173 Miller et al. (2018)
15 H. Carlone Becoming (less)
scientific: A longitudinal study of students' identity work from elementary to middle school science
2014 3 170 18.89 170 Carlone et al. (2014)
16 B. Fishman Comparing the Impact of Online and Face-to- Face Professional Development in the Context of Curriculum Implementation
2013 7 170 17.00 170 Fishman et al. (2013)
17 E. Tan Desiring a career in STEM-related fields:
How middle school girls articulate and negotiate identities-in-practice in science
2013 4 156 15.60 156 Tan et al.
(2013)
18 C.D. Allen Studying Teachers’
Sensemaking to Investigate Teachers’
Responses to Professional
Development Focused on New Standards
2015 2 148 18.50 148 Allen et al.
(2015)
DOI:https://doi.org/10.17509/ijert.v4i1.57213
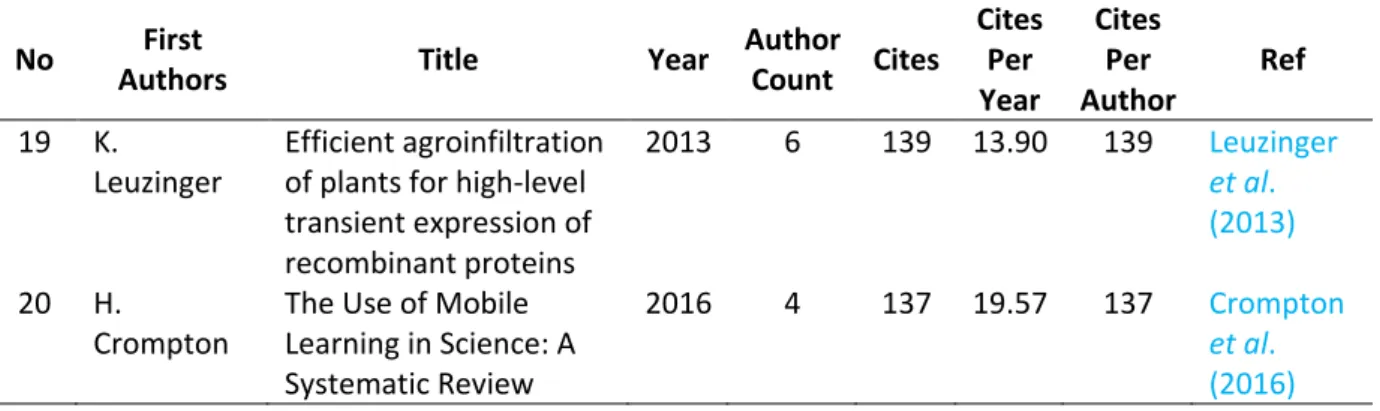
Table 1 (continue). Science Education Research Data based on 20 top citations.
No First
Authors Title Year Author
Count Cites
Cites Per Year
Cites Per Author
Ref
19 K.
Leuzinger
Efficient agroinfiltration of plants for high-level transient expression of recombinant proteins
2013 6 139 13.90 139 Leuzinger et al.
(2013)
20 H.
Crompton
The Use of Mobile Learning in Science: A Systematic Review
2016 4 137 19.57 137 Crompton et al.
(2016)
Table 2. Matrix Data Publication.
Name Description
Publication Year 2013-2021 Citation years 10 (2013-2023)
Papers 200
Citations 16088
Cites/year 1608.80
Cites/paper 80.44
Authors/paper 1.00
h-index 72
g-index 018
h1, norm 72
h1, annual 7.20
hA-index 20
3.3. The Development of Publication Regarding Computer or Personal Computer
Based on the results of searching data on the Scopus database, it shows that the development of research on “Science Education" has experienced inconsistent changes as shown in Figure 30. Based on Figure 30, the study "Science Education" has fluctuated from 2013 to 2017.
Figure 30. The Development of Publication Regarding Science Education.
DOI:https://doi.org/10.17509/ijert.v4i1.57213 p- ISSN 2775-8419 e- ISSN 2775-8427
Development publication from 2017 to 2021, research on science education published in Scopus indexed journals has decreased. In 2022 there will be no research on science education and in 2023 there will be no research on this theme that will be published in Scopus indexed journals. In 2013 the number of researches with the theme used was 37 publications, but in 2014 it decreased by 5 publications to 32 publications. In 2017, the number of researches related to keywords increased again to 26 publications. In 2018, the number of research publications related to keywords was still the same as the previous year (2017), namely 19 publications. In 2018 - 2021 research on Science Education published in Scopus indexed journals continues to decline with the number of publications sequentially, namely 21, 17, 11, and 1 article.
3.4. Bibliometric Map Research on Science Education
Based on search results throughout the Scopus database, 200 research articles were obtained that are relevant to the keywords used. The data obtained is then exported to a
*.ris format file. Files with *.ris format will be inputted and analyzed using the VOSviewer application. There are several steps that must be followed to make a gap using the VOSviewer application, these steps are as follows:
i) Open the VOSviewer Application (Figure 31)
Figure 31. Open the VOSviewer Application.
ii) Then click the “Create” menu (see Figure 32).
Figure 32. Create menu.
iii) After that, "Create map based on text data" and click the "Next" button (see Figure 33).
DOI:https://doi.org/10.17509/ijert.v4i1.57213
Figure 33. “Create map based on text data” and next button.
iv) In the Choose data source section, select “Read data from bibliographic database files”, then click the “Next” button (see Figure 34).
Figure 34. Read data from reference manager file” and next button.
v) On the Select File page, choice option Scopus and Click button “…” (see Figure 35)
Figure 35. Choose file Scopus.
vi) select the *.csv file that was previously obtained through the Publish or Perish 7 application. If you have found the file, then click the "OK" button and click the "Next"
button (see Figure 36-37).
DOI:https://doi.org/10.17509/ijert.v4i1.57213 p- ISSN 2775-8419 e- ISSN 2775-8427
Figure 36. Choose file *.csv.
Figure 37. Click the Next button.
vii) In the Choose Fileds section, select the Title and Abstract field or if you want select Title fields or abstract fields are also allowed. After that, click the “Next Button” (see Figure 38).
Figure 38. Choose “Title and Abstract field” and click the next button.
DOI:https://doi.org/10.17509/ijert.v4i1.57213
viii) After you click the “Next” button, data extraction will be carried out. After the data has been successfully extracted, the Choose counting method page will appear. On the choose counting method page, select “Binary Counting”, then click next to continue the process (see Figure 39).
Figure 39. Choose binary counting and click the next button.
ix) On the Choose threshold page, you can specify a minimum number of occurrences of the term. In this example, we will set the minimum number of occurrences of terms to 5 times, so that 395 terms are found out of a total of 6274 terms. Then click the “Next”
button (see Figure 40).
Figure 40. Choose threshold and click the next button.
x) On the Choose Number of Terms page, you can determine the number of terms that will appear based on their level of relevance. By default, a term with a relevance level of 60%
will be selected, but you can customize the number of terms according to your needs. In this example we will take 60% of the most relevant terms, so we find 237 terms (see Figure 41).
xi) The final step is to verify the selected terms. In this step, you can view and re-select the terms that you will use manually. If you are sure and finished with the terms you will use, the final step is to click the "Finish" button (see Figure 42).
DOI:https://doi.org/10.17509/ijert.v4i1.57213 p- ISSN 2775-8419 e- ISSN 2775-8427
Figure 41. Choose many terms.
Figure 42. Verify selected terms.
xii) After that, a mapping visualization is obtained from the publication data that we have collected through the publish or perish reference manager application (see Figure 43).
Figure 43. The results of the mapping of the research on VOSviewer.
DOI:https://doi.org/10.17509/ijert.v4i1.57213
After the visualization results are obtained, so that the VOSviewer visualization data is not lost, the steps that must be taken are to save the processed VOSviewer map and network file data. The steps for saving VOSviewer data are as follows:
i) Click the “save” button on the left of the VOSviewer page (see Figure 44).
Figure 44. Save button on the VOSviewer page.
ii) Then, after the Save Map pop-up appears, click “…” to select a location to save the file (see Figure 45).
Figure 45. Save Map pop up.
iii) After doing step 2, a page like Figure 46 will appear, give a name to the file to be saved, then click OK.
Figure 46. Select the VOSviewer map file page.
DOI:https://doi.org/10.17509/ijert.v4i1.57213 p- ISSN 2775-8419 e- ISSN 2775-8427
iv) Do the same for the network file storage section. Thus, you can see the results shown in Figure 47. After that, click the “OK” button. Then your VOSviewer data has been successfully saved.
Figure 47. The result of saving the VOSviewer file.
3.4.1. Co-Word Map Network Visualization
Figure 48 shows the relationship between terms depicted in a network. Relationships in network visualization are depicted by lines that go from one term to another (Al Husaeni &
Nandiyanto, 2022). The results of the visualization of the co-word map network of research developments regarding computer or personal computers are divided into 3 clusters as shown in Figure 48 below.
i) Cluster 1. The red color consists of 65 items including area, art, article, attention, bibliometric analysis, child, citation, condition, country, covid, descriptive method, development method, development research, element, esd, example, existence, filed, focus, future, future research, history, information technology, innovation, internet, journal, keyword, lack, law, line, literature review, lot, majority, nation, opportunity, overview, pandemic, parent, period, person, place, presence, publication, reference, relevance, requirement, researcher, review, science education research, scopus databse, society, state, study show, suggestion, systematic review, Taiwan, task, theme, title, tourism, trend, urgency, world, and year (see Figure 49).
ii) Cluster 2. Green color consists of 63 items including ancova, average, avegare score, biology education, comparison, content validity, control class, control group, critical thinking skill, difference, effect, effectiveness, elementary Scholl, elementary school student, experimental class, experimental group, experimental study, expert, hand, high school student, hot, improvement, learning model, learning outcome, Likert scale, mean score, media expert, module, multiple choice test, online, outcome, pbl, planning, population, post-test, pretest, purposive sampling, qualitative method, quasi experiment, quasi experimental design, r&d, research result, research sample, science education expert, scientific reasoning, score, senior high school student, significance, significant difference, significant effect, socio scientific issue, ssi, student critical thinking, syntax, t test, test, treatment, user, validation, validity, and writing (see Figure 50).
iii) Cluster 3. Blue color consists of 55 items including accordance, argument, argumentation, belief, case, central java, challenge, community, concetion, connection, culture, daily life, difficulty, dimension, domain, earth, engineering, ethnoscience, everyday life, fact, female, gap, gender, idea, identification, indigenous knowledgement, life, literature, literature study, local wisdom, meaningful learning, orientation, pattern, perspective, phenomenon, position, pre service science teaching, reason, reflection, regard, relation, religion, science concept, science curriculum, science literacy, science
DOI:https://doi.org/10.17509/ijert.v4i1.57213
teaching, scientific issue, scientific knowledgement, stem, stem education, sustainability, view, and work (see Figure 51).
iv) Cluster 4. Yellow color consists of 39 items including basis, descriptive research, descriptive statistic, function, further research, good category, increase, integrated science, item, lesson plan, mastery, medium category, metacognition, misconception, multiple choice, n gain, national curriculum, percentage, practicality, prospective science teacher, public university, rash model, reliability, research instrument, research subject, response, rubric, scale, science education department, science education program, science education student, science education study program, science teacher candidate, scientific approach, study program, subject matter, university student, and weakness.
(see Figure 52).
v) Cluster 5. Purple color consists of 15 items including academic year, chemistry, combination, conceptual understanding, data collection instrument, data collection technique, documentation, east java, faculty, mathematics, nos, observation sheet, profile, science content, and science process skill (see Figure 53).
Figure 48. Network Visualization.
Figure 49. Network Visualization Cluster 1.
DOI:https://doi.org/10.17509/ijert.v4i1.57213 p- ISSN 2775-8419 e- ISSN 2775-8427
Figure 50. Network Visualization Cluster 2.
Figure 51. Network Visualization Cluster 3.
Figure 52. Network Visualization Cluster 4.
DOI:https://doi.org/10.17509/ijert.v4i1.57213
Figure 53. Network Visualization Cluster 5.
3.4.2. Co-Word Map Overlay Visualization
Figure 54 shows the results of data visualization using VOSviewer in the form of an overlay visualization. The visualization overlay shows the update of each term (Al Husaeni &
Nandiyanto, 2022). Figure 54 shows that of the 200 articles originating from the 2013-2023 range, terms included in the appropriate category and related to the science education keywords are in the 2019 to 2021 range. The color of each term indicates the novelty of the term. The brighter towards the yellow color, the higher the level of renewal (Al Husaeni &
Nandiyanto, 2022; Nandiyanto et al., 2021).
Figure 54. Overlay visualization.
3.4.3. Co-Word Map Density Visualization
Items that have the same markings as the visible item are displayed in the cluster density view. Depending on the item's density at the time, the item point has a specific color. The
DOI:https://doi.org/10.17509/ijert.v4i1.57213 p- ISSN 2775-8419 e- ISSN 2775-8427
dots' color is fixed and depends on the item that is linked to other objects. By highlighting the items that are deemed crucial for examination, density co-word maps help get a general sense of the structure of bibliometric maps (Muoz-Leiva et al., 2021; Al Husaeni &
Nandiyanto 2022). Based on the research findings displayed in Figure 55, it can be deduced that computer or personal computer-related terms are the most frequently used keywords in publications that display the depiction of the density map.
A density map produced by a study of all publications about computers or personal computers published between 2013 and 2023 is shown in Figure 55. According to the density map, the more yellow color is relative to the largest circle's diameter, the more frequently it occurs. Conversely, if a color fades and blends into the background's green hue, it happens less frequently (Tupan, 2019; Al Husaeni & Nandiyanto, 2022).
Figure 55. Density visualization.
4. CONCLUSION
Based on the results and discussion, it can be concluded that VOSviewer can be used as a disaster tool to analyze data bibliometrically, while Publish or Perish can be used as a reference management tool that can be used to collect research article data on "science education". In this study, the data used in analyzing data with VOSviewer is research on
"science education" taken from the Scopus database. The number of publications obtained related to the theme totaled 200 documents spanning 2013-2023. The study "Science Education" has fluctuated from 2013 to 2017. From 2017 to 2021, research on science education published in Scopus indexed journals has decreased. In 2022 there will be no research on science education and in 2023 there will be no research on this theme that will be published in Scopus indexed journals. Network visualization show the development map of science education is divided into 5 clusters. Cluster 1 consists of 65 topics, cluster 2 consists of 63 topics, cluster 3 consists of 55 topics, cluster 4 consists of 39 topics, and cluster 5 consists of 15 topics. So, the total terms in this study are 237 terms from 5 clusters.
5. AUTHORS’ NOTE
DOI:https://doi.org/10.17509/ijert.v4i1.57213
The authors declare that there is no conflict of interest regarding the publication of this article. Authors confirmed that the paper was free of plagiarism.
6. REFERENCES
Al Husaeni, D. F., and Nandiyanto, A. B. D. (2022). Bibliometric using Vosviewer with Publish or Perish (using google scholar data): From step-by-step processing for users to the practical examples in the analysis of digital learning articles in pre and post Covid-19 pandemic. ASEAN Journal of Science and Engineering, 2(1), 19-46.
Allen, C. D., and Penuel, W. R. (2015). Studying teachers’ sensemaking to investigate teachers’
responses to professional development focused on new standards. Journal of Teacher Education, 66(2), 136-149.
Berland, L. K., Schwarz, C. V., Krist, C., Kenyon, L., Lo, A. S., and Reiser, B. J. (2016).
Epistemologies in practice: Making scientific practices meaningful for students. Journal of Research in Science Teaching, 53(7), 1082-1112.
Calabrese Barton, A., Kang, H., Tan, E., O’Neill, T. B., Bautista-Guerra, J., and Brecklin, C.
(2013). Crafting a future in science: Tracing middle school girls’ identity work over time and space. American Educational Research Journal, 50(1), 37-75.
Carlone, H. B., Scott, C. M., and Lowder, C. (2014). Becoming (less) scientific: A longitudinal study of students' identity work from elementary to middle school science. Journal of Research in Science Teaching, 51(7), 836-869.
Cheng, K. H., and Tsai, C. C. (2013). Affordances of augmented reality in science learning:
Suggestions for future research. Journal of Science Education and Technology, 22, 449- 462.
Crompton, H., Burke, D., Gregory, K. H., and Gräbe, C. (2016). The use of mobile learning in science: A systematic review. Journal of Science Education and Technology, 25, 149-160.
Eagan Jr, M. K., Hurtado, S., Chang, M. J., Garcia, G. A., Herrera, F. A., and Garibay, J. C. (2013).
Making a difference in science education: The impact of undergraduate research programs. American Educational Research Journal, 50(4), 683-713.
Fishman, B., Konstantopoulos, S., Kubitskey, B. W., Vath, R., Park, G., Johnson, H., and Edelson, D. C. (2013). Comparing the impact of online and face-to-face professional development in the context of curriculum implementation. Journal of Teacher Education, 64(5), 426-438.
Gurel, D. E. R. Y. A., Eryilmaz, A., and McDermott, L. (2015). A review and comparison of diagnostic instruments to identify students' misconceptions in science. Eurasia Journal of Mathematics Science and Technology Education, 11(5), 989-1008
Holmes, D. R., Nishimura, R. A., Grover, F. L., Brindis, R. G., Carroll, J. D., Edwards, F. H., and STS/ACC TVT Registry. (2015). Annual outcomes with transcatheter valve therapy: from
DOI:https://doi.org/10.17509/ijert.v4i1.57213 p- ISSN 2775-8419 e- ISSN 2775-8427
the STS/ACC TVT registry. Journal of the American College of Cardiology, 66(25), 2813- 2823.
Johnson-Glenberg, M. C., Birchfield, D. A., Tolentino, L., and Koziupa, T. (2014). Collaborative embodied learning in mixed reality motion-capture environments: Two science studies. Journal of Educational Psychology, 106(1), 86.
Lederman, J. S., Lederman, N. G., Bartos, S. A., Bartels, S. L., Meyer, A. A., and Schwartz, R. S.
(2014). Meaningful assessment of learners' understandings about scientific inquiry—The views about scientific inquiry (VASI) questionnaire. Journal of Research in Science Teaching, 51(1), 65-83.
Leuzinger, K., Dent, M., Hurtado, J., Stahnke, J., Lai, H., Zhou, X., and Chen, Q. (2013). Efficient agroinfiltration of plants for high-level transient expression of recombinant proteins. Journal of Visualized Experiments: JoVE, (77), 50521
Li, M. C., and Tsai, C. C. (2013). Game-based learning in science education: A review of relevant research. Journal of Science Education and Technology, 22, 877-898.
Miller, D. I., Eagly, A. H., and Linn, M. C. (2015). Women’s representation in science predicts national gender-science stereotypes: Evidence from 66 nations. Journal of Educational Psychology, 107(3), 631.
Miller, E., Manz, E., Russ, R., Stroupe, D., and Berland, L. (2018). Addressing the epistemic elephant in the room: Epistemic agency and the next generation science standards. Journal of Research in Science Teaching, 55(7), 1053-1075.
Muñoz-Leiva, F., Viedma-del-Jesús, M. I., Sánchez-Fernández, J., and López-Herrera, A. G.
(2012). An application of co-word analysis and bibliometric maps for detecting the most highlighting themes in the consumer behaviour research from a longitudinal perspective. Quality and Quantity, 46, 1077-1095.
Nandiyanto, A. B. D., Al Husaeni, D. N., and Al Husaeni, D. F. (2021). A bibliometric analysis of chemical engineering research using vosviewer and its correlation with covid-19 pandemic condition. Journal of Engineering Science and Technology, 16(6), 4414-4422.
Osborne, J. (2014). Teaching scientific practices: Meeting the challenge of change. Journal of Science Teacher Education, 25(2), 177-196.
Pradhan, P. (2017). Science mapping and visualization tools used in bibliometric and scientometric studies: An overview. Inflibnet, 23(4), 19-33.
Sadler, P. M., Sonnert, G., Coyle, H. P., Cook-Smith, N., and Miller, J. L. (2013). The influence of teachers’ knowledge on student learning in middle school physical science classrooms. American Educational Research Journal, 50(5), 1020-1049.
Soegoto, H., Soegoto, E. S., Luckyardi, S., and Rafdhi, A. A. (2022). A bibliometric analysis of management bioenergy research using vosviewer application. Indonesian Journal of Science and Technology, 7(1), 89-104.
DOI:https://doi.org/10.17509/ijert.v4i1.57213
Tan, E., Calabrese Barton, A., Kang, H., and O'Neill, T. (2013). Desiring a career in STEM‐related fields: How middle school girls articulate and negotiate identities‐in‐practice in science. Journal of Research in Science Teaching, 50(10), 1143-1179.
Tupan, T. (2016). Pemetaan bibliometrik dengan vosviewer terhadap perkembangan hasil penelitian bidang pertanian di Indonesia. Visi Pustaka: Buletin Jaringan Informasi Antar Perpustakaan, 18(3), 217-230.
Van Eck, N. J., and Waltman, L. (2017). Citation-based clustering of publications using CitNetExplorer and VOSviewer. Scientometrics, 111, 1053-1070.
Van Eck, N., and Waltman, L. (2010). Software survey: VOSviewer, a computer program for bibliometric mapping. Scientometrics, 84(2), 523-538.
Weintrop, D., Beheshti, E., Horn, M., Orton, K., Jona, K., Trouille, L., and Wilensky, U. (2016).
Defining computational thinking for mathematics and science classrooms. Journal of Science Education and Technology, 25, 127-147.