Group A patients reported that access to their medical records helped them understand their medical problems. Furthermore, patients in group A found some parts of the medical record difficult to understand.
Healthy and wellbeing activities’ promotion using
Diego Gachet Páez, Manuel de Buenaga Rodríguez, Enrique Puertas Sánz, María Teresa Villalba
Introduction
Although there are a large number of portable devices available on the market, the ways in which data is managed are not standard. Each manufacturer typically has its own cloud-based platform for storing and analyzing the information, which are also usually closed platforms.
Related work
The latest projects with a similar orientation, and previously in the framework of FP7, have a significant focus on the development of these types of solutions based on ICT to promote self-management of health and illness. Since COPD has the main cause of smoking or being exposed to smoke (between 20% and 25% of smokers develop the disease), in the systems that address a preventive approach, it can play an important role in facilities close to quit smoking.
Proposed architecture
To solve this problem, we are also leveraging “The Human API”11 initiative, which aims to integrate health data from many sensors and devices available on the market in a simple and convenient way for researchers. The reliability of the device has been tested in several studies16, which have shown that it is a valid device for measuring energy expenditure during physical activity.
Scenarios and use cases
As with other social networks, privacy settings must be well configured to maintain data privacy. The process begins with the registration of a new application, which is given a user API key and a secret.
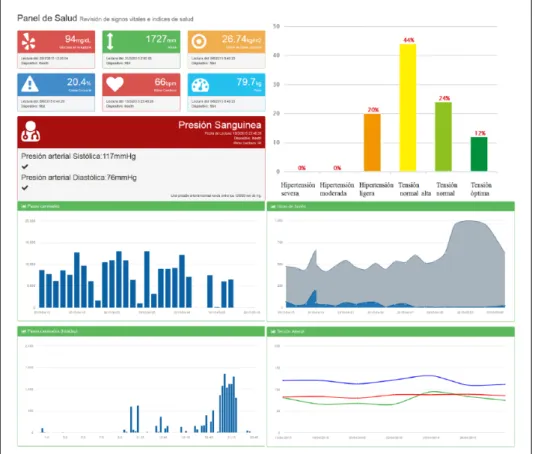
Preliminary results
The recommendation is based on the change in BP, physical exercise and weight values of the person. Suggestions for the best dietary changes that will improve health based on information gathered in this regard.
Conclusion and future work
Situación, necesidades y soluciones en la atención integral de la cronicidad y las adicciones, http://www.vodafone.es/static/fichero/pro_. Actividad física y salud, http://www.cdc.gov/physicalactivity/everyone/health/index.html (2014, consultado el 30 de mayo de 2015).
Electronic data capture on athletes’ pre-participation
David Karlsson and Toomas Timpka
Jenny Jacobsson
Juan-Manuel Alonso
Jan Kowalski
Sverker Nilsson
Frédéric Depiesse
Pedro Branco
Pascal Edouard
With this study, we wanted to identify factors that are key to the usefulness of electronic data collection in connection with championships in individual sports. During the 2013 European Athletics Indoor Championships, a qualitative analysis of the usability of an electronic data collection system for collecting data on athletes' pre-competition health and on in-competition injuries and illnesses from team doctors was conducted.
Results
They thought that the buttons would be more understandable due to non-technical or even graphic instructions adapted to the busy context of the athletics championships. They reported that it is similar to the systems they usually work with in their home country.
Discussion
Individual training sessions on system use would likely have prevented several of the human-computer interaction problems. However, the similarity between the accounts gathered from observed behavior and interviews suggests that the results can be considered credible.
Conclusion
A similar approach can be tried during championships in individual sports, that is, approaching team representatives first and asking them to communicate the purposes and procedures of the investigation to the athletes. The other main problem with reporting pre-participation injury and illness data identified by athletes was the construction of the query and terminology.
Emotional states recognition, implementing a low
Adrian Rodriguez Aguiñaga
Miguel Angel Lopez Ramirez
Some of the most outstanding work in emotion recognition through EEG signal analysis has been presented by Dr M Murugappan from Perlis University in Malaysia and by Dr Sander Koelstra at Queen Mary University of London in the UK. Dr Murugappan proposed a mathematical model to infer emotional states from EEG analysis and Dr Koelstra developed the DEAP database, which is an extensive collection of physiological signal records of emotional stimulation processes, and both works demonstrate the feasibility of establishing a relationship between the electrical activity in the cerebral cortex and emotional states.3–5 A summary of related work is presented in Table 1.
Emotions Disambiguation
Classical theories are supported by the Darwinian theory of emotions, which states that emotional reactions are innate patterns intended to guide behavior and promote adaptation,18,20,21 and more recent theories, which show that emotions are complex phenomena triggered by a central process. as a result of internal or external causes, which can be observed as a change in the organism.19,22–29. Antagonistic theories are led by Claparede's theory,14 which defines emotions as useless, maladaptive and harmful phenomena, since according to this theory, emotions are characterized by a sudden disturbance of the affective balance (mostly for short episodes), with slight or intense, simultaneous or later consequences on several organs, which can cause a partial or complete blockage of logical thinking in the affected subject.
Data sources
Over the centuries, philosophers, physicians and psychologists have studied affective phenomena by questioning their origins, their role in psychic life, their actions in favoring or hindering adaptation and their neuro-physiological concomitants;18 however as established by Scherer (Scherer (2005)) ) "even the simple question, of what are emotions?, hardly gets the same answer".19. It is the definition provided by Scherer (Scherer (2005)) that best fits an engineering task, who defines an emotion as: an episode of interrelated and synchronized changes in most of the organism's subsystems (note on call 4 and 5), in response to the evaluation of an external or internal stimulus event.
Data bounding methodology
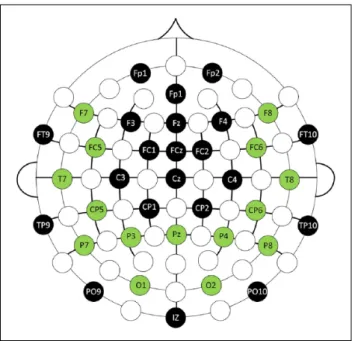
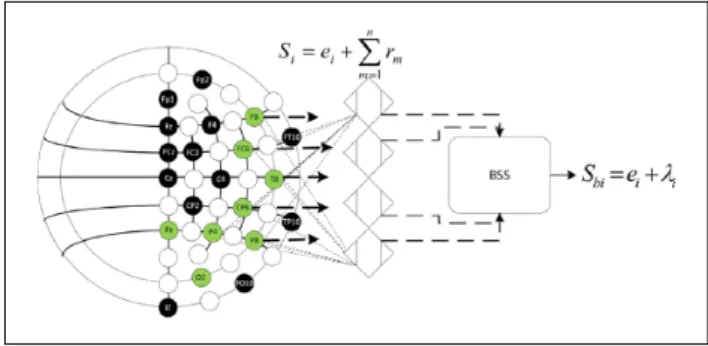
Signal conditioning
This is the database we implemented for the experimental process presented in this paper because it is, to the best of our knowledge, the most comprehensive and reliable data source. 1 is the sum of overlapping signals that occur when trying to read a particular electrode, and Sbi =ei+λi represents the information of a particular electrode without redundancy of active electrodes.
Feature extraction
Each level of the discrete wavelet transform is calculated by passing the signal through a set of filters; the samples pass through the low-pass filter g and simultaneously through the high-pass filter h, asix. The translation and dilation coefficients can be implemented directly as properties in the classification problem.
Classes
Identification process
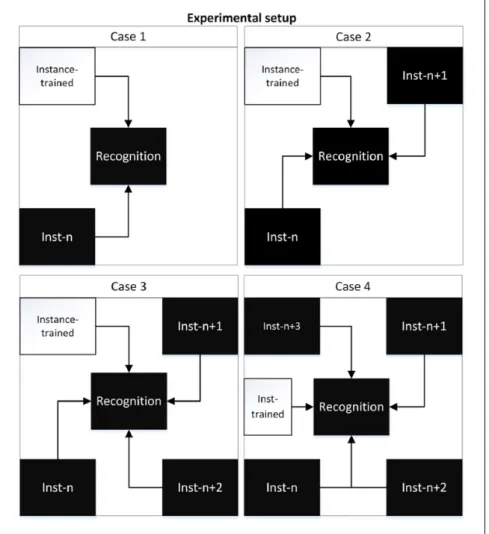
The experimental configuration presented in Figure 6 was designed to evaluate the identification performance of each of the combinations created by implementing the clustering algorithm 8.1, which ensures a consistent distribution of the experimental process for each of the class elements by considering at least one experimental class associated with each class ( ie each cross-validation evaluates different instances of the same class).xi.
Neural networks
An identification process performed by the same NN configuration but increasing by one the number of layers in each iteration up to 50. Considering only NNs with fewer than 20 hidden layers, the validation process selected the number of units per layer that this network would have from considering that 20 would be the maximum number of elements per layer.
Support vector machines
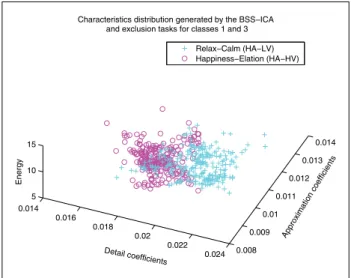
Results Separability
A separation between the coefficients associated with these classes can be easily observed, even before the classification and recognition processes (class 3: relaxation/calm, class 1: happiness/excitement). A clear separation between the coefficients associated with these classes can be easily understood even before the classification and recognition processes (class 3: relaxation/tranquility, class 4: boredom/sadness).
Conclusions
It is important to note that both filters are interrelated, due to the fact that outputs of the transformation process provide the detail (high pass filter) and approximation (low pass filter) coefficient implemented in the classification problem. In: Annual International Conference of the IEEE Engineering in Medicine and Biology Society, Minneapolis, MN, 3–6 September 2009, pp.1223–1226.
Effect of technology on aging perception
MA Rodrigo Juárez
Víctor M González
Jesús Favela
The perception of aging is a multidimensional construct that plays an important role in society, as it triggers different attitudes and behaviors towards older adults and affects their health and well-being. As a result, we need to understand the different dimensions of the relationship between older adults and technology, starting with basic aspects such as people getting used to the idea of older adults using technology.
Previous work
This is important for technology-based environmentally assisted living as it would mean that technology could provide a context and a range of tools to, on the one hand, improve the behavior of younger people towards older adults (which could improve interaction and inclusion with older people mean). the digital world) and on the other hand their own behavior to grow older successfully and healthily. In the second study, we sought to answer how technology influences the aging self-perception of a group of older adults, examining a series of technological paradigms as they were used by older participants over several weeks.
First study
Therefore, the adoption and use of technology can be used to mitigate or eliminate these biases to examine how older adults change their aging perception, as a whole, through technology. This can have positive effects such as improving physical and mental health, improving communication and socialization, removing negative stereotypes about older adults and technology and helping them maintain their independence.
Second study Methodology
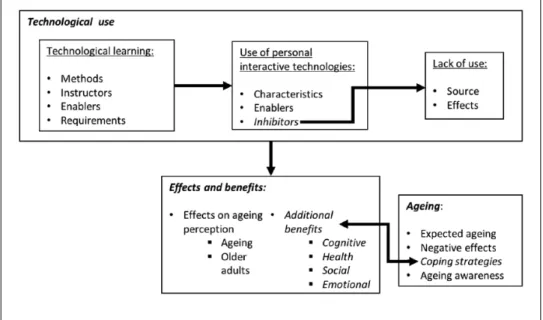
Older adults need a learning process to use new technological devices, as one participant illustrates. As a result of implementing these strategies, the older adults achieve a successful and healthy aging.
Assessing empathy and managing emotions through interactions with
Esperanza Johnson, Ramón Hervás and Carlos Gutiérrez López de la Franca
Tania Mondéjar
Sergio F Ochoa
All of these studies helped shape avatar design, as well as awareness of what had been done before with avatars in general. Compared to our work, previous researches did not pay special attention to the affective reaction of the avatar and the emphatic response of the user.
Design of the avatar-based interactions
Taxonomy of human–avatar interactions
Implicit interactions are related to involuntary elements of communication, that is, signals such as laughing, sweating, and body postures that can reveal the inner emotional state to others. Given the conceptual prototype described in the “Designing the avatar-based interactions” section, we used this taxonomy as a roadmap to develop our assistant avatar, which is described in the next section.
Avatar for recognizing and managing emotions
Taking into account the importance of empathy between users and the gender of the avatar,8 we designed an androgynous avatar. Accuracy in recognizing the user's avatar emotions (overall (top) and for the last 10 interactions (bottom)).
Screening diabetes mellitus 2
Angela Pimentel
Carreiro
Rogério T Ribeiro
Hugo Gamboa
In 2012, diabetes was the direct cause of 1.5 million deaths.1 The prevalence of diabetes is increasing in developed and developing countries and is projected to reach 7.7 percent worldwide by 2030.2. There is debate as to whether fasting glucose monitoring is sufficient or whether an oral glucose tolerance test is needed to detect asymptomatic diabetes.8 Measuring fasting or postprandial blood glucose is an invasive procedure as well as expensive. and it takes time.
Material and methods Diabetes dataset
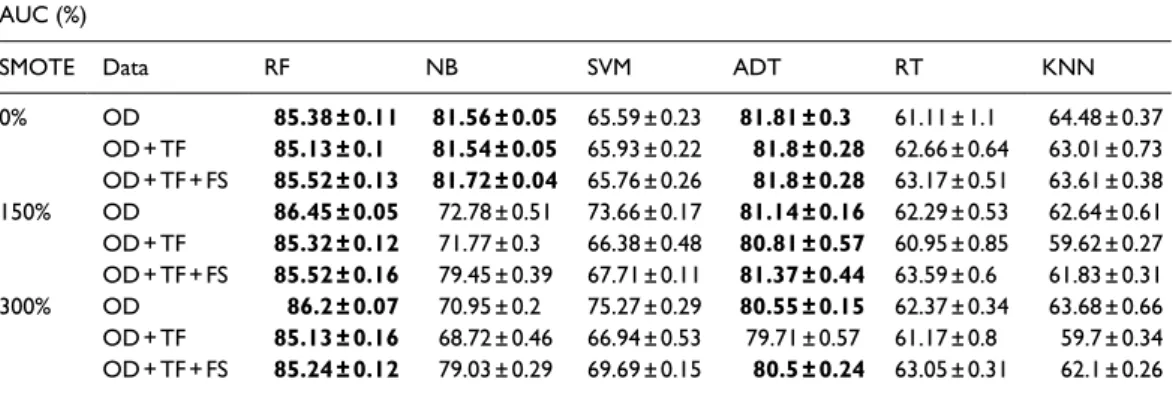
Given the large number of features used in this study (529), we performed a feature selection (FS) analysis to check whether some of the original features would be discarded as irrelevant for classification. Briefly, information gain is a measure of the decrease in entropy of a class variable after observing the property value.
Results and discussion
Still for the RF classifier, the sensitivity results are improved with the increasing SMOTE percentage. In conclusion, the simple theory, fast speed, stability and insensitivity to noise of the RF classifier make it suitable for the screening of T2DM using EHR.
Vital sign documentation in electronic records
The development of workarounds
Jean E Stevenson
Johan Israelsson
Gunilla Nilsson and Goran Petersson
Peter A Bath
The first of these was similar to the observation chart in the cardiology ward for frequent vital signs. This suggests that the chart in the EHR was not suitable for frequent documentation.
Barriers for recruitment of
Eva Broendum, Charlotte Suppli Ulrik,
Thorbjorn Gregersen, Ejvind Frausing Hansen, Allan Green and Thomas Ringbaek
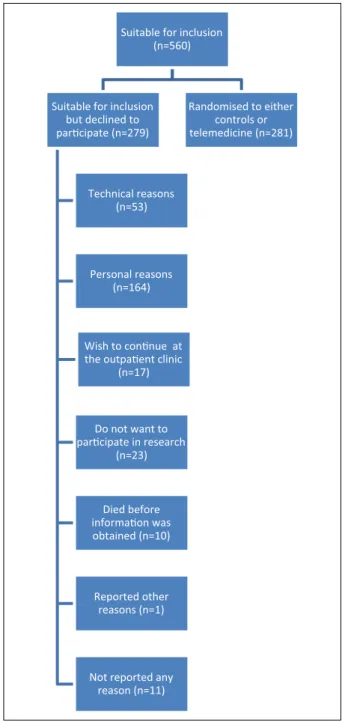
Despite mixed evidence of efficacy and cost-effectiveness, a political decision was made to implement TM in patients with COPD in Denmark. The aim of this study was to investigate the relationship between reasons given for refusal and the characteristics of the patients.
Materials and methods
Hospital admissions for COPD exacerbation in the year before enrollment in the trial, mean (range). Hospitalizations for COPD exacerbation in the year before enrollment in the trial.