64 |
J o u r n a l o f A d v a n c e d R e s e a r c h i n E c o n o m i c s a n d A d m i n i s t r a t i v e S c i e n c e s
https://bcsdjournals.com/index.php/jareas
Journal of Advanced Research in Economics and Administrative Sciences
ISSN 2708-9320 (Print) and 2709-0965 (Online)
Volume 3, Issue 2 Article 5
DOI: https://doi.org/10.47631/jareas.v3i2.479
SUSTAINABLE ECONOMIC DEVELOPMENT ROUTES IN SUB- SAHARA AFRICA: A DYNAMIC LONG-RUN RELATIONSHIP ANALYSIS OF FISCAL POLICY, ENERGY CONSUMPTION AND
CARBON DIOXIDE EMISSIONS
Stephen Ansah1, Zheng Xungang1*, Emmanuel Agyapong Wiafe2, Gideon Ntim-Amo1
1Sichuan Agricultural University, College of Management 611130, 211 Huimin Road, Chengdu, China
2Ghana Institute of Management and Public Administration, Takoradi, Ghana
ARTICLE INFO
Recieved: 30 March 2022 Revised: 20 May 2022 Accepted: 24 May 2022
Keywords:
Fiscal Policy Energy Consumption CO2 Emissions
Cross-Sectional Augmented Autoregressive Distributed Lag Common Correlated Effect Mean Group
JEL: G32, H21, C33, O54, G30
Corresponding Author:
Zheng Xungang
Email: [email protected] Copyright © 2021 by author(s).
This work is licensed under the Creative Commons Attribution International License (CC BY 4.0).
http://creativecommons.org/licenses/
by/4.0/
Access Open
ABSTRACT
Purpose: This study investigates the relationship between fiscal policy, energy consumption, and carbon dioxide emissions in the sub-Saharan African region.
Approach/Methodology/Design: The cross-sectional autoregressive distributed lag, common correlated effect means group, and the augmented mean group were used to analyze the long-run effect of fiscal policy, and energy consumption on carbon dioxide emissions for the period 1990–2018.
Findings: The findings of this study indicate that expansionary fiscal policy drives carbon dioxide emissions, while contractionary fiscal policy mitigates carbon dioxide emissions for the sub-Sahara African region. The study's findings also indicate that an increase in renewable energy consumption help reduce carbon dioxide emissions, while non-renewable energy consumption causes carbon emissions to rise. Similar results were obtained for the various income- based economies except upper-middle-income economies that recorded insignificant long-run effect of fiscal policy, renewable energy and non- renewable energy consumption on carbon emissions.
Practical Implications: The significant role of expansionary and contractionary fiscal policies established from this study’s results indicate the possibility of economic managers of various nations to promote sustainable development through fiscal policy implementations. Thus, governments of various economies could use fiscal policy especially expenditure as a tool to ensure sustainable development.
Originality/value: This study innovates by employing econometric tools that deal with the problem of cross-sectional dependence that may exist among the study variables. This study innovatively considers the income levels of the selected countries to ascertain the role of income levels in the dynamic relationships between fiscal policy and carbon emissions, which is novel in this area of study within the Sub-Saharan African region.
INTRODUCTION
One of the biggest challenges that continue to confront countries across the globe in their effort to achieve economic growth and development is the issue of global warming, resulting from the emission of undesirable output into the environment (World Meteorological Organization,
65 |
J o u r n a l o f A d v a n c e d R e s e a r c h i n E c o n o m i c s a n d A d m i n i s t r a t i v e S c i e n c e s
https://bcsdjournals.com/index.php/jareas
2019). The past decade has been reported as the warmest decade, with 2017 recording the highest temperature (World Meteorological Organization, 2019). This situation has shifted the focus of countries from the conventional development agenda to a sustainable development plan, prioritizing sustainable long-term growth over short-term growth by considering the safety and quality of the environment to achieve economic growth. According to a 2010 report of the World Bank, one of the elements identified as a critical contributor to climate change is the increased concentration of Greenhouse Gases (GHG), of which carbon dioxide (CO2) emissions account for more than 75%.
Driven by higher energy demand in 2018, global energy-related CO2 emissions rose from 1.7% to a historic high of 33.1 Gt CO2. While emissions from all fossil fuels increased, the power sector accounted for nearly two-thirds of emissions growth. Coal use in power alone surpassed 10 Gt CO2, mostly in Asia, and the United States accounted for 85% of the net increase in emissions, while emissions declined for Germany, Japan, Mexico, France, and the United Kingdom. Academically, carbon dioxide, among other determinants, has been theoretically and empirically proven to threaten environmental quality (Adedoyin et al., 2020).
Existing literature reveals that energy consumption and economic growth are the most significant contributors to increased GHG emissions. Economic growth is critical for poverty alleviation and improvement in Africa's quality of life and cannot be compromised for any other thing. The continent has, in recent years, experienced improving macro-economic trends.
Over the past decade, Africa has recorded some of the fastest-growing economies globally, which has seen the sub-Saharan African region recording an average growth of more than 3 percent until the emergence of the COVD-19 Pandemic (O'Neill, 2021). Considering the discoveries of existing literature, economic growth and development in the sub-Saharan African region have the potential to increase the emissions of GHG, particularly carbon dioxide emissions. According to the 2016 report of the World Health Organization, countries such as Ghana, South Africa, Nigeria, Cameroon, Uganda, Mauritius, and Madagascar within the sub-Saharan Africa region have been identified as the developing countries with high carbon dioxide emissions, as well as other pollutants, which are responsible for severe biological damage. The World Health Organization also reports that close to half a million sub- Saharan Africans die due to air pollution every year.
The use of fossil fuels (coal, gas, and oil) by emerging economies within the Sub-Saharan Africa region to attain economic growth continues to increase despite several challenges emanating from its massive use (Hanif, 2018). Even though economic growth has been accelerated by the consumption of energy, at the same time, the environment has been adversely affected by the generated residues from the combustion of fossil fuels across the whole sub-Saharan African region (Halicioglu, 2011). According to Bekhet and Harun (2012), Poverty eradication, food insecurity, and economic growth are the most desirable relative to environmental quality among emerging economies hence their reluctance to halt the consumption of cheap energy resources, which has dire consequences on the environment.
Recent literature (Katircioglu & Katircioglu, 2018; Chishti et al., 2021) has identified governments' fiscal policy implementation as a possible significant contributor to the increased environmental pollution through expansionary fiscal policy. Fiscal policy implementation involves the use of government expenditure and taxes to control inflation, and the amount of money within an economy has the potential to increase and decrease production and subsequently increase or reduce the emission of dangerous gases into the environment.
Empirical evidence to theoretical assertions on specific subjects is key to the planning and implementing policies within every economy. Several empirical studies (Ahmad et al., 2020;
Ahmad et al., 2018; Álvarez-Herránz et al., 2017; Arminen & Menegaki, 2019; Chishti et al.,
66 |
J o u r n a l o f A d v a n c e d R e s e a r c h i n E c o n o m i c s a n d A d m i n i s t r a t i v e S c i e n c e s
https://bcsdjournals.com/index.php/jareas
2020; Khan et al., 2020; Khattak et al., 2020; Rauf et al., 2020; Rehman et al., 2019; Ullah et al., 2020; Yuelan et al., 2019; Zambrano-Monserrate et al., 2018; Zoundi, 2017) to validate the various theoretical arguments on the causal relationships among economic growth, energy consumption, and carbon dioxide emissions across the globe have been conducted. However, very few of these studies (Katircioglu & Katircioglu, 2018; Yuelan et al., 2019; Zhang et al., 2017) have considered the role of fiscal policy in the emissions of carbon dioxide into the environment of which none has been carried out in the context of the sub-Saharan African region. Thus, this current study is the first of its kind in the context of the sub-Saharan African region.
Furthermore, most of the studies employed techniques such as panel cointegration, panel causality, Panel vector autoregressive, Granger causality, Autoregressive distributed lags (ARDL), among others, which cannot deal with the problem of cross-sectional dependence that is likely to exist in a panel data. Using econometric methods that do not consider cross- sectional dependence among variables could result in misleading findings (Breitung & Das, 2005). This study assesses the robust long-run relationship between fiscal policy, energy consumption, and carbon dioxide emissions by applying the cross-sectional augmented autoregressive distributed (CS-ARDL), the common correlated effect means group (CCEMG), and the augmented mean group (AMG). These econometric techniques deal with the problem of cross-sectional dependence for 17 sub-Saharan African countries from 1990 to 2018. Also, none of the studies on fiscal policy, energy consumption, and carbon dioxide emission considered the contributory role of income level differences in the dynamic relationships among the variables. The present study innovatively considers the income levels of the selected countries to ascertain the role of income levels in the dynamic relationships between the variables, which is novel in this area of study within the Sub-Saharan African region. This study is expected to provide scholars and policy makers a multidimensional view of the direction of causal relationships and the long-run impact of the variables, which will inform policy and enhance general economic management practice.
Sustainable Economic Development Situation in Sub-Sahara Africa
The development of Sub-Saharan African (SSA) countries is at a crucial stage, considering the rapid population growth being experienced, especially in urban areas, and the youthful growing workforce. Furthermore, several Sub-Saharan African countries are also experiencing high levels of economic growth, whose benefits are distributed disproportionately among most citizens. In addition to these challenges, the food production system of the region is faced with threats of global climate change and the intense frequency of droughts, floods, and fires, capable of reversing the gains made in development and poverty reduction by the region or is expected to achieve in the coming years (Hogarth et al., 2015). Though the contribution of the sub-Saharan African region to per capita levels of greenhouse gas (GHG) emissions is comparatively low, the increasing danger of disastrous climate change across the globe provides the basis for an urgent paradigm shift from high-emission models of economic growth by all countries. Thus, as the sub-region continues to tackle its array of related developmental challenges, countries also need to consider the sustainability of the environment in which the developmental activities occur.
The sub-Saharan African region experienced an average Gross Domestic Product per capita growth of 3.5% between 2010 and 2021, excluding 2020, which recorded an economic recession due to the global pandemic (COVID-19) (World Bank, 2022). Notwithstanding this growth, the economies of the sub-Saharan African region remain relatively small. As of the year 2019 (pre-COVID-19 era), the gross domestic product (GDP) of the whole sub-region stood at $4.3 trillion, four times less than that of the United States (20.6 trillion), whose
67 |
J o u r n a l o f A d v a n c e d R e s e a r c h i n E c o n o m i c s a n d A d m i n i s t r a t i v e S c i e n c e s
https://bcsdjournals.com/index.php/jareas
population is three times less than that of SSA (World Bank, 2022). According to the Intergovernmental Panel on Climate Change (2013), It is almost generally agreed that the way forward to reducing global warming to 2ºC, an attempt to avert catastrophic climate change is to ensure that the atmospheric concentration of GHG does not surpass 450 ppm CO2e5. The attainment of this objective, subject to a world projected to support 9.2 billion people by 2050, requires an annual average per capita emissions convergence of 2.1 to 2.6 tonnes of CO2e by mid-century. Despite sub-Saharan Africa's per capita emission level being the lowest globally, it is a little above the desired level, standing at 2.7 or 3.9 tonnes of CO2e, depending on whether land-use change and forestry are taken into account.
As much as industrialized economies are obliged to lead the mitigation process of reducing GHG emissions considering their historic heavy contributions to global warming, a drastic reduction of emissions by emerging economies will be enough to achieve the target set. Thus the need for regions such as sub-Sahara Africa to ensure a decline in their GHG emissions in the long-term cannot be overemphasized (Hogarth et al., 2015). This climatological constraint does not support the conventional trend of doing things, which contributes to the rapid increase in the GHG emissions of the region due to population growth, increased fossil fuel consumption and production, growth in cattle production, and deforestation (FAO, 2015; IEA, 2014). Mostly, greenhouse gas emissions in sub-Sahara Africa are not linked to fossil fuel due to limited industrialization in the region; instead, emissions in the region are associated with agriculture and increased land-use change. However, GHG emissions in the region are expected to increase rapidly due to the projected population and economic growth, which is expected to cause the use of fossil fuel and extraction (IEA, 2019).
Hogarth et al. (2015) explained that sub-Sahara Africa faces the risk of being locked into a path of increased fossil fuel supply through cheap fossil fuel supply from domestic production, development of fossil fuel-intensive infrastructure, such as coal-fired power plants, and heavy manufacturing industries. According to Hogarth et al. (2015), the region would experience high carbon energy use and significant future GHG emissions, especially for electricity generation and transport, due to this “lock-in.” Oil demand in sub-Sahara Africa is projected by the New Policy Scenario of IEA to increase from 147 to 251 Mtoe and contribute 19% of total energy demand in 2040.
The Construction Industry Council asserts that GHG emissions from the production of construction materials can account for close to 25% of a building's lifetime carbon footprint.
The use of low-carbon construction materials thus plays a significant role in reducing GHG emissions in the construction sector. In sub-Sahara Africa, the primary source of GHG emissions from the construction sector is the energy required to operate buildings, lighting, and heating. The manufacturing sector of most sub-Sahara African countries is small and stagnant (Hogarth et al., 2015). Sub-Sahara Africa’s share of manufacturing value-added in the total GDP has declined for nearly four decades from 18% in 1975 and 15% in 1981 to 10.94% in 2019 (albeit with variation in experiences across African countries. Nonetheless, the manufacturing production of sub-Sahara Africa has over tripled, increasing from nearly $54.17 billion in 2000 to approximately $194.03 billion in 2019 (in constant 2010 prices). Despite the sparse data on emissions for Sub-Sahara Africa, A climate analysis indicator from World Resource Institute (WRI) shows that GHG emissions from industrial processes and energy use by the manufacturing sector contribute only 1% of global GHG emissions(WRI, 2014).
Projections from IPCC indicate that contribution from sub-Sahara Africa to global manufacturing GHG emissions will increase but remain dwarfed by emissions from developing Asia.
68 |
J o u r n a l o f A d v a n c e d R e s e a r c h i n E c o n o m i c s a n d A d m i n i s t r a t i v e S c i e n c e s
https://bcsdjournals.com/index.php/jareas
The majority of the population in sub-Saharan Africa survive by employment in agriculture.
About 80% of the farmers in the sub-region are smallholder farmers, thus most farmers in the sub-region cultivate less than two hectares in area (Livingston, Schonberger & Delaney, 2011).
70% of the African continent’s food supply is provided by small farms provide (IAASTD, 2016). In the sub-Saharan African region, agriculture is the largest contributor to GHG emissions. Among the largest sources of emissions in the sub-region are encroachments of pasture and cropland into forested areas, livestock manure and digestive processes, burning of savannah; and cropland management and cultivation practices. A projection by the Food and Agriculture Organization (2015), indicates that direct agricultural emissions in sub-Saharan Africa will rise by a third between 2012 and 2050, from 600 million to 800 million tCO2e, which is twice that of the European Union’s agricultural emissions in 2012 (407 million tCO2e) and almost as high as those of China (832 million tCO2e), which in 2012 had the highest level of agricultural emissions of any country (WRI, 2015).
LITERATURE REVIEW Income and Carbon Dioxide Emissions Nexus
The Environmental Kuznets Curve hypothesis (EKC) has been employed by a significant number of studies (Acaravci & Ozturk, 2010; Gorus & Aydin, 2019; Grossman & Krueger, 1991; Hassan et al., 2020) to examine the income and environmental pollution nexus for economies across the globe. As explained in previous sections of this chapter, the EKC hypothesis states that environmental pollution rises to a particular threshold as income (per- capita) rises and finally assumes a downward movement. Thus, excessive demand emanates due to increased income and puts pressure on firms to expand production. The situation results in the acquisition and use of large amounts of fossil fuels, which subsequently causes carbon emissions to rise. Several prior studies (Apergis & Payne, 2017; Neequaye & Oladi, 2015; Rehman et al., 2019; Sapkota & Bastola, 2017; Sinha & Shahbaz, 2018; Zambrano- Monserrate et al., 2018) have confirmed the EKC for several economies. Nonetheless, some other studies did not confirm the EKC hypothesis for selected middle-income economies (Arminen & Menegaki, 2019), selected African economies (Zoundi, 2017), 22 Latin America and Caribbean economies (Pablo-Romero & De Jesús, 2016), and OECD & Non-OECD economies (Özokcu & Özdemir, 2017). Income is mostly proxied with the gross domestic product per capita, signifying its critical role in sustainable development studies. Thus, including gross domestic product per capita in this study’s model cannot be overemphasized.
Energy Consumption and Carbon Dioxide Emissions Nexus
Several studies have warned of the dire consequences of the production and combustion of energy on the environment, notwithstanding its substantial contribution to economic growth (Rehman & Rashid, 2017). This has been validated by several empirical studies (Ahmad &
Zhao, 2018; Álvarez-Herránz et al., 2017; Arminen & Menegaki, 2019; Bhuiyan et al., 2018;
Khattak et al., 2020; Mirza & Kanwal, 2017; Rehman & Rashid, 2017; Zaman & Abd-el Moemen, 2017). However, the inclusion of energy consumption as a single variable in the EKC model may yield biased results (Jaforullah & King, 2017), considering that the energy consumption consists of non-renewable (fossil fuel) and renewable energy sources.
According to Arminen and Menegaki (2019), fossil fuel consumption as a regressor in a model yields robust findings. A significant number of studies have expressly confirmed the negative effect of non-renewable energy (fossil fuel consumption) on the environment (Bhattacharya et al., 2017; Chishti et al., 2021; Ikram et al., 2020; Waheed et al., 2018).
Several studies have also validated the significant influence of renewable energy consumption in mitigating dangerous gas emissions into the environment. The energy
69 |
J o u r n a l o f A d v a n c e d R e s e a r c h i n E c o n o m i c s a n d A d m i n i s t r a t i v e S c i e n c e s
https://bcsdjournals.com/index.php/jareas
consumption variable in this study disintegrated into non-renewable (fossil fuel consumption) and renewable energy consumption in the model to obtain more robust results.
Industrialization and Carbon Dioxide Emissions Nexus
The term industrialization refers to the growth in industrial activities. Most researchers assume that industrialization causes increased energy consumption due to higher value-added manufacturing consumption of more energy than conventional agriculture or basic manufacturing (Sadorsky, 2014). An investigation into the impact of the industrialization-led economy on environmental sustainability in developing countries by Li and Lin (2015) using the Kaya Identity framework for the period 1980–2011 revealed that industrial value-added of an economy adversely and significantly affects the relationship with CO2 emissions.
Another study by Raheem and Ogebe (2017) on the effect of urbanization and industrial value on carbon dioxide emissions in 20 African states from 1980-to 2013 also confirmed the significant contribution of industrialization and urbanization on carbon dioxide emissions.
The study further revealed that at a certain point indirect effect of industrialization would swarm the direct negative impact of industrialization and urbanization, leading to a reduction of environmental degradation
Fiscal Policy and Carbon Dioxide Emissions Nexus
The contributions of specific sectors of an economy in the traditional EKC remain relevant and require further attention. Though several studies have investigated the financial sector's contribution to the EKC, researchers mostly use financial aggregates such as money supply, one of the monetary policy tools. Those finance-EKC nexus studies argue that economic growth and energy consumption are likely to be influenced by monetary policy and consequently spur climate change proxy by carbon dioxide emissions (Jalil & Feridun, 2011;
Kaushal & Pathak, 2015). Fiscal policy is also one of the macroeconomic policy tools used by managers of economies; thus, a similar argument could be made for the role of fiscal policy in environmental issues, considering its significant contribution to economic growth and energy consumption.
In a more concise explanation, it would be interesting to investigate the role of fiscal policy and fiscal aggregates to the EKC in the energy economics literature. Fiscal policy uses government spending and taxation as its major instruments or tools, which are likely to play a role in economic growth, current account balances, energy policy, and energy consumption, therefore, in the EKC (Bolat et al., 2014). Considering that fiscal policy is a significant determinant of income growth, the interaction between fiscal policy and economic growth is highly expected to influence energy consumption; thus, not only will energy demand increase, but also environmental issues will be heightened in the economy. According to Balcilar et al. (2016), the rate of capital accumulation is likely to increase following a decrease in fiscal deficits through increased revenue generation, leading to a higher rate of economic growth. Based on the argument of Balcilar et al. (2016), it could also be argued that increased fiscal deficit through increased government expenditure which spurs economic activity, could cause energy demand and consumption and thus lead to the emission of dangerous gases into the environment. Some scholars (Dongyan, 2009; Liu et al., 2017) argue that fiscal incentives support energy efficiency and hence play a significant role in reducing carbon emissions.
According to Fischer and Fox (2012), countries' climate policies need to be well balanced with the aggregate fiscal policies of governments. Fischer and Fox (2012) also explained that public sector revenues play an important role in climate policy-making. Quite a number of studies have been carried out on the effect of general, and carbon taxation and conclusions
70 |
J o u r n a l o f A d v a n c e d R e s e a r c h i n E c o n o m i c s a n d A d m i n i s t r a t i v e S c i e n c e s
https://bcsdjournals.com/index.php/jareas
are of mixed findings; nonetheless, generally, it is found that taxation is effective for environmental policies (Vera & Sauma, 2015). A study by Ryan et al. (2009) revealed that taxes significantly impact energy consumption and CO2 emissions. Thus, the scanty literature on fiscal policy indicates that fiscal policy plays a significant role in energy consumption and, consequently, environmental quality. A review of the available literature shows that none of the empirical studies conducted in the fiscal policy-emissions nexus considered the government expenditure tool of fiscal policy. This current study thus proxies government expenditure as the fiscal policy to assess the mechanism through which it exacerbates or ameliorates carbon dioxide emissions within the Saharan African context.
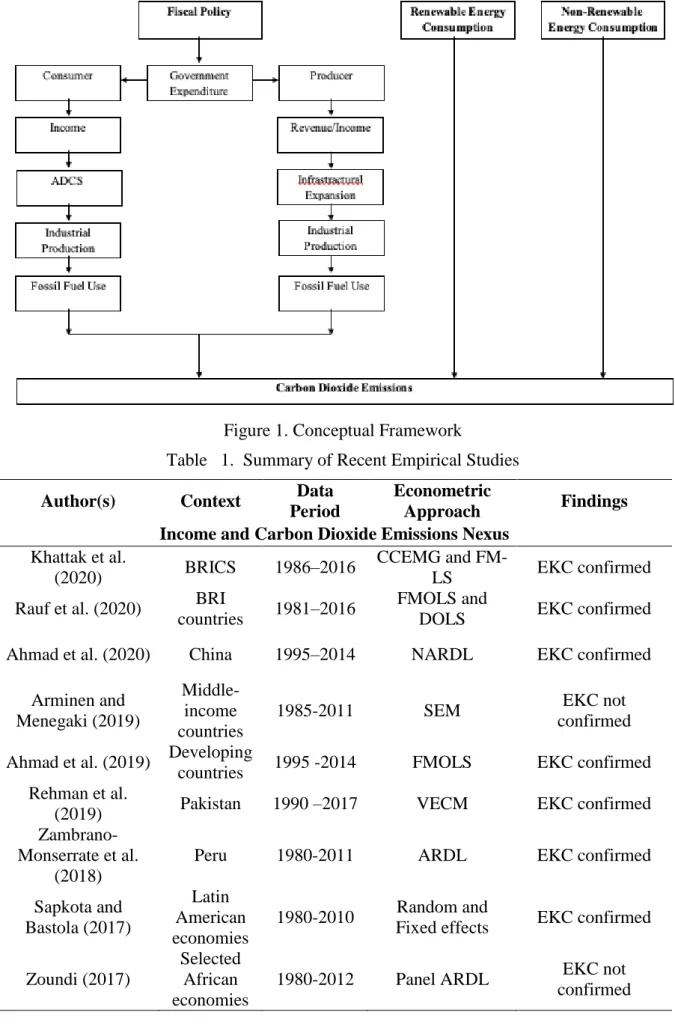
Conceptual Framework
As explained in earlier sections, one of the fiscal policy tools used to control the money in an economy is government expenditure. Variations in government expenditures cause significant changes in several economic activities (aggregate consumption, aggregate production, financial development, foreign direct investment, international trade, and economic growth).
Considering that these activities contribute significantly to the emission of dangerous gases such as carbon dioxide (CO2e), fiscal policy is thus a key tool for the mitigation and promotion of CO2e. The government’s expenditure level could be used to achieve two main objectives (i.e., expansionary and contractionary objectives).
For the expansionary fiscal policy, the government seeks to use its expenditure or tax to increase the amount of money in an economy. The government does this by increasing its expenditure and cutting down on taxes, which increases the disposable income of consumers, hence increasing purchasing power of consumers. A rise in the purchasing power of consumers leads to an increased aggregate domestic consumption spending per capita. This serves as an incentive to producers to increase production, which involves using more fossil fuels, increasing CO2e. On another hand the increased expenditure of the government directly causes an increase in production and construction activities such as roads and other huge public infrastructures which also involves the burning of fossil fuels due to reliance on cheaper and dirty technologies, thus increasing the emission of dangerous gases into the environment. In summary, an increased government expenditure through expansionary fiscal policy increases carbon dioxide emissions.
The contractionary fiscal policy, on the other hand, refers to the situation where the government seeks to reduce the amount of money in an economy. The government pursues this policy through the reduction of its expenditure and increased taxes, which in effect serves as a disincentive for producers to produce due to a reduction in aggregate domestic consumption spending per capita. Thus the disposable income of consumers falls as a result of the reduction in government expenditure. Production and construction of public infrastructure directly fall as government reduces its expenditure, thus causing the combustion of fossil fuels from cheap technologies used by producers and contractors to rreduce. This subsequently causes the emission of dangerous gases such as carbon dioxide to fall as well. Thus, the contractionary fiscal policy reduces CO2e.
71 |
J o u r n a l o f A d v a n c e d R e s e a r c h i n E c o n o m i c s a n d A d m i n i s t r a t i v e S c i e n c e s
https://bcsdjournals.com/index.php/jareas Figure 1. Conceptual Framework
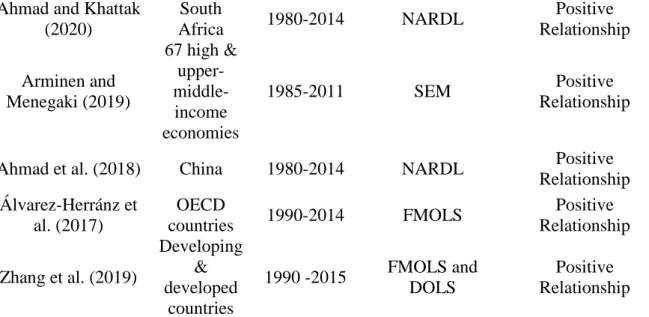
Table 1. Summary of Recent Empirical Studies Author(s) Context Data
Period
Econometric
Approach Findings Income and Carbon Dioxide Emissions Nexus
Khattak et al.
(2020) BRICS 1986–2016 CCEMG and FM-
LS EKC confirmed
Rauf et al. (2020) BRI
countries 1981–2016 FMOLS and
DOLS EKC confirmed
Ahmad et al. (2020) China 1995–2014 NARDL EKC confirmed Arminen and
Menegaki (2019)
Middle- income countries
1985-2011 SEM EKC not
confirmed Ahmad et al. (2019) Developing
countries 1995 -2014 FMOLS EKC confirmed Rehman et al.
(2019) Pakistan 1990 –2017 VECM EKC confirmed
Zambrano- Monserrate et al.
(2018)
Peru 1980-2011 ARDL EKC confirmed
Sapkota and Bastola (2017)
Latin American economies
1980-2010 Random and
Fixed effects EKC confirmed Zoundi (2017)
Selected African economies
1980-2012 Panel ARDL EKC not
confirmed
72 |
J o u r n a l o f A d v a n c e d R e s e a r c h i n E c o n o m i c s a n d A d m i n i s t r a t i v e S c i e n c e s
https://bcsdjournals.com/index.php/jareas
Non-Renewable Energy Consumption (Fossil Fuel Consumption) and Carbon Dioxide Emissions Nexus
Ahmad and Khattak (2020)
South
Africa 1980-2014 NARDL Positive
Relationship Arminen and
Menegaki (2019)
67 high &
upper- middle- income economies
1985-2011 SEM Positive
Relationship
Ahmad et al. (2018) China 1980-2014 NARDL Positive
Relationship Álvarez-Herránz et
al. (2017)
OECD
countries 1990-2014 FMOLS Positive
Relationship Zhang et al. (2019)
Developing
&
developed countries
1990 -2015 FMOLS and DOLS
Positive Relationship ARDL - Autoregressive Distributed Lag; BRICS - Brazil, Russia, India, China, & South Africa; BRI - belt and road initiative; CCE - Common Correlated Effects; CCEMG, correlated effects mean group;
DOLS, dynamic ordinary least squares; AGM - Average mean group; GMM - General Method of Moment; VECM - Vector error correction model; SEM - Simultaneous equation model; NARDL - Non-linear ARDL; FMOLS - Fully-modified ordinary least-square; DOLS - Dynamic OLS.
Table 2. Summary of Recent Empirical Studies
Author(s) Context Year Econometric Approach Findings Renewable Energy Consumption and Carbon Dioxide Emissions Nexus Ullah et al. (2020) Pakistan 1980-
2018 NARDL Negative
Relationship Chishti et al. (2020)
South Asian region
1980-
2018 NARDL Negative
Relationship Ikram et al. (2020) SAARC 2000-
2014 G-TOPSIS Negative
Relationship Ben Jebli and Ben
Youssef (2017) Tunisia 1980-
2011 ARDL Negative
Relationship Industrialization and Carbon Dioxide Emissions Nexus
Li and Lin (2015) 73 countries
1971–
2010 DPTRM Positive
Relationship Raheem and Ogebe
(2017)
20 African countries
1980–
2013 PMG Positive
Relationship Sadorsky (2014) MSCI
countries
1971–
2008 ARDL Positive
Relationship Fiscal Policy and Carbon Dioxide Emissions Nexus
Katircioglu and
Katircioglu (2018) Turkey 1960-
2013 ARDL Negative
Relationship Chishti et al. (2021) BRICS
Economies
1985-
2014 ARDL, FMOLS, DOLS
Positive Relationship
(EFP &
73 |
J o u r n a l o f A d v a n c e d R e s e a r c h i n E c o n o m i c s a n d A d m i n i s t r a t i v e S c i e n c e s
https://bcsdjournals.com/index.php/jareas
CO2e Negative Relationship
(CFP &
CO2e Note: ARDL - Autoregressive Distributed Lag; BRI - belt and road initiative; BRICS - Brazil, Russia, India, China, & South Africa; CCEMG, correlated effects mean group; DOLS, dynamic ordinary least squares; CCE - Common Correlated Effects; SEM - Simultaneous equation model; NARDL - Non- linear ARDL; FMOLS - Fully-modified ordinary least-square; DOLS - Dynamic OLS; DPTRM- Dynamic Panel Threshold Regression Model; MENA, Middle East and North Africa; OECD, Organization for Economic Co-operation and Development; OLS, ordinary least squares; PMG, pooled mean group.
METHODOLOGY AND PROCEDURES Data Sources and Variables
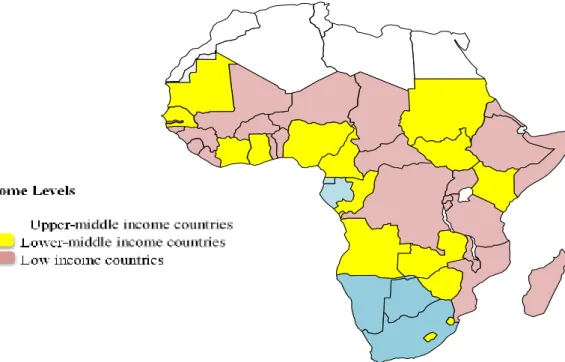
This study used a panel dataset of 17 countries from the sub-Saharan African region for the period of 1990-2018, providing a total of 493 observations. Considerably, the sample is relatively larger in terms of countries and the length of period for similar studies conducted in the sub-region. The 17 countries were classified into three different income groups in line with the World Bank’s Atlas method, which uses the per capita gross national income (GNI).
These groups serves as sub-panels for detailed analysis. According to the method, countries whose GNI are less than $1045, are considered to be low income countries, while countries whose GNI range between $1046-$4125, $4126–12736, and more than $12,736 are considered to be lower-middle, upper-middle and high-income countries respectively. This study considers the first three groups only because no country within the sub-Saharan African region falls in the high-income group. The low-income sub-panel consists of 5 countries, while the lower-middle and upper-middle-income sub-panels consist of 8 countries and 4 countries respectively. The geographic distribution of the income-based country groups that form the subpanels is shown in Figure 3.
Figure 2. Distribution of the income-based country groups included in the analysis
74 |
J o u r n a l o f A d v a n c e d R e s e a r c h i n E c o n o m i c s a n d A d m i n i s t r a t i v e S c i e n c e s
https://bcsdjournals.com/index.php/jareas
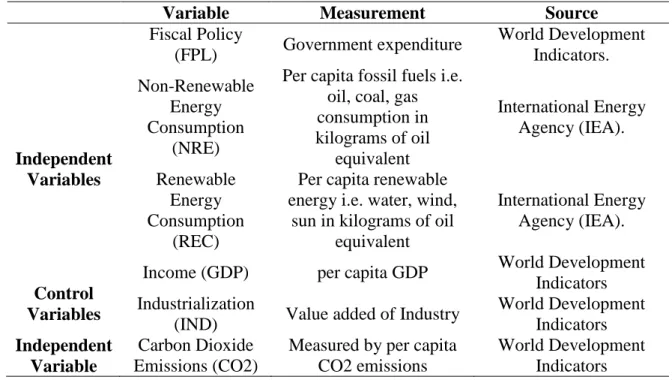
Data on the various variables which include fiscal policy (measured by the total government expenditure of a country), non-renewable energy consumption (measured by per capita fossil fuels i.e. oil, coal, gas consumption in kilograms of oil equivalent), renewable energy consumption (measured by the annual consumption of per capita renewable energy i.e. water, wind, sun in kilograms of oil equivalent), income (measured by the per capita GDP of a country), industrialization (measured by value-added of industry of a country)and CO2 emissions (measured by per capita CO2 emissions) were collected from the World Development Indicators published by the World Bank, the U.S. Energy Information Administration (EIA), and the International Energy Agency (IEA). Information on the variables used in this study are summarised in the table below.
Table 4. Summary of Study Variables
Variable Measurement Source
Independent Variables
Fiscal Policy
(FPL) Government expenditure World Development Indicators.
Non-Renewable Energy Consumption
(NRE)
Per capita fossil fuels i.e.
oil, coal, gas consumption in kilograms of oil
equivalent
International Energy Agency (IEA).
Renewable Energy Consumption
(REC)
Per capita renewable energy i.e. water, wind,
sun in kilograms of oil equivalent
International Energy Agency (IEA).
Control Variables
Income (GDP) per capita GDP World Development Indicators Industrialization
(IND) Value added of Industry World Development Indicators Independent
Variable
Carbon Dioxide Emissions (CO2)
Measured by per capita CO2 emissions
World Development Indicators Source: Author’s Compilation, 2022
Model Specification
The model specification of this present study is hinged on the Cobb-Douglas production function used in the work of Benchimol (2015). The Cobb-Douglas production function employed by Benchimol (2015) in his study expresses the relationship between capital, labour inputs, real cash balance, and output. The function is presented as
𝑌𝑡 = 𝐴𝐾𝑡𝛼𝐿𝛼𝑡[𝑅𝐶𝐵𝑡]𝛾…… ………. (1)
In the above function, the final output is represented by 𝑌𝑡, 𝐴 is Solow’s residuals, 𝐾𝑡 is the capital inputs, 𝐿𝑡 is the labor inputs, while 𝑅𝐶𝐵𝑡 is the real cash balance. Firms are expected to keep money for capital purchases induced by production activities hence the introduction of real cash balance into the production function (Fischer, 1974). The elasticity of the final output of the production process in response to changes in capital, labour, and the real cash balance is given as 𝛼, 𝛽, and 𝛾. The changes in, 𝛽, and 𝛾 g can be shown with laws of returns to scale (LRS). Multiplying the inputs in equation (1 ) above by a factor z will yield the equation below
ℎ𝑌𝑡 = 𝐴(𝑧𝐾)𝛼(𝑧𝐿)𝛽(𝑧𝑅𝐶𝐵)𝛾………. (2)
75 |
J o u r n a l o f A d v a n c e d R e s e a r c h i n E c o n o m i c s a n d A d m i n i s t r a t i v e S c i e n c e s
https://bcsdjournals.com/index.php/jareas
ℎ𝑌𝑡= 𝐴𝑧𝛼+𝛽+𝛾𝐾𝛼𝐿𝛽𝑅𝐶𝐵𝛾………. (3) ℎ𝑌𝑡= 𝑧𝛼+𝛽+𝛾(𝐴𝐾𝛼𝐿𝛽𝑅𝐶𝐵𝛾)……… (4)
The coefficient h in equations (2), (3), and 4 represent the h-times rise in the final output (Yt).
The laws of return to scale rules are provided by the equations above. Following that 𝑌𝑡 = 𝐴𝐾𝛼𝐿𝛽𝑅𝐶𝐵𝛾, ℎ = 𝑧𝛼+𝛽+𝛾. From this association, the rules for LRS can be obtained.
From equation (1), we obtain the per capita output by dividing through the equation by labour (𝐿𝑡). Thus, we obtain
𝑦𝑡= 𝐴𝑘𝑡𝛼[𝑟𝑐𝑏𝑡]𝛾………. (5) From equation 4.5, 𝑦𝑡 = 𝑌𝑡
𝐿𝑡
⁄ , 𝑘𝑡 = 𝐾𝑡 𝐿𝑡
⁄ , 𝑟𝑐𝑏𝑡 = 𝑅𝐶𝐵𝑡 𝐿𝑡
⁄
An economy's supply and demand for money can be controlled with fiscal policy tools such as government spending and taxes. The implementation of fiscal policies thus affects the quantity of money supply within an economy. This subsequently influences real cash balances. Hence following the study of Chishti et al. (2021), fiscal policy is integrated into the aggregate Cobb-Douglas production function:
𝑦𝑡 = 𝐴𝑘𝑡𝛼[𝐹𝑃𝐿𝑡]𝛾………. (6)
The emission of dangerous gases such as carbon dioxide (CO2) into the environment is primarily related to the economic activities within an economy. Thus, following the study of Ahmad et al. (2019), carbon dioxide (CO2e) is equated to output, as shown below
𝐶𝑂2𝑒 = 𝑌𝑡………. (7) 𝐶𝑂2𝑒 = 𝐴𝑘𝑡𝛼[𝐹𝑃𝐿𝑡]𝛾………. (8)
Following the study of Chishti et al. (2021), the capital inputs in the function are replaced with renewable and non-renewable resources (fossil fuel). According to Chishti et al. (2021), not all capital resources such as renewables contribute to environmental pollution. It is, therefore, appropriate to represent capital inputs in the function with both renewable and non- renewable energy resources. Thus, capital inputs in the function are presented as
𝑘𝑡 = 𝑘𝑅𝐸𝐶+ 𝑘𝑁𝑅𝐸………. (9)
Where 𝑘𝑡 is total capital inputs, 𝑘𝑅𝐸𝐶 is renewable energy resources, and 𝑘𝑁𝑅𝐸 is non- renewable resources. Thus, the function becomes
𝐶𝑂2𝑒 = 𝐴[𝑅𝐸𝐶𝑡]𝜕[𝑁𝑅𝐸𝑡]𝜕[𝐹𝑃𝐿𝑡]𝛾………. (10)
To satisfy the environmental Kuznets curve (EKC) hypotheses for this study, the gross domestic product per capita (GDP) was integrated to represent income, while industrialization is included as a control variable. However, to solve the issue of collinearity between EFPL and CFPL, this present study combined the two variables and used FPL to represent both expansionary and contractionary fiscal policy. Thus an increase and decrease in FPL represent expansionary and contractionary fiscal policy respectively.
Hence, the final model is shown as:
𝐶𝑂2𝑒𝑖𝑗𝑡 = 𝛼0+ 𝛼1𝑅𝐸𝐶𝑖𝑗𝑡+ 𝛼2𝑖𝑗𝑁𝑅𝐸𝑖𝑗𝑡+ 𝛼3𝐹𝑃𝐿𝑖𝑗𝑡+ 𝛼4𝐺𝐷𝑃𝑖𝑗𝑡+ 𝛼5𝐼𝑁𝐷𝑖𝑗𝑡 (11)
Econometric Techniques Cross-Sectional Dependence
76 |
J o u r n a l o f A d v a n c e d R e s e a r c h i n E c o n o m i c s a n d A d m i n i s t r a t i v e S c i e n c e s
https://bcsdjournals.com/index.php/jareas
None of the studies on fiscal policy, energy consumption, and carbon dioxide emissions has paid significant attention to the issue of cross-sectional dependence. As explained in previous sections, the presence of cross-sectional dependence among variables could lead to spurious regression results if not addressed appropriately. This current study employed the Pesaran CD and standardized Lagrange Multiplier (LM) cross-sectional dependence tests proposed by Pesaran (2004) and the Breusch-Pagan LM proposed by Breusch and Pagan (1980) to detect the presence of cross-sectional dependence among the dataset used for this study.
Persaran CIPS Panel Unit Root Test
To ensure that the problem of cross-sectional dependence is dealt with while performing unit root test, this study used the Persaran CIPS panel unit root test to assess the stationarity of the dataset. Persaran CIPS panel unit root test considers each unit's average lagged levels and differences, allowing cross-sectional dependence. The Persaran CIPS panel unit root test is estimated as follows:
Westerlund Error Correction Panel Cointegration
Among the various conintegration tests employed by academics for their studies over the years include Engle-Granger, the Johansen Test, and the Phillips-Ouliaris test. Nonetheless none of these approaches to cointegration test is able to deal with the problem of the possible existences of cross-sectional dependence among panel dataset. This study thus employed the Westerlund error correction panel cointegration test, which is able to detect cointegration in the cross-sectional panel data in this study. This analytical technique efficiently addresses the issue of cross-sectional dependence by using the error correction term.
Long-Run Relationship Estimation Techniques (CS-ARDL, CCEMG, and AMG)
The Panel Cross-Section Augmented ARDL (CS-ARDL) advanced by Chudik and Pesaran (2013), Common Correlated Effect Means Group (CCEMG) proposed by Pesaran (2006) and extended by Chudik and Pesaran (2015), and the augmented mean group (AMG) were used to estimate the coefficient of the variables of the study. These analytical techniques were employed to deal with the issue of cross-sectional dependence, which is highly probable to be present in panel data. The cross-sectional augmented autoregressive distributed lag (CS- ARDL) modelling approach, considers time dynamics, cross-sectional heterogeneity, and cross-sectional dependence in it estimation. common Correlated Effect Means Group (CCEMG) on the other hand accounts for heterogeneous unobserved common factors by introducing cross-section averages for the dependent and independent variables into the model. The augmented mean group (AMG) considers the common factors in the series and is also used in the presence of the problem of internalisability, which indicates that there is a correlation between explanatory variables and error terms
Causality Test
In an effort to establish the directional causal relationship among the variables of this study, the Dumitrescu and Hurlin (2012) approach to causality was employed to carry out the causality test. The causality test provides three different directional causality results. The three possible results from the causality test include bi-causal relationships running from two variables to each other; the uni-directional causation running from one variable to the other, and the neutral-causal relationship where there are is causal linkages between the variables
RESULTS AND DISCUSSION Empirical Analysis
Descriptive Statistics
77 |
J o u r n a l o f A d v a n c e d R e s e a r c h i n E c o n o m i c s a n d A d m i n i s t r a t i v e S c i e n c e s
https://bcsdjournals.com/index.php/jareas
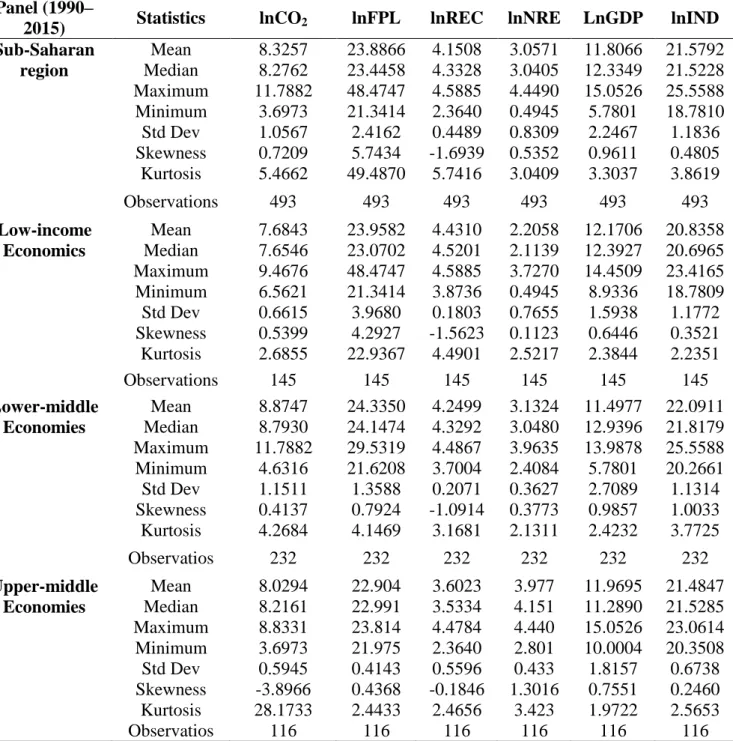
All the study variables were logged to ensure that the distribution of the transformed variables are more symmetric. Table 5 below presents the summary statistics of the variables used for the study. The statistics for the study variables shown on Table 5 include the means, median maximum, minimum, standard deviations, skewness, and kurtoses of the study variables.
Table 5. Descriptive Statistics Panel (1990–
2015) Statistics lnCO2 lnFPL lnREC lnNRE LnGDP lnIND Sub-Saharan
region
Mean 8.3257 23.8866 4.1508 3.0571 11.8066 21.5792 Median 8.2762 23.4458 4.3328 3.0405 12.3349 21.5228 Maximum 11.7882 48.4747 4.5885 4.4490 15.0526 25.5588 Minimum 3.6973 21.3414 2.3640 0.4945 5.7801 18.7810 Std Dev 1.0567 2.4162 0.4489 0.8309 2.2467 1.1836 Skewness 0.7209 5.7434 -1.6939 0.5352 0.9611 0.4805 Kurtosis 5.4662 49.4870 5.7416 3.0409 3.3037 3.8619
Observations 493 493 493 493 493 493
Low-income Economics
Mean 7.6843 23.9582 4.4310 2.2058 12.1706 20.8358 Median 7.6546 23.0702 4.5201 2.1139 12.3927 20.6965 Maximum 9.4676 48.4747 4.5885 3.7270 14.4509 23.4165 Minimum 6.5621 21.3414 3.8736 0.4945 8.9336 18.7809 Std Dev 0.6615 3.9680 0.1803 0.7655 1.5938 1.1772 Skewness 0.5399 4.2927 -1.5623 0.1123 0.6446 0.3521 Kurtosis 2.6855 22.9367 4.4901 2.5217 2.3844 2.2351
Observations 145 145 145 145 145 145
Lower-middle Mean 8.8747 24.3350 4.2499 3.1324 11.4977 22.0911 Economies Median 8.7930 24.1474 4.3292 3.0480 12.9396 21.8179 Maximum 11.7882 29.5319 4.4867 3.9635 13.9878 25.5588 Minimum 4.6316 21.6208 3.7004 2.4084 5.7801 20.2661 Std Dev 1.1511 1.3588 0.2071 0.3627 2.7089 1.1314 Skewness 0.4137 0.7924 -1.0914 0.3773 0.9857 1.0033 Kurtosis 4.2684 4.1469 3.1681 2.1311 2.4232 3.7725
Observatios 232 232 232 232 232 232
Upper-middle Mean 8.0294 22.904 3.6023 3.977 11.9695 21.4847 Economies Median 8.2161 22.991 3.5334 4.151 11.2890 21.5285 Maximum 8.8331 23.814 4.4784 4.440 15.0526 23.0614 Minimum 3.6973 21.975 2.3640 2.801 10.0004 20.3508 Std Dev 0.5945 0.4143 0.5596 0.433 1.8157 0.6738 Skewness -3.8966 0.4368 -0.1846 1.3016 0.7551 0.2460 Kurtosis 28.1733 2.4433 2.4656 3.423 1.9722 2.5653
Observatios 116 116 116 116 116 116
Source: Author’s Compilation, 2022 Cross-Sectional Dependence Test
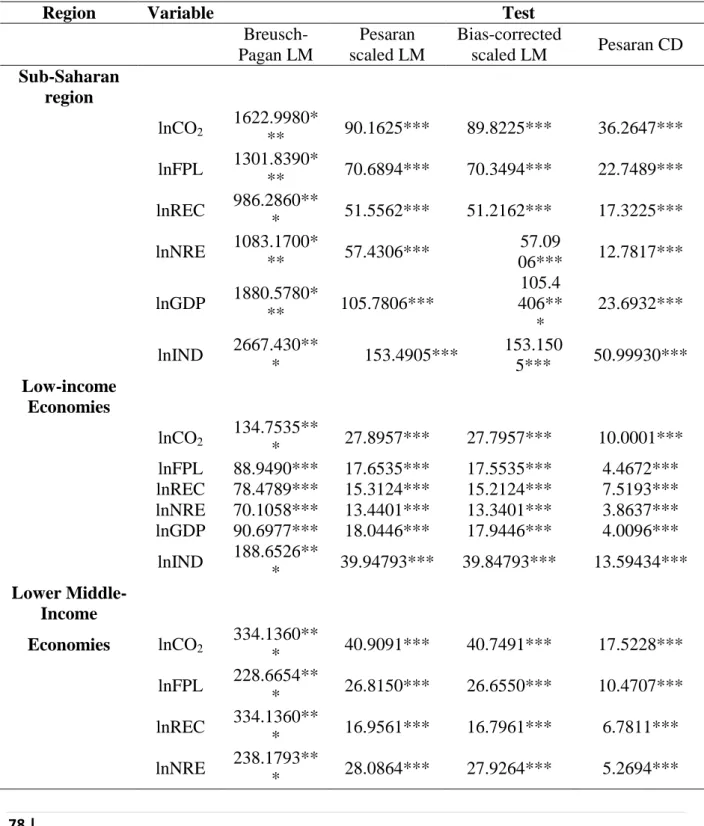
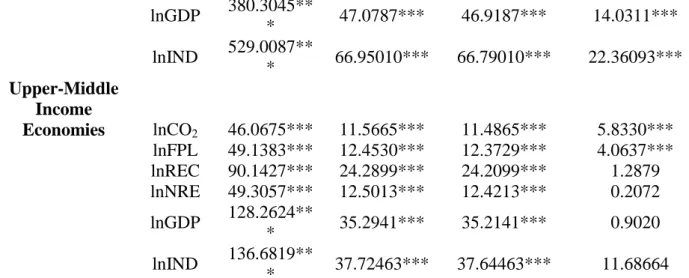
Presented on Table 5.2 are the results for cross-sectional dependence tests based on Breusch and Pagan (1980) and Pesaran (2004). It can be observed from the results presented on Table 6 that cross-sectional dependence exist for all the panel series used except for non-renewable
78 |
J o u r n a l o f A d v a n c e d R e s e a r c h i n E c o n o m i c s a n d A d m i n i s t r a t i v e S c i e n c e s
https://bcsdjournals.com/index.php/jareas
energy (lnNRE), renewable energy (lnREC), income (lnGDP) (at the upper-middle income level by the Pesaran CD statistic). The results thus indicates the presence of cross-sectional dependence at various income levels of economies within the sub-Saharan African region.
The presence of the cross-sectional dependence among the panel series thus justifies the need for the application of recent econometric techniques that are able to deal with the problem of cross-sectional dependence. Thus, the Pesaran CIPS panel unit root test, cross-sectional augmented autoregressive distributed lag (CS-ARDL), common correlated effect means group (CCEMG), and the augmented mean group (AMG) were used to estimate the dynamic panel regression since they provide consistent and robust results in the presence of cross- sectional dependence challenges in estimation
Table 6. Cross-Sectional Dependency Results
Region Variable Test
Breusch- Pagan LM
Pesaran scaled LM
Bias-corrected
scaled LM Pesaran CD Sub-Saharan
region
lnCO2
1622.9980*
** 90.1625*** 89.8225*** 36.2647***
lnFPL 1301.8390*
** 70.6894*** 70.3494*** 22.7489***
lnREC 986.2860**
* 51.5562*** 51.2162*** 17.3225***
lnNRE 1083.1700*
** 57.4306*** 57.09
06*** 12.7817***
lnGDP 1880.5780*
** 105.7806***
105.4 406**
*
23.6932***
lnIND 2667.430**
* 153.4905*** 153.150
5*** 50.99930***
Low-income Economies
lnCO2 134.7535**
* 27.8957*** 27.7957*** 10.0001***
lnFPL 88.9490*** 17.6535*** 17.5535*** 4.4672***
lnREC 78.4789*** 15.3124*** 15.2124*** 7.5193***
lnNRE 70.1058*** 13.4401*** 13.3401*** 3.8637***
lnGDP 90.6977*** 18.0446*** 17.9446*** 4.0096***
lnIND 188.6526**
* 39.94793*** 39.84793*** 13.59434***
Lower Middle- Income
Economies lnCO2 334.1360**
* 40.9091*** 40.7491*** 17.5228***
lnFPL 228.6654**
* 26.8150*** 26.6550*** 10.4707***
lnREC 334.1360**
* 16.9561*** 16.7961*** 6.7811***
lnNRE 238.1793**
* 28.0864*** 27.9264*** 5.2694***
79 |
J o u r n a l o f A d v a n c e d R e s e a r c h i n E c o n o m i c s a n d A d m i n i s t r a t i v e S c i e n c e s
https://bcsdjournals.com/index.php/jareas lnGDP 380.3045**
* 47.0787*** 46.9187*** 14.0311***
lnIND 529.0087**
* 66.95010*** 66.79010*** 22.36093***
Upper-Middle Income
Economies lnCO2 46.0675*** 11.5665*** 11.4865*** 5.8330***
lnFPL 49.1383*** 12.4530*** 12.3729*** 4.0637***
lnREC 90.1427*** 24.2899*** 24.2099*** 1.2879 lnNRE 49.3057*** 12.5013*** 12.4213*** 0.2072 lnGDP 128.2624**
* 35.2941*** 35.2141*** 0.9020
lnIND 136.6819**
* 37.72463*** 37.64463*** 11.68664
*Indicates significance at 10% level. **Indicates significance at 5% level. ***Indicates significance at 1% level
Unit Root Test
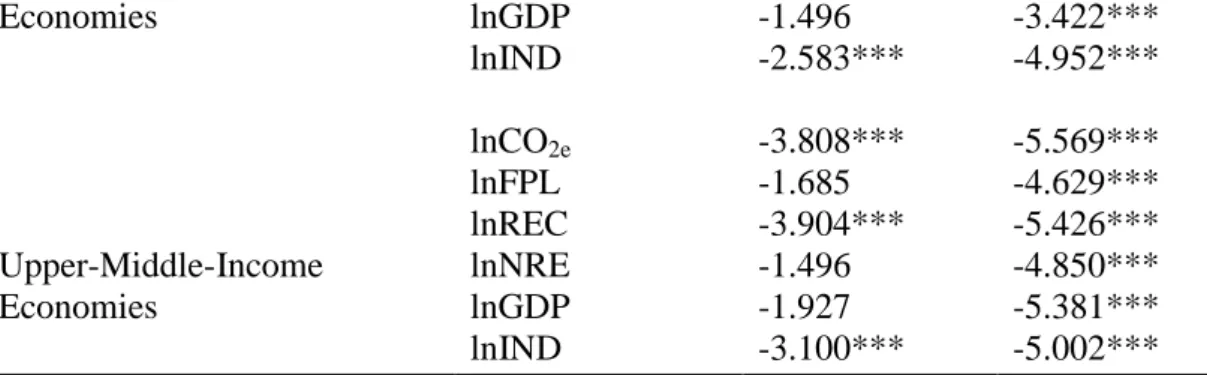
The results of the CIPS Persaran panel unit root test are shown in Table 5.3. From the results presented in Table 7, it could be observed that while some of the panel series (variables) are stationary at various significance levels across the various income sub-panels at levels, others are not. However, all the panel series are stationary at first difference. The null hypothesis of the unit root is therefore rejected for all the variables (panel series) employed in this study at first difference. Thus, the variables are integrated in order one I (1). The results obtained for the unit root analysis is indicative of a possible long-run relationship between the variables (fiscal policy, renewable energy, non-renewable energy, and carbon dioxide emissions).
Table 7. CIPS Persaran Panel Unit Root Test Results for Different Income-Based Countries in Sub-Saharan Africa.
Region Variable Test
Level First Difference
Sub-Saharan region
lnCO2e -2.386*** -4.986***
lnFPL -2.396*** -4.216***
lnREC -2.222** -4.799***
lnNRE -2.001 -4.869***
lnGDP -1.346 -4.125***
lnIND -2.293 *** -4.983***
Low-income Economies
lnCO2e -1.585 -4.232***
lnFPL -2.391** -4.076***
lnREC -1.945 -4.200***
lnNRE -1.757 -4.279***
lnGDP -1.046 -3.998***
lnIND -2.862*** -4.810***
Lower Middle-Income
lnCO2e -2.354*** -5.337***
lnFPL -2.228* -4.069***
lnREC -1.767 -4.885***
lnNRE -2.631 -5.159***
80 |
J o u r n a l o f A d v a n c e d R e s e a r c h i n E c o n o m i c s a n d A d m i n i s t r a t i v e S c i e n c e s
https://bcsdjournals.com/index.php/jareas
Economies lnGDP -1.496 -3.422***
lnIND -2.583*** -4.952***
Upper-Middle-Income Economies
lnCO2e -3.808*** -5.569***
lnFPL -1.685 -4.629***
lnREC -3.904*** -5.426***
lnNRE -1.496 -4.850***
lnGDP -1.927 -5.381***
lnIND -3.100*** -5.002***
“Note: *Indicates significance at 10% level. **Indicates significance at 5% level.
***Indicates significance at 1% level”
Westurland ECM Cointegration
The use of the Westurland ECM panel cointegration test in this study was aimed at establishing a long-run cointegration relationship among the study variables in the presence of cross-sectional dependence. As presented in Table 8 below, the test results indicate the presence of a long-run cointegration relationship among the study variables. Thus, the null hypothesis of no cointegration is rejected. The results imply a long-run relationship exist between fiscal policy, energy consumption and carbon dioxide emissions. Hence, the results provide the basis for estimating the impact of fiscal policy, renewable energy, and non- renewable energy on carbon dioxide emissions.
Table 8. Westurland ECM Cointegration Test Results
Gt Ga Pt Pa
Sub-Saharan Africa -2.658** -7.186 -12.755*** -11.600***
Low-Income Economies -2.023* -3.839 -4.205* -6.031*
Lower-Middle Income Economies -3.084*** -7.690 -10.585*** -12.164***
Upper-Middle Income Economies -2.963* -28.499*** -3.892 -30.754***
*Indicates significance at 10% level., **Indicates significance at 5% level., ***Indicates significance at 1% level
CS-ARDL, CCEMG, AMG Long-Run Estimation Results
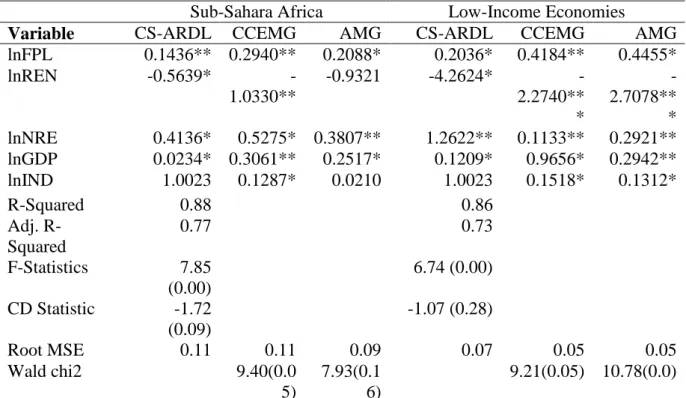
Long-Run Estimation Results For Sub-Sahara Africa and Low-Income Economies
The study’s results show a significant impact of all the study variables across the three estimation methods (CS-ARDL, CCEMG, and AMG) used at different significance levels. As shown in Table 5.5, a 1% increase or decrease in the fiscal policy which represents expansionary or contractionary respectively causes carbon dioxide emissions to rise or decrease by 0.14%, 0.29%, and 0.21% for the sub-Saharan African region, respectively as estimated with CS-ARDL, CCEMG, and AMG. The results indicates that fiscal policy has significant long-run effect on carbon dioxide emissions in the sub-Saharan African region.
Thus the pursuit of expansionary fiscal policy by governments of sub-Saharan Africa is expected to cause carbon dioxide emissions to rise. On the other hand the implementation of contractionary fiscal policy in sub-Saharan Africa is expected to cause carbon emissions to fall. This could be attributed to the fact that most of the production within the sub-Saharan
81 |
J o u r n a l o f A d v a n c e d R e s e a r c h i n E c o n o m i c s a n d A d m i n i s t r a t i v e S c i e n c e s
https://bcsdjournals.com/index.php/jareas
region is dependent on fossil fuel; thus, an increase or decrease in fiscal policy (expansionary or contractionary fiscal policy), which is expected to increase or decrease production respectively, will cause carbon dioxide emissions into the environment to increase or decrease respectively. These findings are consistent with the findings of Chishti et al. (2021) and Katircioglu and Katircioglu (2018), who found a significant positive relationship between fiscal policy and carbon dioxide emission.
The study’s result, as expected, revealed a significant negative long-run effect of renewable energy consumption on carbon dioxide emissions. The study’s results as presented in Table 5.5 shows that 1% increase in renewable energy consumption in the sub-Saharan African region will decrease carbon dioxide emissions by 0.56%, 1.03%, and 0.93%, as estimated by CS-ARDL, CCEMG, and AMG respectively. These findings are supported by the findings of Ullah et al. (2020), Chishti et al. (2020), and Ikram et al. (2020), who also found a long-run negative effect of renewable energy consumption on carbon dioxide emissions. This finding is suggestive that as more of renewable energy resources are consumed, the lesser the emission of dangerous gases such as carbon dioxide into the environment in the sub-Saharan African region. Non-renewable energy consumption was however found to positively affect carbon dioxide emissions significantly in the long-run. This study’s results specifically show that carbon dioxide emissions rises by 0.41%, 0.53%, and 0.38% as estimated by CS-ARDL, CCEMG, and AMG respectively when the use of non-renewable energy sources such as fossil-fuel increases by 1%. These results are consistent with the findings of Ahmad and Khattak (2020), Arminen and Menegaki (2019), and Zhang et al. (2019), who also a significant positive effect of non-renewable energy consumption on carbon dioxide emissions.
As shown in Table 5.5, the coefficients of the estimations indicates that a percentage increase in income causes carbon dioxide emissions to increase by 0.02%, 0.31%, and 0.25%, respectively. These results indicate that as income increases, economic activities increases and subsequently causes the pollution of the environment to increase. The findings of Khattak et al. (2020), Arminen and Menegaki (2019), and Ahmad et al. (2020), which validated the EKC model, support the findings of this current study. Thus, the EKC model is also validated in this study. Finally, the results of only CCEMG in this study as shown in Table 5.5 shows that industrialization in sub-Saharan Africa has a significant positive effect on carbon dioxide emissions. Though the results of the CCEMG estimator revealed a significant effect of industrialization on carbon emissions, the significance is at 10% significance level indicating a weak relationship. The results obtained for industrialization is a testament to the fact that industrialization in sub-Saharan Africa has not experienced the necessary growth over the years to influence carbon emissions. Specifically, the results of the CCEMG estimator revealed that carbon dioxide emissions increases by 0.13%, , as industrialization increases by 1%. This finding support the findings of Li and Lin (2015), Raheem and Ogebe (2017), and Sadorsky (2014), which also revealed a significant positive effect of industrialization on carbon dioxide emissions.
Regarding low-income economies in the sub-Saharan African region, the study’s results from the three estimators (CS-ARDL, CCEMG, and AMG) as presented in Table 8 revealed that fiscal policy has a significant positive effect on carbon dioxide emissions. Thus, the implementation of expansionary and contractionary fiscal policies will lead to the increase and decrease in carbon dioxide emissions respectively in low-income economies. The results specifically indicates that implementation of expansionary and contractionary fiscal policies in low-income economies in sub-Saharan Africa will lead to an increase and decrease respectively in carbon dioxide emissions by 0.20%, 0.42%, and 0.45% as estimated by CS-
82 |
J o u r n a l o f A d v a n c e d R e s e a r c h i n E c o n o m i c s a n d A d m i n i s t r a t i v e S c i e n c e s
https://bcsdjournals.com/index.php/jareas
ARDL, CCEMG, and AMG. Similar to the estimated the results for whole sub-Saharan African region, the estimated results for renewable and non-renewable energy consumption in low-income economies have significant negative and positive effects on carbon dioxide emissions respectively. Thus, an increase in the use of renewable and non-renewable energy will lead to a decrease (4.2%, 2.27%, and 2.711%) and increase (1.26%, 0.11%, and 0.29%) in carbon dioxide emissions respectively. The results estimated also revealed that income is a significant contributor to the variations in carbon dioxide emissions in lower-income economies. As shown in Table 5.5, a percentage increase in income will lead to 0.12%, 0.97%, and 0.29% increase in carbon dioxide emissions in low-income economies. The long- run effect of industrialization on carbon emissions in low-income economies, similar to the results of the entire sub-Saharan Africa had only two estimators’ (CCEMG and AMG) results being significant but weak (at 10% significance level).
Table 8. CS-ARDL, CCEMG, and AMG Estimation Results for Sub-Saharan Africa and Low-Income Economies
Sub-Sahara Africa Low-Income Economies
Variable CS-ARDL CCEMG AMG CS-ARDL CCEMG AMG
lnFPL 0.1436** 0.2940** 0.2088* 0.2036* 0.4184** 0.4455*
lnREN -0.5639* -
1.0330**
-0.9321 -4.2624* -
2.2740**
*
- 2.7078**
* lnNRE 0.4136* 0.5275* 0.3807** 1.2622** 0.1133** 0.2921**
lnGDP 0.0234* 0.3061** 0.2517* 0.1209* 0.9656* 0.2942**
lnIND 1.0023 0.1287* 0.0210 1.0023 0.1518* 0.1312*
R-Squared 0.88 0.86
Adj. R- Squared
0.77 0.73
F-Statistics 7.85 (0.00)
6.74 (0.00) CD Statistic -1.72
(0.09)
-1.07 (0.28)
Root MSE 0.11 0.11 0.09 0.07 0.05 0.05
Wald chi2 9.40(0.0
5)
7.93(0.1 6)
9.21(0.05) 10.78(0.0)
*Indicates significance at 10% level. **Indicates significance at 5% level. ***Indicates significance at 1% level
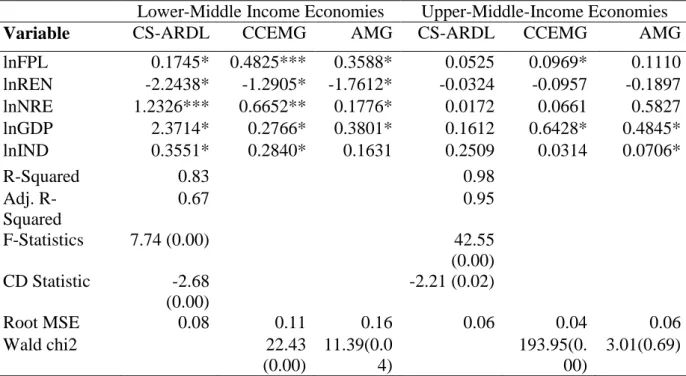
Long-Run Estimation Results For Lower- and Upper-Middle-Income Economies
The estimated results for the lower-middle-income economies, though similar to that of the entire sub-Saharan African region and low-income economies show a comparatively weaker (majority of coefficients are significant at 10%) long-run effect of the study variables on carbon dioxide emissions. As presented in Table 5.6, fiscal policies (expansionary and contractionary) have a significant effect on carbon dioxide emissions in lower-middle-income economies of the sub-Saharan African region. The results indicate that a percentage change in fiscal policy will lead to a 0.17%, 0.48%, and 0.36% change in carbon emissions as estimated by CS-ARDL, CCEMG, and AMG respectively, depending on the kind of fiscal policy being pursued by the government. As shown in Table 5.7, renewable and non-renewable energy consumption are significant determinants of carbon emissions in lower-middle-income economies. The estimated results of this study show that a percentage increase in renewable