CASE STUDIES OF ACCOUNTING CONCEPTS AND METHODOLOGIES
by
Bruce S. Senter, Jr.
A thesis submitted to the faculty of the University of Mississippi in partial fulfillment of the requirements of the Sally McDonnell Barksdale Honors College.
Oxford, MS May 2019
Approved by
Advisor: Dr. Vicki Dickinson
Reader: Dr. W. Mark Wilder
THESIS ABSTRACT
BRUCE SENTER: Case Studies of Accounting Concepts, Documentation, and Methodologies
Instead of the traditional honors thesis that is written during a winter internship and communicated to the dean throughout the course of work, the following alternative thesis is composed of twelve individual case studies that were drawn from the course Accountancy 420. The course, led by Dr. Victoria Dickinson, was scheduled in a way that the cases were worked on in conjunction with professional meetings and
presentations, in which members of accounting firms or various other businesses would discuss topics relating to the current state of accounting, their specific industry, and how the two intertwine. The case studies all required, in some form or another, analysis of a company’s financial statements and a certain level of critical thinking to reason out how a certain accounting principle applies to the figures and line items presented. As is evident from the attached case studies, the companies examined are from a wide range of
industries and have greatly varying revenue streams. Additionally, there are even foreign companies explored in some of the case studies which offer a unique look into the International Financial Reporting Standards (IFRS) that is not usually covered in the undergraduate accounting courses I have completed thus far.
TABLE OF CONTENTS
Case Study One: Home Heaters ... 3
Case Study Two: Molson Coors Brewing ... 15
Case Study Three: Pearson PLC ... 21
Case Study Four: Ending Inventory Error Adjustments ... 27
Case Study Five: Palfinger AG ... 31
Case Study Six: Volvo Group ... 38
Case Study Seven: Data Analytics Overview ... 43
Case Study Eight: Rite Aid Corp ... 50
Case Study Nine: Merck & Co. ... 56
Case Study Ten: State Street Corp ... 61
Case Study Eleven: ZAAG ... 67
Case Study Twelve: Apple Inc. ... 74
CASE STUDY ONE Home Heaters Inc.
Financial Analysis of Glenwood and Eads
Introduction
The following data enclosed in the case study presents the financial decisions and statements of two companies selling home heating units in Colorado, Eads Heaters, Inc.
and Glenwood Heating, Inc. The case study finds the two companies both in the first year of business, with very similar operations yet different accounting techniques when
applying GAAP to their financial statements. Part A delineates the transactions that both companies make to begin operations along with a trial balance, while Part B highlights the subsequent choices made by managers that differ; this section consists of each company’s separate transactions, new trial balance, income statement, statement of retained earnings, and finally balance sheet. The financial information about the two companies is then used to calculate ratios on liquidity, debt management, and profitability in order to make a decision in which company one should invest. The appendix at the tail end of the case study includes the general journal used for both companies to keep track of transactions.
Part A:
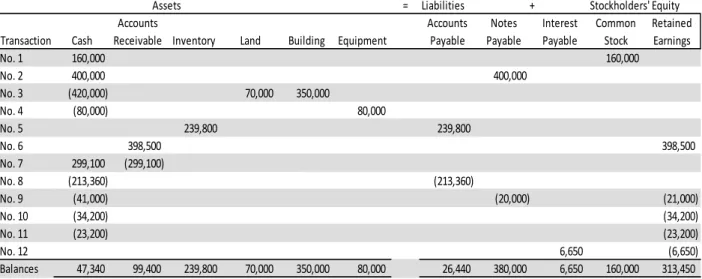
Table 1-1 Basic Transactions, Both Companies
Table 1-2 Basic Trial Balance, Both Companies
= Liabilities Stockholders' Equity
Transaction Cash
Accounts
Receivable Inventory Land Building Equipment
Accounts Payable
Notes Payable
Interest Payable
Common Stock
Retained Earnings
No. 1 160,000 160,000
No. 2 400,000 400,000
No. 3 (420,000) 70,000 350,000
No. 4 (80,000) 80,000
No. 5 239,800 239,800
No. 6 398,500 398,500
No. 7 299,100 (299,100)
No. 8 (213,360) (213,360)
No. 9 (41,000) (20,000) (21,000)
No. 10 (34,200) (34,200)
No. 11 (23,200) (23,200)
No. 12 6,650 (6,650)
Balances 47,340 99,400 239,800 70,000 350,000 80,000 26,440 380,000 6,650 160,000 313,450
Assets +
Debits Credits
Cash 47,340
Accounts Receivable 99,400
Inventory 239,800
Land 70,000
Building 350,000
Equipment 80,000
Accounts payable 26,440
Note payable 380,000
Interest payable 6,650
Common Stock 160,000
Dividend 23,200
Sales 398,500
Other operating expenses 34,200
Interest expense 27,650
Total 971,590 971,590
Part B:
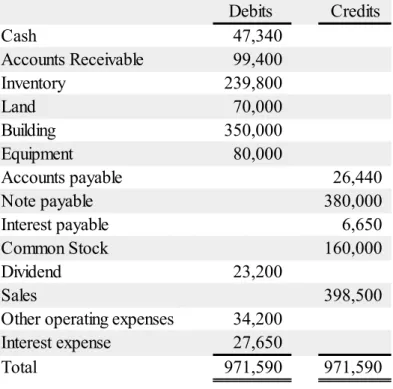
Table 1-3 Additional Information for Glenwood
Transaction Cash
Accounts Receivable
Allowance for Bad
Debts Inventory Land Building
Accumulat ed Deprecatio
n - Building Equipment
Accumulat ed Depreciati
on - Equipment Balances: Part A 47,340 99,400 239,800 70,000 350,000 80,000
Part B (1) Bad Debts 994
Part B (2) COGS (177,000)
Part B (3) Depreciation 10,000 9,000
Building Equipment
Part B (4) Equipment (16,000) Rental Payment
Part B (5) Income Tax (30,914)
Balances: Part A 426 99,400 994 62,800 70,000 350,000 10,000 80,000 9,000 Accounts
Payable
Interest Payable
Note Payable
Common Stock
Retained Earnings Balances: Part A 26,440 6,650 380,000 160,000 313,450
Part B (1) Bad Debts (994)
Part B (2) COGS (177,000)
Part B (3) Depreciation
Building (10,000)
Equipment (9,000)
Part B (4) Equipment
Rental Payment (16,000)
Part B (5) Income Tax (30,914)
Balances: Part A 26,440 6,650 380,000 160,000 69,542
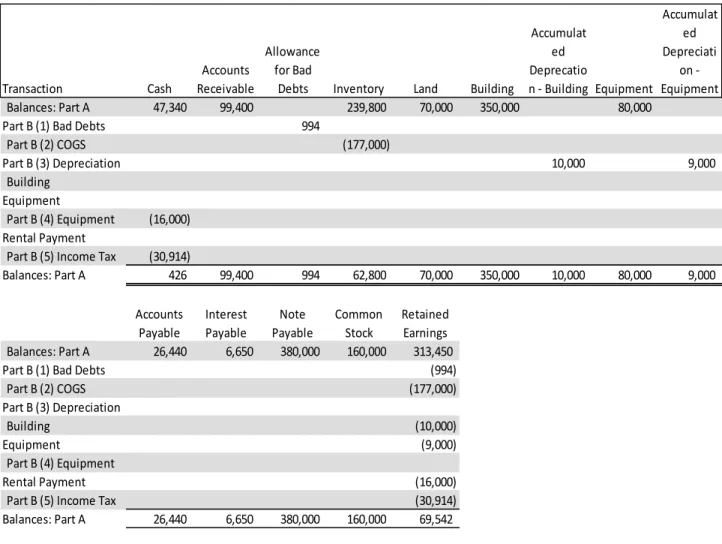
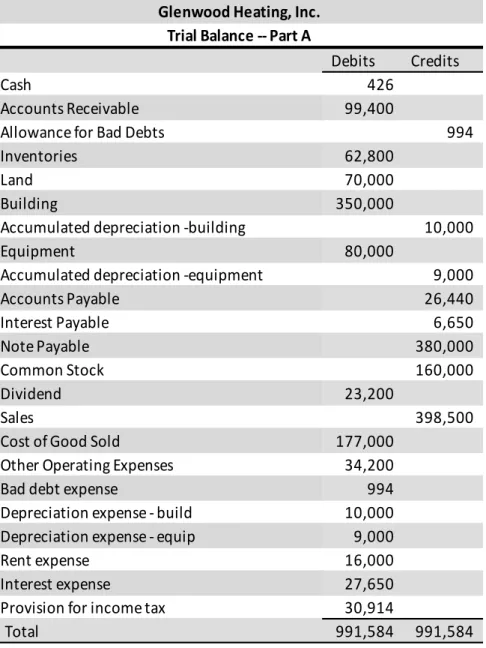
Table 1-4 Glenwood Trial Balance
Debits Credits
Cash 426
Accounts Receivable 99,400
Allowance for Bad Debts 994
Inventories 62,800
Land 70,000
Building 350,000
Accumulated depreciation -building 10,000
Equipment 80,000
Accumulated depreciation -equipment 9,000
Accounts Payable 26,440
Interest Payable 6,650
Note Payable 380,000
Common Stock 160,000
Dividend 23,200
Sales 398,500
Cost of Good Sold 177,000
Other Operating Expenses 34,200
Bad debt expense 994
Depreciation expense - build 10,000 Depreciation expense - equip 9,000
Rent expense 16,000
Interest expense 27,650
Provision for income tax 30,914
Total 991,584 991,584
Trial Balance -- Part A Glenwood Heating, Inc.
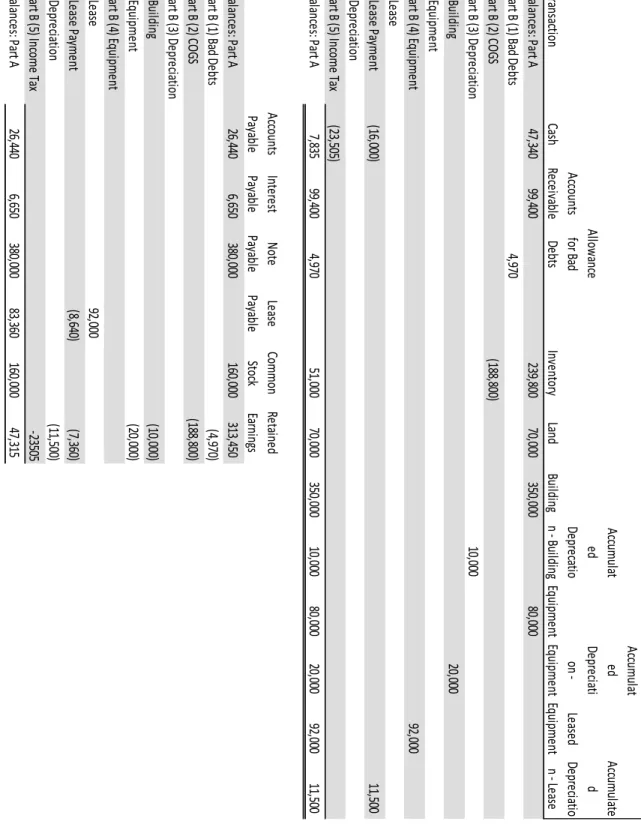
Table 1-5 Additional Information for Eads
TransactionCash AccountsReceivable Allowance for Bad DebtsInventoryLandBuilding AccumulatedDeprecation - BuildingEquipment AccumulatedDepreciation - Equipment Leased Equipment Accumulated Depreciation - LeaseBalances: Part A47,340 99,400 239,800 70,000 350,000 80,000 Part B (1) Bad Debts4,970 Part B (2) COGS(188,800) Part B (3) Depreciation10,000 Building20,000 EquipmentPart B (4) Equipment92,000 LeaseLease Payment(16,000) 11,500 DepreciationPart B (5) Income Tax(23,505) Balances: Part A7,835 99,400 4,970 51,000 70,000 350,000 10,000 80,000 20,000 92,000 11,500 AccountsPayable Interest Payable NotePayable LeasePayable Common Stock Retained EarningsBalances: Part A26,440 6,650 380,000 160,000 313,450 Part B (1) Bad Debts(4,970) Part B (2) COGS(188,800) Part B (3) DepreciationBuilding(10,000) Equipment(20,000) Part B (4) EquipmentLease92,000 Lease Payment(8,640) (7,360) Depreciation(11,500) Part B (5) Income Tax-23505Balances: Part A26,440 6,650 380,000 83,360 160,000 47,315
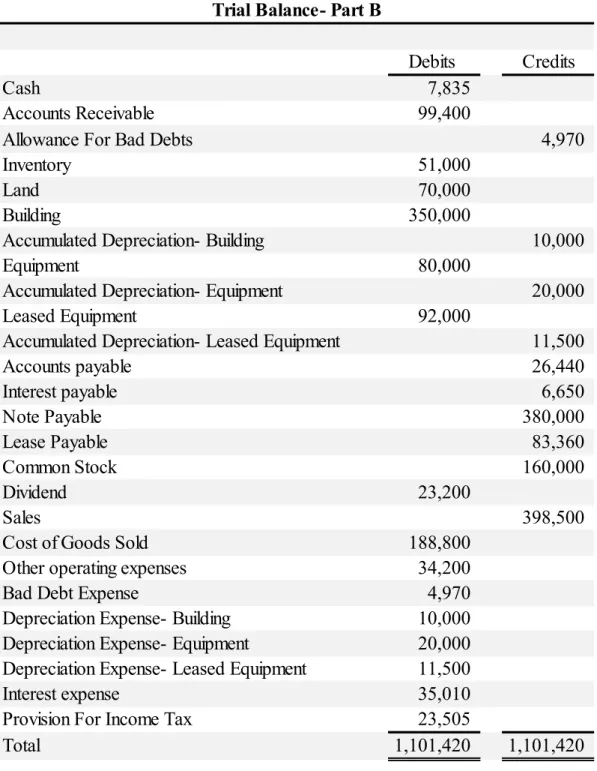
Table 1-6 Eads Trial Balance
Debits Credits
Cash 7,835
Accounts Receivable 99,400
Allowance For Bad Debts 4,970
Inventory 51,000
Land 70,000
Building 350,000
Accumulated Depreciation- Building 10,000
Equipment 80,000
Accumulated Depreciation- Equipment 20,000
Leased Equipment 92,000
Accumulated Depreciation- Leased Equipment 11,500
Accounts payable 26,440
Interest payable 6,650
Note Payable 380,000
Lease Payable 83,360
Common Stock 160,000
Dividend 23,200
Sales 398,500
Cost of Goods Sold 188,800
Other operating expenses 34,200
Bad Debt Expense 4,970
Depreciation Expense- Building 10,000
Depreciation Expense- Equipment 20,000 Depreciation Expense- Leased Equipment 11,500
Interest expense 35,010
Provision For Income Tax 23,505
Total 1,101,420 1,101,420
Eads Heaters, Inc.
Trial Balance- Part B
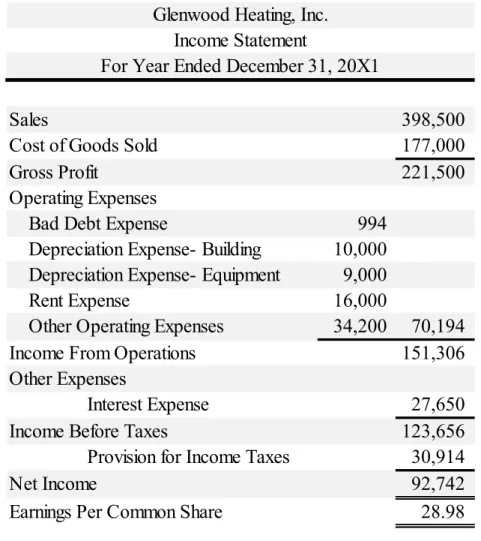
Table 1-7 Glenwood Multi-Step Income Statement
Table 1-8 Glenwood Statement of Retained Earnings
Sales 398,500
Cost of Goods Sold 177,000
Gross Profit 221,500
Operating Expenses
Bad Debt Expense 994
Depreciation Expense- Building 10,000 Depreciation Expense- Equipment 9,000
Rent Expense 16,000
Other Operating Expenses 34,200 70,194
Income From Operations 151,306
Other Expenses
Interest Expense 27,650
Income Before Taxes 123,656
Provision for Income Taxes 30,914
Net Income 92,742
Earnings Per Common Share 28.98
Glenwood Heating, Inc.
Income Statement
For Year Ended December 31, 20X1
Retained Earnings January 1, 20X1 0
Plus: Net Income 92,742
92,742
Less: Dividends (23,200)
Retained Earnings December 31, 20X1 69,542 For Year Ended December 31, 20X1
Statement of Retained Earnings
Glenwood Heating, Inc.
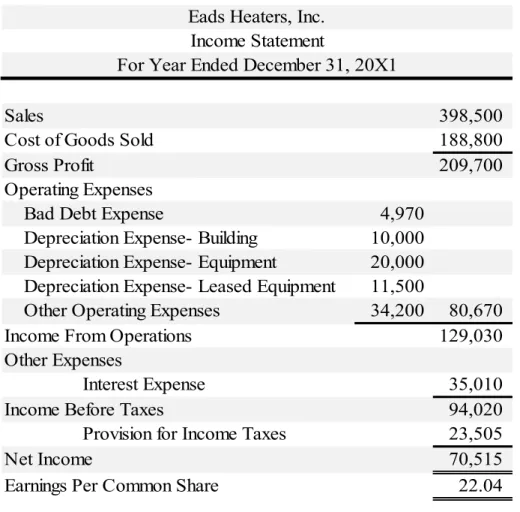
Table 1-9 Eads Multi-Step Income Statement
Table 1-10 Eads Statement of Retained Earnings
Sales 398,500
Cost of Goods Sold 188,800
Gross Profit 209,700
Operating Expenses
Bad Debt Expense 4,970
Depreciation Expense- Building 10,000 Depreciation Expense- Equipment 20,000 Depreciation Expense- Leased Equipment 11,500
Other Operating Expenses 34,200 80,670
Income From Operations 129,030
Other Expenses
Interest Expense 35,010
Income Before Taxes 94,020
Provision for Income Taxes 23,505
Net Income 70,515
Earnings Per Common Share 22.04
Eads Heaters, Inc.
Income Statement
For Year Ended December 31, 20X1
Retained Earnings January 1, 20X1 0
Plus: Net Income 70,515
70,515
Less: Dividends (23,200)
Retained Earnings December 31, 20X1 47,315 Eads Heaters, Inc.
Statement of Retained Earnings For Year Ended December 31, 20X1
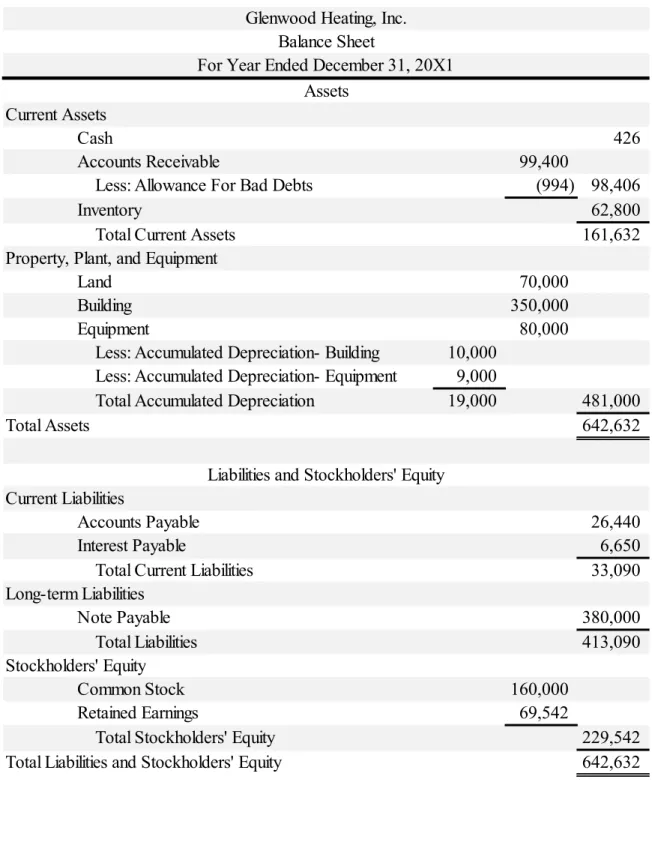
Table 1-11 Glenwood Balance Sheet
Current Assets
Cash 426
Accounts Receivable 99,400
Less: Allowance For Bad Debts (994) 98,406
Inventory 62,800
Total Current Assets 161,632
Property, Plant, and Equipment
Land 70,000
Building 350,000
Equipment 80,000
Less: Accumulated Depreciation- Building 10,000 Less: Accumulated Depreciation- Equipment 9,000
Total Accumulated Depreciation 19,000 481,000
Total Assets 642,632
Current Liabilities
Accounts Payable 26,440
Interest Payable 6,650
Total Current Liabilities 33,090
Long-term Liabilities
Note Payable 380,000
Total Liabilities 413,090
Stockholders' Equity
Common Stock 160,000
Retained Earnings 69,542
Total Stockholders' Equity 229,542
Total Liabilities and Stockholders' Equity 642,632
Liabilities and Stockholders' Equity Glenwood Heating, Inc.
Balance Sheet
For Year Ended December 31, 20X1 Assets
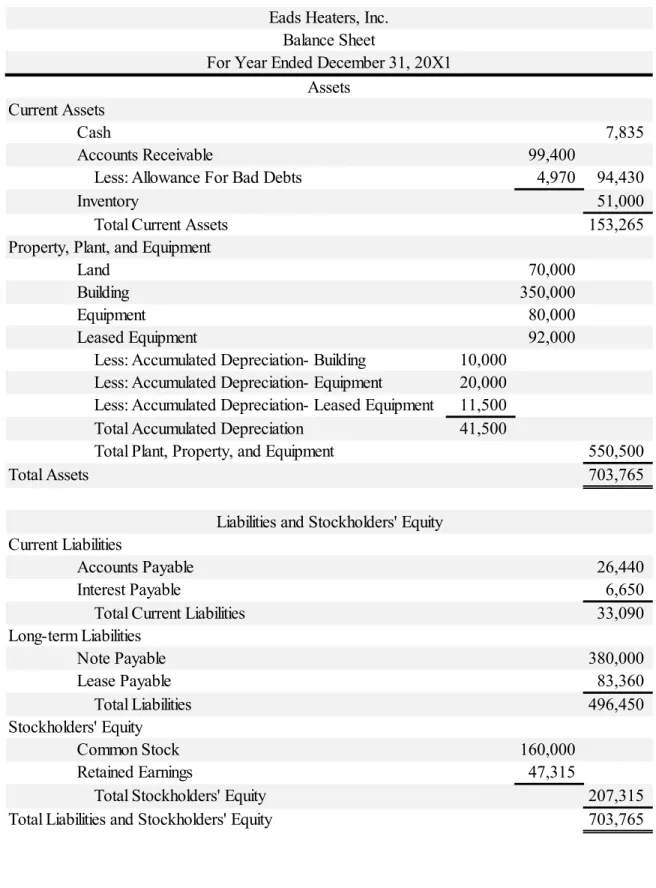
Table 1-12 Eads Balance Sheet
Current Assets
Cash 7,835
Accounts Receivable 99,400
Less: Allowance For Bad Debts 4,970 94,430
Inventory 51,000
Total Current Assets 153,265
Property, Plant, and Equipment
Land 70,000
Building 350,000
Equipment 80,000
Leased Equipment 92,000
Less: Accumulated Depreciation- Building 10,000 Less: Accumulated Depreciation- Equipment 20,000 Less: Accumulated Depreciation- Leased Equipment 11,500 Total Accumulated Depreciation 41,500
Total Plant, Property, and Equipment 550,500
Total Assets 703,765
Current Liabilities
Accounts Payable 26,440
Interest Payable 6,650
Total Current Liabilities 33,090
Long-term Liabilities
Note Payable 380,000
Lease Payable 83,360
Total Liabilities 496,450
Stockholders' Equity
Common Stock 160,000
Retained Earnings 47,315
Total Stockholders' Equity 207,315
Total Liabilities and Stockholders' Equity 703,765
Eads Heaters, Inc.
Balance Sheet
For Year Ended December 31, 20X1 Assets
Liabilities and Stockholders' Equity
Table 1-13 Ratio Analysis
Conclusion
It should be noted that since it is the first year of business for both heating companies, the sample size on profitability and collections for each is somewhat limited and a definite conclusion on the wiser firm in which to invest must be taken with a grain of salt. It is because of this reason that the ratios listed above are very similar in almost every
instance. The current ratio and acid test ratio, indicators of short term debt paying ability, are split for both companies, while the profit margin ratio and gross margin ratio are very nearly the same. If a choice has to be made between the two companies, Glenwood Heating’s higher ROA (return on total assets), ROE (return on common stockholders’
equity), and EPS (all measures of profitability) gives this company the edge. Thus, the smarter investment in Home Heating would be Glenwood Heating, Inc.
Ratio Glenwood Eads
Current1Ratio 4.88 4.63
Acid1Test1"Quick"1Ratio 3.02 3.24
Debt1Ratio 0.64 0.71
Profit1Margin1Ratio 0.23 0.18
Gross1Margin1Ratio 0.56 0.53
Return1on1Total1Assets 0.14 0.1
Return1on1Common1Stockholder's1Equity 0.4 0.34
Basic1Earnings1per1Share 28.98 22.04
CASE STUDY TWO Molson Coors Brewing Company Analysis of Income Statement and Notes
Introduction:
The following is an analysis of the consolidated financial statements of Molson Coors Brewing Company for the fiscal year of 2013. Questions marked as A through D concern the nature of income statements in general as dictated by GAAP and the classifications in a multi-step income statement. The remaining questions deal specifically with the income statement of Molson Coors, its statement of comprehensive income, and the notes that are tied to certain line items in both.
Analysis:
I) The major classifications on a common multi-step income statement are comprised of the following in order:
A. Net sales are calculated from the sales revenue for the period less any sales discounts, returns, or allowances.
B. Cost of goods sold is line item calculated from the costs associated with purchasing and preparing inventory for sale
C. Gross profit is the difference between net sales and cost of goods sold D. Operating expenses comprises the expenses that are associated with the
core operations of a company, and are often divided into Selling Expenses and Administrative Expenses
E. Operating income is the difference between gross profit and operating expenses
F. Other revenues and gains and Other expenses and losses are additions to or deductions from net income that are considered non-operating
G. Income from continuing operations before tax is the difference between operating income and the non-operating revenues and expenses
H. Income tax expense is a deduction calculated from the effective income tax rate multiplied by the above line item
I. Income from continuing operations is the difference between the two items above
J. Discontinued operations includes any losses or gains that come from the discontinuation of divisions of the company or product lines and the related disposals of their assets, net of tax
K. Net income is the difference between income from continuing operations and the total from discontinued operations
L. Income attributable to non-controlling interests includes the income total that is specific to an entity in which the reporting company owns more than 50% yet under 100% or complete control
M. Income attributable to controlling interests, the difference between the two items above, is the net income specific to the reporting entity and its operations alone
II) GAAP requires that companies provide income statements with classifications with the intention of reducing fraudulent practices by businesses; by increasing the need for specificity in financial statements, companies like Molson Coors have less capacity to cheat or leave certain items off the books that would affect their financial standing. The specific nature of the income statement also aids external users such as potential investors in getting a closer look at a company’s core operations, and, on a basic level, see where money is coming from and where the company is spending it.
III) Persistent income can be closely tied to the idea of quality of earnings, and is an income source that can be reasonably assumed to continue in the future. For Molson Coors Brewing Company, persistent income leads to higher quality of earnings because it is dependable, recurring, and consistent from period to period and can give confidence to potential investors that business operations will continue to be profitable.
IV) Comprehensive income, which is either presented after net income in one or two statement format, includes all sources of gain or loss that would be materially affected by the changes in fair value. In other words, comprehensive income includes net income but also all gains and losses that affect stockholders’ equity, or gains and losses which effectively “bypass” net income. The most common example of comprehensive income is the unrealized holding gain on trading securities, a gain of which is warranted by the incessant changing of prices of
stocks. These gains and losses are understandably volatile, so they must be shown separately from net income.
V) Molson Coors begins its condensed income statement by listing the account title
“Sales” then deducts Excise Taxes to produce “Net sales.” In this particular instance, the difference between Sales and Net Sales as mentioned is the Excise Tax on shipments of beer, which is not the norm for an income statement; usually, an income statement deducts contra Sales accounts such as Sales Discounts and Sales Returns and Allowances to reach the Net Sales figure. As mandated by the SEC, excise taxes must be presented as a percentage of Net Sales; this would explain why all contra accounts are pre-included in the Sales account for a simplification of Sales after the mandatory excise tax.
VI) According to Molson Coors own notes to financial statements, the Special Items included charges and benefits that the business did not believe to be indicative of its core operations although were not necessarily infrequent in occurrence. These special items mainly included charges from restructuring (involving the
termination of employees) and restructuring of agreements that subsequently affected intangible assets. The Special items section seems to be reported on a separate line due to the unusual events that substantiate it, which Molson Coors itself describes as “not indicative of [their] operations.” One such item,
impairment or asset abandonment-related loss, seems to be differentiated from Discontinued Operations in the fact that it occurred from the discontinuation in a certain area, the UK, rather than an industry-wide discontinuation. I think that these items’ classification as a operating expenses is incorrect, however; operating expenses should be matched to the core operations of a company which Molson Coors specifically relates the special items are not.
VII) While I stated above that I do not necessarily agree with the classification of the “Special items” as operating expenses, they have a closer association to the core operations of Molson Coors than do the items in “Other income (expense), net.” For instance, Molson Coors had gains in the “Other income” account that
came from the sale of investments or partial ownerships in professional sports organizations like the Colorado Rockies and the Montreal Canadiens. “Other expenses” in this account were items like losses from the movement of foreign currency on foreign instruments or investments (an uncontrollable economic consequence) which have less to do with the actual sale of beer than do the
“Special items” section, which at least includes the abandonment of operating assets.
VIII) The comprehensive income in 2013 attributable only to Molson Coors brewing company (and not its subsidiary companies or “non-controlling
interests”) in millions, was $765.4. The net income for the same year attributable to Molson Coors was $567.3. The difference between net income and this figure is is Other Comprehensive Income, which is comprised of gains or losses whose fair value is fairly volatile and thus difficult to report in the initial calculation of net income. Unrealized gain or loss on security holdings (essentially the income from the changing price of securities) is a commonly cited example, while
Molson Coors largest contributor to Total Comprehensive Income is “Pension and other postretirement benefits.”
IX) The effective tax rate for Molson Coors in the fiscal year of 2013 was 12.8%, which is a result of deductions from the corporate tax rate of 35% coming from federal tax benefits, the effect of lower foreign tax rates where the company has operations, and other unrecognized benefits.
Conclusion
As Molson Coors is a company whose main operations deal in the sale and distribution of alcohol, this case study brings a taxable item I had previously not dealt with in the form of an excise tax. It would be interesting to see about the excise tax on Molson Coors’s beer sales and how it might vary from state to state. Additionally, the analysis of the special items section and its accompanying notes was particularly enlightening because this section was composed of items I had not yet seen and did not know existed prior to
this point. For instance, the inclusion of the line item “Termination fees” had to do with the reduction of pensions in certain areas of Molson Coors’s business along with the benefits given out upon firing for employees. This is a small “dirty” but necessary part of business operations that still must be included without bias or emotion in a company’s financial statements.
CASE STUDY THREE Pearson PLC Analysis of Receivables
Introduction:
For this particular case study, a series of questions is presented in order to elicit an analysis of one company’s receivables. In this instance, the company in question is Pearson PLC, a British conglomerate that publishes textbooks and provides education services for customers worldwide, which is headquartered in London. The financial statements of Pearson, although adhering to the United Kingdom version of GAAP, were a bit unfamiliar to me upon first cursory reading, as many accounting “Briticisms” exist within, such as the use of periods instead of commas when denoting a number with several digits or the account title of “Provision for Bad and Doubtful Accounts” for what most U.S. companies refer to as an Allowance for Doubtful Accounts (normally a
provision has to do with the withholding of money for income taxes). Also of note is the use of a Provision for Sales Returns account title within Pearson’s financial statements;
although I was previously unexperienced with this concept, it makes logical sense that a company would want to get an estimate of how much merchandise would be returned in the coming period in order to give a better realizable value of receivables.
I) An account receivable is a promise by a buyer to pay in cash for a good or service previously rendered within a short period of time, typically thirty to sixty days, with the end of the accounting period or a year (whichever is longer) being the ultimate time limit (as accounts receivable is a current asset). Other names for this particular current asset include Trade Receivables or simply just Receivables.
II) The main difference between accounts receivable and a note receivable is that a note receivable usually takes the form of a promissory note, and its main
difference from an account receivable is that the debtor is required to pay accrued interest on the note.
III) A contra account is an account that has the opposite normal balance of the account to which its tied and is supposed to reduce the balance of said normal account. Examples of this include Sales Returns and Allowances and Sales
Discounts (contra revenue accounts) for the regular account of Sales, or
Allowance for Doubtful Accounts (a contra asset account) which is supposed to reduce Accounts Receivable. The two contra accounts that Pearson presents use the nomenclature common to the United Kingdom financial statements, and are Provision for Bad and Doubtful Accounts and Provision for Sales Returns. It should be noted that financial statements in the US use the word “provision”
when discussing income taxes. The first contra account Pearson uses is Provision for Bad and Doubtful accounts, which comes from an estimation by Pearson as to how much of its accounts receivable will be uncollectible by the end of the year and reduces Trade Receivables. Provision for Sales Returns comes from an estimation of the value of goods customers will return in the coming year, and it should be noted the actual sales returns during the period reduce the final balance of the Provision. It appears Pearson uses an ageing schedule of Trade Receivables to estimate the amount of receivables it should consider uncollectible. The
estimation used here increases the balance of Provision for Bad and Doubtful Accounts, while the estimation of returns increases Provision for Sales Returns.
As mentioned, actual sales returns reduces the balance of Provision for Sales Returns, while the outright write-off of an account reduces the balance of
Provision for Bad and Doubtful accounts while simultaneously reducing the Trade Receivable account.
IV) The percentage of sales procedure for estimating bad debt is fairly simplistic in that it involves using a pre-determined rate or percentage applied to the sales as they are made and as Receivables are accrued. This percentage comes from a company’s past experiences of collecting receivables and allows an easy and timely way to estimate what amounts will be uncollectible. The aging-of-accounts procedure, which is the method used by Pearson’s accountants, separates out the receivables based on how long they have remained uncollected, with the longer period of time meaning a higher percentage that can be considered uncollectible.
Obviously, the beginning balance of the Provision/contra accounts must be known, while the estimation will increase the balance and a write off of the bad
debt will reduce the balance. I think that the aging-of-receivables method provides the best window into how much of the receivables a company will actually be able to collect, as the longer the passage of time the less likely a debtor will make due on their promise.
V) The majority of sales on credit are eventually collected, and the majority of customers do eventually pay; thus, an allowance for doubtful accounts deals with the exception, not the standard. If a customer has to have its account completely written off, the creditor will be extremely hesitant to do business with them again and the debtor’s credit rating will take a severe blow. For this reason, customers with fairly poor credit history will be given a hard look before business is done, and if a note receivable is the form of payment the interest rate will most likely be higher than one for a customer with good credit. A wise manager must be
selective to whom he or she extends credit.
VI)
Beginning and ending balances are self-explanatory, while the exchange difference line item can be attributed to the original provision estimate being made with a currency with lesser value. Income statement movements comes from the actual estimation of uncollectible amounts for the year, while “utilized”
comes from write-offs of accounts. Acquisition through business combination has to do with Pearson absorbing a subsidiary company’s uncollectible receivables.
Provision(for(Bad(and(Doubtful(Accounts
72 Beginning(balance
Exchange(differences 5 26 Income(statement(movements
Utilised 20 3 Acquisition(thru(business(combination
76 Ending(balance
VII)
Bad and doubtful debt expense is an income statement account, while Provision for bad and doubtful accounts and Trade receivables are balance sheet items. As an operating expense, the provision for bad and doubtful debt expense will appear under Selling or Administrative Expense.
VIII)
The provision for sales returns account appears on the balance sheet as a contra receivables account, while sales returns appears on the income statement as a contra revenue account. Estimated sales returns appears on the income statement as a contra revenue account, and reduces the balance of sales revenue.
IX)
Bad$and$Doubtful$Debt$Expense 26
Provision$for$Bad$and$Doubtful$Accounts 26
Provison$for$Bad$and$Doubtful$Accounts 20
Trade$Receivables 20
372 Beg'balance
Actual'sales'returns 443 425 Estimated'sales'returns 354 End'balance
Provision'for'Sales'Returns
Sales&Returns 425
Provision&for&Sales&Returns 425
Provision&for&Sales&Returns 443
Trade&Receivables 443
Beginning&balance 1474 20 Account&write&off
Sales 5624 443 Actual&sales&returns
5216 Cash&collections
Ending&balance 1419
Gross&Trade&Receivables
Trade&receivables 5624
Sales 5624
Cash 5216
Trade&receivables 5216
Conclusion:
As the T-account and accompanying journal entries in IX) indicate, Pearson PLC does a passable job of making cash collections on its Trade Receivables. Using the gross trade receivable figures from part h), the trade receivable turnover for Pearson for the period ended December 31, 2009 would come out to be 3.89, effectively indicating that
Pearson collects on its average trade receivables almost four times a year. For comparison, the digital publisher Informa PLC (also headquartered in the UK with a similar market cap to Pearson PLC) had a accounts receivable turnover ratio of 4.51 in 2016A, perhaps indicating that Pearson is a touch behind industry standard in terms of collecting on receivables.
CASE STUDY FOUR
Error Adjustments to Ending Inventory
Introduction:
For this case study, a theoretical situation is presented where I am supposed to instruct an accounting student on a particular problem. I have chosen to present a situation where a particular company has taken a physical count of its inventory at period’s end yet there are still adjustments that must be made. These adjustments will be made not only to the ending inventory account, but also accounts payable and net sales ending balances.
Problem Presentation:
Dimitri Company, a manufacturer of small tools, provided the following information from its accounting records for the year ended December 31, 2017.
Inventory at December 31, 2017 based on physical
count $ 1,520,000
Accounts payable at December 31, 2017 1,200,000 Net sales (sales less sales returns) 8,150,000
Additional information is as follows.
1. Included in the physical count were tools billed to a customer f.o.b. shipping point on December 31, 2017. These tools had a cost of $31,000 and were billed at
$40,000. The shipment was on Dimitri’s loading dock waiting to be picked up by the common carrier.
2. Good were in transit from a vendor to Dimitri on December 31, 2017. The invoice cost was $76,000, and the goods were shipped f.o.b. shipping point on December 29, 2017.
3. Work in process inventory costing $30,000 was sent to an outside processor for plating on December 30, 2017.
4. Tools returned by customers and held pending inspection in the returned goods area on December 31, 20178 were not included in the physical count. On January 8, 2018 the tools costing $32,000 were inspected and returned to inventory. Credit memos totaling $47,000 were issued to the customers on the same date.
5. Tools shipped to a customer f.o.b. destination on December 26, 2017, were in transit at December 31, 2017, and had a cost of $26,000. Upon notification of receipt by the customer on January 2, 2018, Dimitri issued a sales invoice for
$42,000.
6. Goods, with an invoice cost of $27,000, received from a vendor at 5:00 p.m. on December 31, 2017, were recorded on a receiving report dated January 2, 2018.
The goods were not included in the physical count, but the invoice was included in accounts payable at December 31, 2017.
7. Goods received from a vendor on December 26, 2017, were included in the physical count. However, the related $56,000 vendor invoice was not included in accounts payable at December 31, 2017, because the accounts payable copy of the receiving report was lost.
8. On January 3, 2018, a monthly freight bill in the amount of $8,000 was received.
The bill specifically related to merchandise purchased in December 2017, one- half of which was still in the inventory at December 31, 2017. The freight charges were not included in either the inventory or in accounts payable at December 31, 2017.
The format used in the solution below was mandated by the question, and the student is instructed to prepare end-of-year adjustments for the accounts Inventory, Accounts Payable, and Net Sales.
Solution
1. For the first inventory issue, the sale of the goods should not be recorded until the goods have actually been shipped (as stipulated by f.o.b. shipping point norms).
2. Since the goods were bought f.o.b. shipping point by Dimitri and were already in transit, they should be recorded in Dimitri’s ending inventory and the accounts payable line item credited.
3. This inventory is still in process and belongs to Dimitri, so it should be included in the ending inventory balance.
4. Even thought the goods had not been inspected, they are considered returned and now a part of Dimitri’s inventory and should be recorded as thus. It will be determined later how much of the inventory is ready to be sold. Additionally, the sales from these returns will be decreased by the amount of the Sales Returns contra account in this question, $47,000.
5. F.o.b. destination shipping terms indicate that these in transit goods should still be in Dimitri’s inventory as of December 31 as they are fronting the shipping
expenses. The sale will be recorded when the goods reach the customer.
Inventory
Accounts-
Payable Net-Sales Initial-Amounts $--1,520,000.00 $--1,200,000.00 $--8,150,000.00 Adjustments@@increase-(decrease)
1 NONE NONE (40,000)
2 76,000 76,000 NONE
3 30,000 NONE NONE
4 32,000 NONE (47,000)
5 26,000 NONE NONE
6 27,000 NONE NONE
7 NONE 56,000 NONE
8 4,000 8,000 NONE
Total-Adjustments 195,000 140,000 (87,000)
Adjusted-amounts $--1,715,000.00 $--1,340,000.00 $--8,063,000.00
6. Accounts payable here is correct, yet inventory must be adjusted for the amount not included in the physical count.
7. Accounts payable must be increased here because the inventory was received.
8. Accounts payable must be credited the full $8,000 to account for the shipping costs, while ending inventory will only be adjusted for half of this amount. This is because in the perpetual inventory system, the costs of freight are tied up in the inventory of goods, and only half of the goods in question were still on company grounds as of the time of adjustment.
Conclusion:
The balance of the ending inventory account for a company has serious ramifications on the reporting of a firm’s earnings for the year of the mistake and subsequent periods. That is why it is vital a company be able to distinguish what should be included, in title, in its inventory of goods and what should not, as this balance will go into determining the cost of goods sold for the year. Overstating or understating ending inventory can have an effect not only on net income, but also on the tax provisions a company includes on its income statement and a two-year effect on retained earnings (assuming the error only occurs once, if not the impact on retained earnings can continue on into the future). While RFID technology has made tracking individual goods for larger companies much easier and more efficient, it has also allowed an increase in the volume of inventory moved to and from a warehouse.
CASE STUDY FIVE Palfinger AG
Analysis of Property, Plant, and Equipment
Introduction:
This particular case was an analysis of the property, plant, and equipment accounts for Palfinger AG, which is an Austrian manufacturer that produces heavy machinery with hydraulics for lifting, loading, and transportation. To do so, I was given certain parts of the company’s financial statements that delved into the additions, government grants, and disposals from year to year of fixed assets. Additionally, I was given information on the accumulated depreciation accounts for different fixed assets to aid in my analysis of the property, plant, and equipment. Interestingly enough, Palfinger’s accountants elected to use straight-line depreciation on the company’s plant assets.
Analysis:
I) Based on the provided description, Austrian company Palfinger seems to be in the business of producing heavy-duty equipment (including various types of cranes, forklifts, and work platforms) to be used in construction, agriculture, and basically any industry where “heavy lifting” is involved. For this reason, Palfinger would most certainly have large plant sites that would be used in the actual
manufacturing of these complex machines and vehicles. Inside some of these plants, one could draw a comparison to a modern car company’s factory that uses a substantial amount of robotics to assemble the large construction equipment; the cost of these automated builders would be included in PPE. For constructing large industrial equipment, it would also make sense for the company to include a good deal of the equipment it sells in its PPE as it would utilize forklifts and related machinery for manufacturing purposes. Obviously, for long-term factories and manufacturing sites, Palfinger would include a good deal of land in its property, plant, and equipment.
II) The number €149,990 on the balance sheet represents the value of the fixed assets listed in the question above (and more) reported at historical cost with
accumulated depreciation on the plant assets (using straight-line depreciation) already accounted for and taken out of the account. It should be noted that
Palfinger’s reporting of net long-term assets rather than using an Accumulated Depreciation account deviates from the GAAP principles which I have used up until this point. Additionally, in the notes section, Palfigner points out that if an asset from PPE is marked for sale at a later date, the fixed asset is still included in PPE although it is reported at the value at which it can be sold, less selling costs, and is no longer depreciated after the decision is made for sale. Palfinger makes no specific mention of different types of equipment in the notes to the financial statements. Instead, equipment seems to be lumped together with “fixtures and fittings” so one can guess at the functionality of the equipment Palfinger owns.
III) Sometimes, a firm must construct its own buildings and plants, and during the period of construction it would be incorrect to charge the costs of the building to the actual buildings account. These self-constructed assets would instead have their costs charged to an account, under GAAP, called Construction in Process.
Palfinger, being an Austrian company, uses the account title “Prepayment and assets under construction” to denote plant assets (usually buildings, but also equipment and other assets with long construction periods) that are currently being worked on. The reason that such assets would have no accumulated depreciation would be that they are not ready to be put into use, thus the asset’s
“useful life” has not begun and the item is not ready to begin depreciation.
Buildings and items in construction in process/assets under construction are differentiated by whether or not they are in use for the company. This
reclassification of the “Prepayment and assets under construction” in 2007 is Palfinger recognizing this total amount actually beginning to be put into the operations of the company. This reclassification is spread out amongst “Land and Buildlings”, “Plant and machinery”, and other miscellaneous equipment,
indicating that plant assets that were previously under construction had been completed and were now ready to begin their useful lives. At this point, depreciation would begin on these assets.
IV) Palfinger depreciates its property and equipment on a straight-line depreciation
method, adding a fixed amount to depreciation expense and accumulated depreciation every year. Straight-line depreciation, by definition, depreciates fixed assets on a basis of time rather than a basis of usage. With this in mind, while plant sites and buildings in use by the company would reasonably be depreciated using straight-line (due to consistent usage), the manufacturing equipment used to build the company’s inventory should instead be depreciated with a method that takes into account how often the equipment is used. The obvious benefit of using straight-line depreciation as a company would be the simplicity, efficiency, and consistency of calculating a yearly depreciation rate, while the trade-off would most certainly be an over-simplification of the actual cost allocation of what could be heavily-used equipment. The strengths of the activity method of depreciation are the weaknesses of straight-line, and vice- versa. The company must gather information on the inputs or outputs attributable to the fixed assets in question and base depreciation expense from this, which can be a timely process.
V) As explained in the notes to Palfinger’s financial statements, the renovations and value-enhancing modifications to property, plant, and equipment are capitalized and subsequently depreciated as part of the asset to which they improve or enhance. The useful life of the corresponding asset might be increased if the enhancement is substantial, and the cost of the capitalized renovation would be allocated over this new useful life. There are two alternative accounting
treatments for these enhancements. The first is the substitution approach, where the company would remove the cost of the old asset (before improvements) from its books and replace it with the cost of the new and improved asset. A second alternative, if the improvement adds to the useful life of the asset in question, is to debit the cost of the enhancement to accumulated depreciation. This method essentially recovers some of the accumulated depreciation charged to the asset.
VI) Analysis of property, plant, & equipment and accumulated depreciation:
a. The purchase of new property, plant and equipment in fiscal 2007 is €40,444.
This comes from the “additions” column but does not include self-constructed
assets.
b. Government grants would total €733 and are deducted from “Land and buildings” and “Plant and machinery.” This deduction comes from IAS 20, which allows for a company to accept nonmonetary government grants in the form of various items considered property, plant, and equipment, and the companies are allowed to deduct the value of these grants from PPE accounts.
c. The cost of the the PPE disposed in 2007 would be €13,799 with accumulated depreciation of €12,298, leading to a net book value of disposed PPE to be
€1,501.
VII) Since the cash proceeds the company received, €1655, were higher than the book value of the asset being disposed, €1501, Palfigner would recognize a gain of
€154 on its income statement. In economic terms, the company sees a
nonmonetary increase in its value because it is disposing assets at a value higher than what is recorded for the same assets in its balance sheets.
VIII) Depreciation schedules for “Other plant, fixtures, fittings, and equipment”
a.
b.
Year Depreciation,Expense Book,Value
10,673.00
€,,,,,,,,,,,,,,,,,,,,,,,,,,,,
2007 €,,,,,,,,,,,,,,,,,,,1,880.00 €,,,,,,,,,,,,,,,,,,,,,,,,,,,,,,8,793.00 2008 €,,,,,,,,,,,,,,,,,,,1,880.00 €,,,,,,,,,,,,,,,,,,,,,,,,,,,,,,6,913.00 2009 €,,,,,,,,,,,,,,,,,,,1,880.00 €,,,,,,,,,,,,,,,,,,,,,,,,,,,,,,5,033.00 2010 €,,,,,,,,,,,,,,,,,,,1,880.00 €,,,,,,,,,,,,,,,,,,,,,,,,,,,,,,3,153.00 2011 €,,,,,,,,,,,,,,,,,,,1,880.00 €,,,,,,,,,,,,,,,,,,,,,,,,,,,,,,1,273.00
Year
2007 Book+Value,+Beg+Year
Rate+on+Declining+
Balances Depreciation+Expense Accumulated+Depreciation Book+Value,+End+Year
2008 €+++++++++++++++++ 10,673.00 40% €+++++++++++++++++++ 4,269.20 €+++++++++++++++++++++++++++++++ 4,269.20 €++++++++++++++++++++++++++++ 6,403.80
2009 €+++++++++++++++++++ 6,403.80 40% €+++++++++++++++++++ 2,561.52 €+++++++++++++++++++++++++++++++ 6,830.72 €++++++++++++++++++++++++++++ 3,842.28
2010 €+++++++++++++++++++ 3,842.28 40% €+++++++++++++++++++ 1,536.91 €+++++++++++++++++++++++++++++++ 8,367.63 €++++++++++++++++++++++++++++ 2,305.37
2011 €+++++++++++++++++++ 2,305.37 40% €+++++++++++++++++++++++ 922.15 €+++++++++++++++++++++++++++++++ 9,289.78 €++++++++++++++++++++++++++++ 1,383.22
IX) Assume that the equipment from part VIII) was sold on the first day of fiscal 2008 for proceeds of €7,500. Assume that Palfinger’s accounting policy is to take no depreciation in the year of sale.
a. Assuming straight line depreciation:
Above is the journal entry Palfinger would use to record the sale of the equipment. It should be noted that the proceeds from the sale were lower than the book value of the equipment, resulting in a loss on the income statement from the disposition of the assets. As the Equipment, Accumulated
Depreciation, and Cash accounts are all asset accounts, the effect on the income statement for Palfinger would be the loss on the disposal and the depreciation expense recognized in 2007, which take away from the company’s net income by a combined amount of €3,173. However, no
information is provided about the revenue from operations that this equipment brought about so the income statement effect of the asset may be farther reaching than this.
b. Assuming double-declining balance depreciation
The journal entry to record the sale of equipment is shown above. The most obvious change from the sale under the assumptions of j.i. is that the use of double-declining method of depreciation sees the company realize a gain on the disposition of the equipment as the book value is much lower after the first year than under straight-line depreciation. This gain is offset by the deprecation expense that would have been recognized in 2007, totaling €4,269.20. When the
Cash 7500
Accumulated0Depreciation 1880
Loss0on0disposal 1293
Equipment 10673
Cash 7500
Accumulated0Depreciation 4269.2
Gain0on0disposal 1096.2
Equipment 10673
two numbers are added, the net loss due to depreciation and disposition of the equipment comes out to be €3,173, which is the exact same amount as would have been expensed under the straight-line depreciation method.
c. The first year’s income statement would see a lower net income under the double-declining balance method, as more cost of the asset is allocated at an earlier date, raising depreciation expense. The next year, the depreciation expense is lower for double-declining balance and straight-line depreciation expense remains the same. As I stated above, the net “loss” after the sale would ultimately be the same on the books as the gain seen from double-declining balance method would ultimately be offset by the higher depreciation expense in the first two years.
Conclusion:
As I mentioned in the introduction, the accountants employed by Palfinger AG elected to use straight-line depreciation to allocate the costs of the company’s various plant assets. I thought this was interesting to the point of erroneous, as one would believe a
manufacturing company such as Palfinger would want to use an activity method of depreciation. Such a method of depreciation would see the cost of fixed assets be dispersed with the main driver being production or hours used, rather than the time assumption utilized by straight-line depreciation. This would allow for heavy equipment to be depreciated on the basis of its usage, with a highly-used machine being depreciated more rapidly. Just like the case that involved the publishing company Pearson, I find it interesting to look at the accounting methods employed internationally. One such difference was noted in the questions above, as self-constructed assets (which are capitalized in the Construction in Process account in America) for Palfinger are debited to the “Prepayments and assets under construction” account, which harkens back to the
“Provision for bad and doubtful accounts” utilized by Pearson.
CASE STUDY SIX Volvo Group
Analysis of Research and Development
Introduction:
Research and development is a very necessary evil for any manufacturer that looks to seriously compete, especially in the saturated market that is automobile sales. Continuing with the theme of the previous case, I look here at a foreign-based company in the Volvo Group with the focus being on the way its accounting department handles the costs of research and development. The majority of R&D costs are expensed under FASB, while Volvo is headquartered in Sweden and thus follows the principles of IAS, which is shown in the following questions.
I) According to IAS 38, any expenditures that will reasonably produce future economic benefit or revenues such as new production methods, newly-designed software, and new products will be capitalized as an intangible asset. The research and developments that fail to meet the criteria of economic feasibility are charged to income as an expense, however. Thus, the costs included in the SEK 13,193 would be expenditures in the research of new potential (yet ultimately scrapped) products and new models of software or systems that did not have high enough functionality to be put into use by Volvo. This could include new but flawed navigation systems for its cars or automated manufacturing units that ended up being discontinued. It should be noted that no intangible asset arising from Research can be capitalized, so the costs of this RnD expense account will be projects that were fairly far along in their design.
II) There is a fine line drawn in IAS 38 between Research expenditures and Development expenditures. Costs related to the research phase will never be capitalized and are always expensed, and if a company is unable to differentiate costs between research and development the entirety of the expenditures will be expensed. Even if an intangible asset is considered to be in the development phase of its lifecycle, it must past a few criteria set down by IAS 38 in order to be capitalized. Volvo must first consider the technical feasibility of the potential asset, or, in other words, if it works well enough to be used internally or sold to customers. Volvo must also have the intention of using or selling the asset, and
must have the ability to do so. Most importantly of the factors considered by Volvo, however, is if the asset will produce economic benefits in the future. An example of an asset in the development phase for Volvo would be a new, lightweight chassis (a prototype) or new paint for its vehicles.
III) For an intangible asset such as design costs of new software, a company like Volvo must make a decision on the period it sees capitalized research and development expenses amortized. For RnD that has to do with software
development, the most obvious choice for an amortization period would be the average life of related software before they are effectively rendered obsolete by new systems. This would effectively give a useful life to what is considered an intangible asset. With Moore’s Law in play, Volvo most likely has to reduce the period of amortization for these product and software development costs as the time for a product to become obsolete gets shorter and shorter all the time.
IV) I honestly believe that the IFRS guidelines for research and development costs make more logical sense than those of U.S. GAAP. I like the fact that IAS calls for a company to separate what it considers research costs and costs of actual development. By capitalizing development costs, a company is quite literally making an “investment” in this new intangible asset, while expensing research allows for the vast majority of projects that do not actually make it to
development to be quickly accounted for. It could be argued that not all intangible assets in development will not all be put in to use or sale by the company, thus capitalizing them will overstate the functioning assets of a company. However, I believe that if a design team is far along enough in a project, there will at least be residual benefits from the project even if it is scrapped. Thus, it is worth adding to the value of the balance sheet.
V) The amount of capitalized product and software costs, net of accumulated depreciation of SEK 13,739, is SEK 11,409. This value is included with other
assets in the “Intangible asset” line item on the balance sheet.
VI) Volvo’s Product and software development intangible asset
a. In 2007, Volvo capitalized 19.12% of total R&D costs and 15.77% and 15.2%
for 2008 and 2009 respectively.
VII) The following information relates to Navistar for fiscal year end October 31, 2007 through 2009.
Beginning&balance 12381 3126 Amortized
Amounts&Capitalized 2602 448
Ending&Balance 11409
Capitalized&Product&and&Software,&Net
(in$SEK$millions) 2007 2008 2009
Product$and$software$
develompent$costs$capitalized$ 2057 2150 1858
Total$R&D$expense$on$the$income$
statement 11059 14348 13193
Amortization$of$previously$
capitalized$costs$(included$in$R&D$
expense) 2357 2864 2830
Total$R&D$costs$incurred$during$
the$year$=$1$+$2$O3 10759 13634 12221
a.
b. The relationship for Navistar between total R&D costs and net sales comes out to be 3.18%, while this same relationship for Volvo is calculated as 6.04%. Obviously, the figure for Volvo is almost double that of Navistar.
Navistar is an American company, which, if following GAAP, must expense all research and development costs; the discrepancy between the two numbers could stem from Volvo simply spending more relative money on research and development or from Navistar capitalizing more of these costs because they reach a marketable product. The nature of these two companies products might also help to understand the difference between the percentages, as Navistar is a holding group for manufacturers of commercial and school buses, which, on average, would require less R&D than personal automobiles that must continuously be updated year to year in order to keep up with competitors.
Conclusion:
The idea of assigning the correct balance sheet or income statement location to the development of an intangible asset is inherently a tricky problem for accountants.
That is why the policy on such matters vary across the globe, with IFRS and GAAP having different means and tests to properly expense or capitalize these research and development costs. While FASB seems to have a three phase test for capitalizing these assets, as I said, I believe the simplicity of the IAS standards makes a good deal of sense.
Differentiating these costs on the basis of research and then development makes sense, as projects that are in the development phase are much more likely on their way to
becoming revenue-producing assets.
(in$SEK$millions) 2007 2008 2009
Net$Sales,$Industrial$Operations 276,795 294,932 208,487 Total$Assets,$from$Balance$Sheet 321,647 372,419 332,265
CASE STUDY SEVEN Data Analytics Tool Analysis
Introduction:
In today’s business world and the era of Big Data, to be up to date on accounting
information systems is to fall behind; companies should see information technology as a continuously updated process that it should always seek to improve. Microsoft
applications and software suites are some of the best on the market, which means it comes as no surprise that they are so widely used in the business world. For the purposes of data analytics and the necessity to make useful business decisions from incredibly diverse and voluminous data, Microsoft provides Power BI for a number of different devices.
History and Purpose of the Microsoft Power BI
Microsoft Power BI is a cloud-based service that allows for data visualization for firms to critique and analyze data in more understandable formats. Power BI can connect to a multitude of big data sources and pull valuable data from them; it then presents this data in a form that a company or individual using Power BI could use to recognize pertinent trends and even make business decisions. The integration of data sources is a large part of what makes Power BI a widely known data analytics tool; the tool can draw data from local and foreign excel spreadsheets, in-house databases, and even other cloud- based sources. Digital dashboards included in Power BI allow for a firm to track key processes and provides indicators and alerts when anomalies occur. Power BI allows for queries in a manner similar to traditional database management systems, although the process is simplified and streamlined as users can ask questions in natural language, such as “Show me accounts receivable by customer”. Also in the vein of traditional databases, Power BI allows businesses to create UML diagrams with the associations mapped to various resources, agents, and events in their business model. The number of data visualization models included in Power BI is vast, and the software allows for users or firms to upload their own custom visualizations. A firm may not find any of the built-in visualizations (bar graphs, heat maps, matrices, KPIs, etc.) useful for its decision-making purposes and may need to utilize measures and tables of their own design.
Power BI originally was titled “Project Crescent” when it was first designed by Ron George 2010 and was available for public download in July. Power BI would get its