Chapter 3
Documenting Accounting Information Systems
INTRODUCTION
WHY DOCUMENTATION IS IMPORTANT DOCUMENT AND SYSTEM FLOWCHARTS Document Flowcharts
Guidelines for Drawing Document Flowcharts System Flowcharts
Guidelines for Drawing System Flowcharts
PROCESS MAPS AND DATA FLOW DIAGRAMS Process Maps
Guidelines for Drawing Process Maps Data Flow Diagrams
Guidelines for Drawing Data Flow Diagrams OTHER DOCUMENTATION TOOLS Program Flowcharts
Decision Tables
Software Tools for Graphical Documentation and SOX Compliance
END-USER COMPUTING AND DOCUMENTATION
The Importance of End-User Documentation
Policies for End-User Computing and Documentation AIS AT WORK—FLOWCHARTS HELP RECOVER EMBEZZLED ASSETS
SUMMARY
KEY TERMS YOU SHOULD KNOW TEST YOURSELF
DISCUSSION QUESTIONS
PROBLEMS CASE ANALYSES The Berridge Company FreezeTime, Inc.
The Dinteman Company Lois Hale and Associates
REFERENCES AND RECOMMENDED READINGS
ANSWERS TO TEST YOURSELF
After reading this chapter, you will:
1. Understandwhy documenting an AIS is impor- tant.
2. Be able to draw simple document flowcharts and explain how they describe the flow of data in AISs.
3. Be able to drawsimple document flowcharts, system flowcharts, process maps, and data flow diagrams.
4. Know how program flowcharts and decision tables help document AISs.
5. Be able to explainthe importance of end-user documentation.
6. Be aware of software available for document- ing AISs and helping companies comply with the Sarbanes-Oxley Act.
73
‘‘Although documentation of [business] processes needs to be detailed, it also must be clear and easy to follow. . . .If people cannot easily explain it, or someone can’t pick up the documentation and understand it, you have not successfully completed the task.’’
Regina Baraban, ‘‘Look Out for SOX’’Meetingsnet.com Vol. 24, No. 2, (February 2005), pp. 23 – 24.
INTRODUCTION
Documentation explains how AISs operate and is therefore a vital part of any accounting system. For example, documentation describes the tasks for recording accounting data, the procedures that users must perform to operate computer applications, the processing steps that AISs follow, and the logical and physical flows of accounting data through the system.
This chapter explains in greater detail why accountants need to understand documentation and describes some tools for diagramming complex systems.
Accountants can use many different types of logic charts to trace the flow of accounting data through an AIS. For example, document flowcharts describe the physical flow of order forms, requisition slips, and similar hard-copy documents through an AIS. These flowcharts pictorially represent data paths in compact formats and therefore save pages of narrative description. System flowcharts are similar to document flowcharts, except that system flowcharts usually focus on the electronic flows of data in computerized AISs. Other examples of documentation aids include process maps, data flow diagrams, program flowcharts, and decision tables. This chapter describes all of these documentation aids, as well as some computerized tools for creating them.
Today, many end users develop computer applications for themselves. This end-user programming is very helpful to managers, who consequently do not require IT professionals to develop simple word processing, spreadsheet, or database applications. But end-user programming can also be a problem because many employees do not know how to document their work properly or simply don’t do so. The final section of this chapter examines the topic of end-user programming and documentation in greater detail.
WHY DOCUMENTATION IS IMPORTANT
Accountants do not need to understand exactly how computers process the data of a partic- ular accounting application, but it is important for them to understand the documentation that describes how this processing takes place. In fact a recent survey of practitioners found that system documentation has become increasingly important as organizations seek to better understand their own business processes and also comply with legislation that requires this understanding, such as the Sarbanes-Oxley Act.1 Documentationincludes all the flowcharts, narratives, and other written communications that describe the inputs,
1Bradford, Marianne, Sandra B. Richtermeyer, and Douglas F. Roberts, ‘‘System Diagramming Techniques: An Analysis of Methods Used in Accounting Education and Practice,’’Journal of Information SystemsVol. 21, Iss. 1 (Spring 2007), p. 173.
processing, and outputs of an AIS. Documentation also describes the logical flow of data within a computer system and the procedures that employees must follow to accomplish application tasks. Here are nine reasons why documentation is important to AISs.
1. Depicting how the system works. Simply observing large AISs in action is an impractical way to learn about them, even if they are completely manual. In computerized systems, this task is impossible because the processing is electronic and therefore invisible.
On the other hand, studying written descriptions of the inputs, processing steps, and outputs of the system make the job easier, and a few graphs or diagrams of these processing functions makes things easier still. This is one purpose of documentation—to help explain how an AIS operates. Documentation helps employees understand how a system works, assists accountants in designing controls for it, and gives managers confidence that it will meet their information needs.
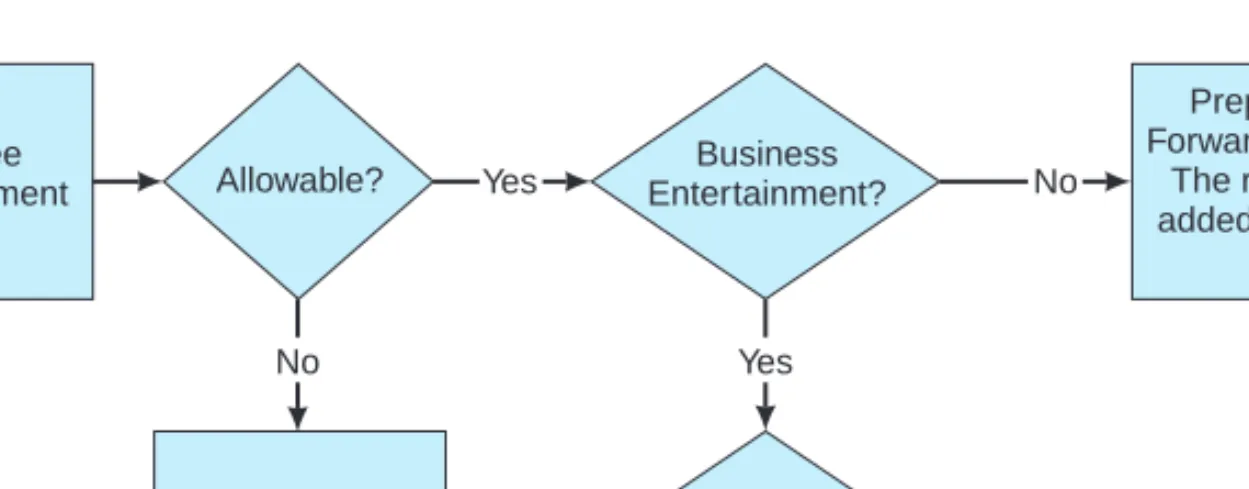
The Internet contains many examples of flowcharts or logic diagrams that help individuals understand unfamiliar tasks or processes. For example, some universities use them to show students what classes to take and when they should take them to complete their majors in a timely manner. The University of Washington has flowcharts that show how to obtain grants and other types of funding. The University of Illinois at Urbana-Champaign uses elaborate diagrams to depict what happens when a faculty member’s employment terminates. Figure 3-1 is a logic diagram from the University of Arizona website that shows employees how to file a claim for reimbursement. If the employee would like additional information for any step in the process, a click of the mouse on the appropriate flowchart symbol reveals additional information.
2. Training users. Documentation also includes the user guides, manuals, and similar operating instructions that help people learn how an AIS operates. Employees usually do not like to read the user manuals that typically accompany application software, but these instructional materials are invaluable reference aids when they are needed. Whether distributed manually in hard-copy format or electronically in the familiar Help files or
‘‘get-started tours’’ of microcomputer applications, these documentation aids help train users to operate AIS hardware and software, solve operational problems, and perform their jobs better.
Employee Reimbursement
Explore Other Reimbursement
Possibilities.
Prepare Check Request Forward to Accounts Payable.
The reimbursement will be added to the employee's net
pay.
Allowable? Yes
Yes
Yes No
No
Business No Entertainment?
Local Account?
NOTE: Employee reimbursement must be signed by the employee and the
employee's supervisor, except at the dean and vice president level and above.
FIGURE 3-1 Example of a flowchart used at the University of Arizona to help employees file a reim- bursement claim. For additional information, individuals simply click on the appropriate symbol.
3. Designing new systems. Documentation helps system designers develop new systems in much the same way that blueprints help architects design buildings. For example, professional IT personnel commonly hold structured walkthroughs in which they review system documentation to ensure the integrity and completeness of their designs, and to identify design flaws. Well-written documentation, along with other systems-design methodologies, often plays a key role in reducing systems failures and decreasing the time spent correcting ‘‘emergency errors’’ in computer systems. Conversely, poorly-designed systems usually lead to critical mistakes and expensive write-offs.
4. Controlling system development and maintenance costs. Personal com- puter applications typically employ prewritten, off-the-shelf software that is relatively reliable and inexpensive. In contrast, custom-developed business systems often cost mil- lions of dollars and can be less reliable. Good documentation helps system designers developobject-oriented software, that is, programs that contain modular, reusable code.
This object-orientation helps programmers avoid writing duplicate programs and facilitates changes when programs must be modified later. If you have ever replaced a specialized part in your car, you have some idea of how frustrating, time-consuming, and expensive
‘‘non-standardization’’ can be, and therefore how useful object-oriented programming might be to business organizations.
5. Standardizing communications with others. The usefulness of narrative descriptions can vary significantly, and a reader can interpret such descriptions differ- ently from what the writer intended. Documentation aids such as system flowcharts or data flow diagrams are standard industry tools, and they are more likely to be interpreted the same way by all parties viewing them. Thus, documentation tools are important because they help describe an existing or proposed system in a ‘‘common language’’ and help users communicate with one another about these systems.
Case-in-Point 3.1 The fourth largest public healthcare system in the United States, Carolinas HealthCare System (CHS), uses business process management software from Staffware to automate and streamline its revenue cycle processes and improve customer service for their patients and doctors. As a result of using this software, CHS can now service patient accounts much faster and has increased the speed and accuracy of their billing office operations.2
6. Auditing AISs. Documentation helps depict audit trails. When investigating an AIS, for example, the auditors typically focus on internal controls. In such circumstances, documentation helps auditors determine the strengths and weaknesses of a system’s controls, and therefore the scope and complexity of the audit. Similarly, the auditors will want to trace sample outputs to the original transactions that created them (e.g., tracing inventory assets back to original purchases). System documentation helps auditors perform these tasks.
7. Documenting business processes. Accounting systems automatically create a record of some organization’s processes because they capture financial data as they occur.
A study of these processes can lead to better systems. Thus, in mapping these processes, documentation can help managers better understand the ways in which their businesses
2‘‘Carolinas HealthCare System Uses Staffware Software to Streamline Business Processes,’’Business WireFebruary 23, 2004, p. 53.
operate, what controls are involved or missing from critical organizational activities, and how to improve core business processes.
8. Complying with the Sarbanes-Oxley Act. Section 404 of the Sarbanes-Oxley Act of 2002 (SOX) requires publicly-traded companies to identify the major sources of business risks, document their internal control procedures, and hire external auditors to evaluate the validity and effectiveness of such procedures. Documentation is therefore crucial for analyzing the risks of errors, frauds, omissions, and similar mistakes in important business processes, as well as helping auditors evaluate the controls used to mitigate such risks—i.e., some of the major tasks required by SOX.
Almost everyone acknowledges that the costs of complying with SOX are enormous, and many also believe that SOX gave documentation ‘‘a new life.’’ To save money, many companies now use software packages to help them automate SOX documentation tasks.
We describe some examples of such software in a later section of this chapter.
Case-in-Point 3.2 FirstEnergy Corporation in Akron, Ohio, generates and distributes electrical energy to customers in a 36,100-square-mile area of Ohio, Pennsylvania, and New Jersey. Certus Governance Suite, a software package, helps company managers comply with many SOX documentation requirements, better understand the company’s internal controls, and saves ‘‘looking at hundreds of spreadsheets.’’3
9. Establishing accountability. Manual signatures on business and government documents allow employees and government agents to execute their responsibilities, create audit trails, and establish accountability for their actions. An example is asigned checklistthat outlines the month-end journal entries an accountant must perform. Such checklists verify that the accountant performed these tasks, that a reviewer approved them, and that both individuals are accountable for the accuracy of the work. Similar comments apply to the checklists for preparing financial statements, tax returns, auditing papers, budgets, and similar accounting documents. Including such checklists with the statements themselves both documents the work that the employees performed as well as the procedures and controlsinvolvedin the work.
Case-in-Point 3.3 In a parallel universe, the master accountant for the great warlord took on an apprentice. One day, the apprentice approached his mentor and asked ‘‘Master, is it always necessary to document accounting systems?’’
The master accountant answered ‘‘No. Such documentation is only needed by those who cannot feel the complete tao and beauty of such systems.’’
The apprentice replied ‘‘Whocan feel such beauty?’’
The master accountant responded ‘‘I do not know anyone with such abilities.’’
DOCUMENT AND SYSTEM FLOWCHARTS
Despite the many reasons why documentation is important, most organizations find that they document less than they should. One explanation for this deficiency is that orga- nizations often create or implement large AISs under tight deadlines. In such cases, the urgency to develop ‘‘a system that works’’ overrides the need for ‘‘a system that
3Thomas Hoffman, ‘‘Calibrating Toward Compliance’’ Computerworld Vol. 40, No. 6 (February 6, 2006), pp. 21– 24.
is well-documented.’’ Another reason is that most IT professionals much prefer cre- ating systems to documenting them. Thus, many developers actively resist it, arguing that they will ‘‘get around to it later’’ or that documenting is a job for non-existent assistants.
The record suggests that insufficient or deficient documentation costs organizations time and money and that good documentation is as important as the good software it describes. What tools are available to document AISs? Two examples are document flowcharts and system flowcharts.
Document Flowcharts
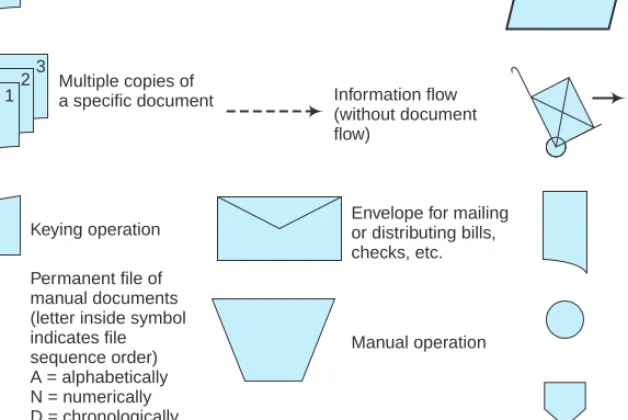
A document flowchart traces the physical flow of documents through an organization—i.e., from the departments, groups, or individuals who first create them to their final dispositions. Figure 3-2 illustrates common document flowcharting symbols, and the examples below illustrate how to use them to create simple document flowcharts.
Constructing a document flowchart begins by identifying the different departments or groups that handle the documents of a particular system. The flowcharter then uses the symbols in Figure 3-2 to illustrate the document flows. Let us first examine two simple cases and then discuss some general flowcharting guidelines.
123
Document
Multiple copies of a specific document
Keying operation
Manual operation
On-page connector between two points on a flowchart Off-page connector between two points on a flowchart
Electronic data communication Annotation symbol for comments or further descriptions Adding machine tape total utilized for batch control Flow of physical goods (inventory, etc.)
Journal or ledger
Envelope for mailing or distributing bills, checks, etc.
Information flow (without document flow)
Document flow
Permanent file of manual documents (letter inside symbol indicates file sequence order) A = alphabetically N = numerically D = chronologically (year, month, day) A
FIGURE 3-2 Common document flowcharting symbols.
Example 1. Your boss asks you to document the paperwork involved in acquiring office supplies from your company’s Central Supplies Department. Your administrative assistant explains the process as follows:
Reordering supplies requires a requisition request. When I need more stationery, for example, I fill out two copies of a goods requisition form (GRF). I send the first copy to central supplies and file the second copy here in the office.
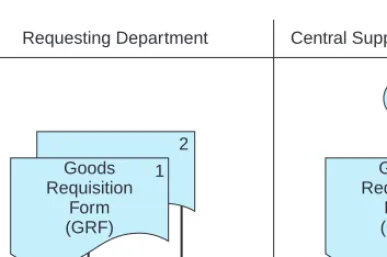
There are two departments involved in this example—your department (which we shall call the Requesting Department) and the Central Supplies Department. Thus, you should begin by naming these departments in headings on your document flowchart (Figure 3-3). Next, you draw two copies of the GRF under the heading for the Requesting Department because this is the department that creates this form. You number these copies 1 and 2 to indicate two copies.
Finally, you indicate where each document goes: copy 1 to the Central Supplies Department and copy 2 to a file in the Requesting Department. A document’s first appearance should be in the department that creates it. A solid line or the on-page connectors shown here indicates its physical transmittal from one place to another. You should then redraw the transmitted document to indicate its arrival at the department that receives it. Figure 3-3 illustrates the completed flowchart for this narrative.
Example 2. Let us now consider a slightly more complex example—the task of hiring a new employee at your company. The process begins when a department develops a vacancy. The Human Resources (HR) director explains the process as follows:
The department that develops a vacancy must first complete a job vacancy form, which it forwards to my department. We then advertise for the position and, with the help of the requesting department, interview applicants. When the vacancy is filled, the HR Department prepares a position hiring form (PHF) in triplicate. We file the first copy in a manual file, which is organized by employee Social Security
Requesting Department
Goods Requisition
Form (GRF)
1
A
File
Central Supplies Department
Goods Requisition
Form (GRF)
1 2
A
FIGURE 3-3 A simple document flowchart.
number. We staple the third copy to the job vacancy form and return it to the Requesting Department, where clerks file it alphabetically by employee last name.
The HR Department forwards the second copy of the PHF to the Payroll Department. The Payroll Department uses the form as an authorization document to create a payroll record for the new employee. Thus, the information on the form is keyed directly into the company’s computer system using an online terminal located in the payroll office. This copy of the PHF is then filed numerically for reference and also as evidence that the form has been processed.
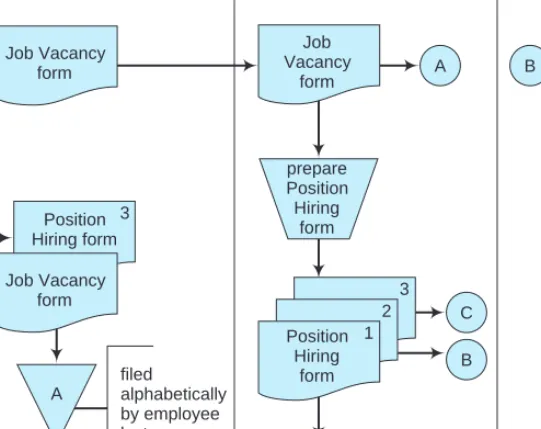
Figure 3-4 is a document flowchart for this example. To draw it, your first step is the same as before—to identify the participants. In this case there are three of them: (1) the department with the job vacancy (i.e., the Requesting Department in Figure 3-4), (2) the Human Resources Department, and (3) the Payroll Department. You identify each of these departments in separate columns at the top of the document flowchart.
Your next step is to identify the documents involved. There are two major ones:
(1) the Job Vacancy form, which we presume is prepared as a single copy, and (2) the Position Hiring form, which we are told is prepared in triplicate. In practice, multiple-copy forms are usually color-coded. However, in document flowcharts, usually these are simply numbered and a separate page is attached to explain the color-number equivalencies.
Your third step is to indicate where the documents are created, processed, and used. This is probably the most difficult task, and a document flowchart designer must often use considerable ingenuity to represent data flows and processing activities
Requesting Department Human Resources Payroll Department
B A
C B
Position 2 Hiring form
Position 2 Hiring
form key data using online terminal
N N
Job Vacancy
form
Job Vacancy form Job Vacancy
form
prepare Position Hiring
form
3 3
2 Position 1
Hiring form Position
Hiring form
filed by employee Social Security number A
filed
alphabetically by employee last name A
C
FIGURE 3-4 A document flowchart illustrating the flow of documents involved in the hiring of a new employee.
accurately. Figure 3-4 illustrates these flows for the hiring procedures just described.
Where there are a large number of document transmittals, you can use on-page connectors (circles) to connect document flows from one place on a page to another and avoid complicated flow lines. Thus, Figure 3-4 uses several on-page connectors (with letters A, B, and C) to avoid cluttering the drawing and shows the completed document flowchart.
You should use a unique identifier in each connector (such as a letter) for identification purposes. You can also use off-page connectors (to connect data flows to other pages) if necessary.
Guidelines for Drawing Document Flowcharts
Document flowcharts concentrate on the physical flow of reports and similar documents.
When constructing them, some analysts also include any movement of physical goods in their document flowcharts—e.g., moving inventory from a receiving department to an inventory storeroom. (Document flowcharts typically use hand-truck symbols for this task.) Some document flowcharts also illustrate information flows that do not involve documents (for example, a sales clerk telephoning to check a customer’s account balance before approving a credit sale). Thus, the term ‘‘document’’ broadly includes all types of organizational communications and data flows.
Unlike other types of symbols—for example, the system and program flowcharting symbols discussed later in this chapter—document flowcharting symbols are not standard- ized. But even though creating document flowcharts is more an art than a science, you can use the following guidelines to make these flowcharts clearer.
1. Identify all the departments that create or receive the documents involved in the system. Use vertical lines to create ‘‘swim lanes’’ to separate each department from the others.
2. Carefully classify the documents and activities of each department, and draw them under their corresponding department headings.
3. Identify each copy of an accounting document with a number. If multiple-copy documents are color-coded, use a table to identify the number-color associations.
4. Account for the distribution of each copy of a document. In general, it is better to over-document a complicated process than to under-document it.
5. Use on-page and off-page connectors to avoid diagrams with lines that cross one another.
6. Each pair of connectors (a ‘‘from’’ and a ‘‘to’’ connector in each pair) should use the same letter or number.
7. Use annotations if necessary to explain activities or symbols that may be unclear. These are little notes to the reader that help clarify your documentation.
8. If the sequence of records in a file is important, include the letter ‘‘A’’ for alphabetical,
‘‘N’’ for numeric, or ‘‘C’’ for chronological in the file symbol. As indicated in guideline 7, you can also include a note in the flowchart to make things clearer.
9. Most employees reference forms with acronyms (e.g., GRF or PHF in the preceding examples). To avoid confusion, use full names (possibly with acronyms in parentheses) or create a table of equivalents to ensure accuracy in identifying such forms.
10. Consider using automated flowcharting tools. See the section of this chapter on CASE tools.
Case-in-Point 3.4 Accountants disagree about the usefulness of document flowcharts rel- ative to other documenting tools, but one manuscript reviewer of this book wrote: ‘‘Flowcharting is one of the most essential skills, in my opinion, for a student to learn in a systems course.
During my tenure at a CPA firm, I had the opportunity to document several accounting infor- mation systems, and document flowcharting was the key skill. When word got around the office that I was a good flowcharter, I got placed on more important clients, furthering my career.’’
System Flowcharts
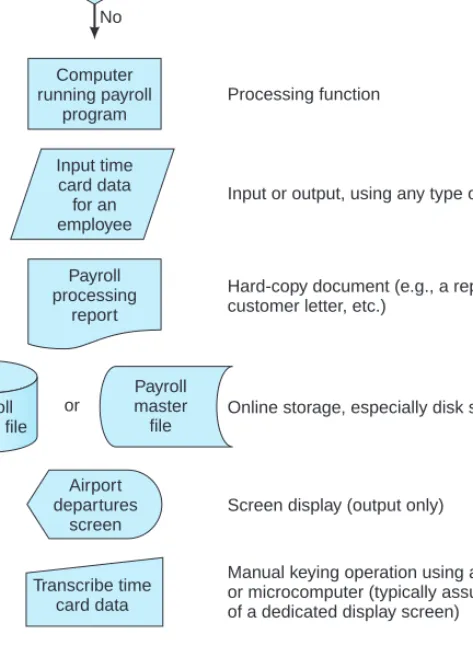
Whereas document flowcharts focus on tangible documents,system flowchartsconcen- trate on the computerized data flows of AISs. Thus, a system flowchart typically depicts the electronic flow of data and processing steps in an AIS. Figure 3-5 illustrates some common
Terminator (start or stop)
Decision point Yes
No Start
Processing function Computer
running payroll program
Hard-copy document (e.g., a report, payroll check, customer letter, etc.)
Online storage, especially disk storage
Screen display (output only)
Communications link (e.g., a satellite connection)
Annotation symbol (contains notes and explanations)
Manual keying operation using an online terminal or microcomputer (typically assumes the presence of a dedicated display screen)
Payroll processing
report
or
Input or output, using any type of medium or data Input time
card data for an employee
Payroll master file
Payroll master file Hours
>=40?
Airport departures
screen
Transcribe time card data
Time card must be signed by
supervisor
FIGURE 3-5 Some common system and programming flowcharting symbols.
system flowcharting symbols. Most of these symbols are industry conventions that have been standardized by the National Bureau of Standards (Standard ×3.5), although addi- tional symbols are now necessary to represent newer data transmission technologies—for example, wireless data flows.
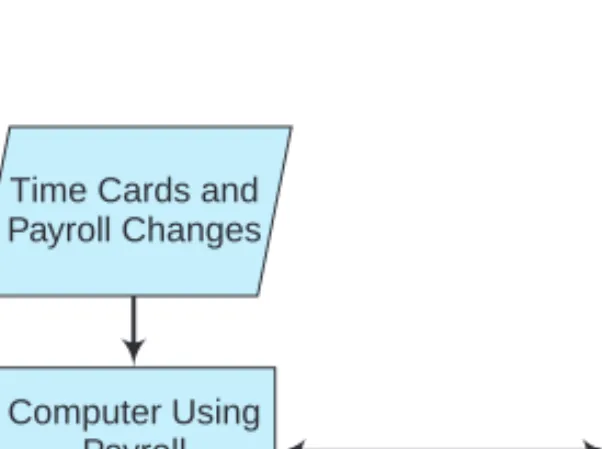
Some system flowcharts are general in nature and merely provide an overview of the system. Theseare high-level system flowcharts. Figure 3-6 is an example. The inputs and outputs of the system are specified by the general input and output symbol, a parallelogram.
In more detailed system flowcharts, the specific form of these inputs and outputs would be indicated—for example, by magnetic disk symbols.
Figure 3-6 refers to only one process—preparing a payroll. A more detailed system flowchart would describe all the processes performed by the payroll program and the specific inputs and outputs of each process. At the lowest, most-detailed level of such doc- umentation are program flowcharts that describe the processing logic of each application program. We will examine program flowcharts later in this chapter.
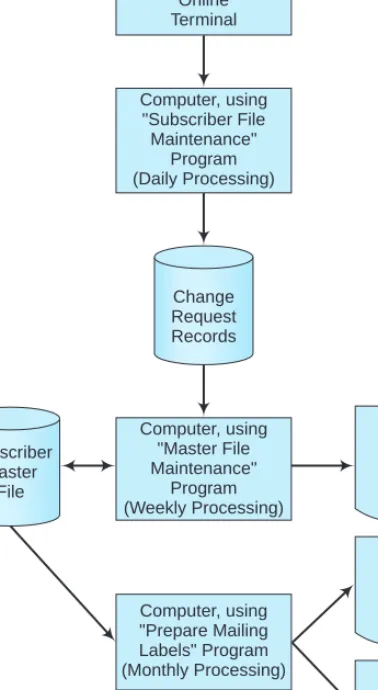
Like document flowcharts, the process of drawing system flowcharts is probably best understood by studying an illustration. Figure 3-7 is a system flowchart for the following example.
The Sarah Stanton Company is a magazine distributor that maintains a file of mag- azine subscribers for creating monthly mailing labels. Magazine subscribers mail change-of-address forms or new-subscription forms directly to the company, where input personnel key the information into the system through online terminals. The computer system temporarily stores this information as a file of address-change or new-subscription requests. Clerical staff keys these data into computer files continuously, so we may characterize it as ‘‘daily processing.’’
Once a week, the system uses the information in the daily processing file to update the subscriber master file. At this time, new subscriber names and addresses are added to the file, and the addresses of existing subscribers who have moved are changed. The system also prepares a Master File Maintenance Processing Report to indicate what additions and modifications were made to the file. Once a month, the company prepares postal labels for the magazine’s mailing. The subscriber master file serves as the chief input for this computer program. The two major outputs are the labels themselves and a Mailing Labels Processing Report that documents this run and indicates any problems.
Paychecks and Reports Computer Using
Payroll Program Time Cards and Payroll Changes
Payroll Master File
FIGURE 3-6 A high-level system flowchart for payroll processing.
New Subscriber Forms Subscriber Address Change
Request Forms
Online Terminal
Computer, using
"Subscriber File Maintenance"
Program (Daily Processing)
Change Request Records
Subscriber Master
File
Computer, using
"Master File Maintenance"
Program (Weekly Processing)
Master File Maintenance
Processing Report
Mailing Labels Processing
Report
Subscriber Mailing Labels Computer, using
"Prepare Mailing Labels" Program (Monthly Processing)
FIGURE 3-7 A system flowchart illustrating the computer steps involved in maintaining a subscriber master file and creating monthly mailing labels.
The system flowchart in Figure 3-7 documents the flow of data through the company’s computerized system. Thus, it identifies sources of data, the places where data are temporarily stored, and the outputs on which processed data appear. In Figure 3-7, for example, the system flowchart begins with the subscriber request forms and documents the flow of data on these forms through the keying phase, master-file-maintenance phase, and finally, the monthly mailing phase.
Indirectly, system flowcharts also indicate processing cycles (daily, weekly, or monthly), hardware needs (e.g., disk drives and printers), areas of weak or missing application controls, and potential bottlenecks in processing (e.g., manual data entry).
In Figure 3-7, we can also identify the major files of the system (a temporary log file of change-request records and a subscriber master file) and the major reports of the system.
Finally, note that each processing phase of a system flowchart usually involves preparing one or more control reports. These reports provide processing-control information (e.g., counts of transactions processed) for control purposes and exceptions information (e.g., the identity of unprocessed transactions) that helps employees correct the errors detected by the system.
Guidelines for Drawing System Flowcharts
System flowcharts depict an electronicjob streamof data through the various processing phases of an AIS, and therefore also illustrate audit trails. Each time the records of a file are sorted or updated, for example, a system flowchart should show this in a separate processing step. Generally speaking, this is the way processing proceeds in almost all AISs, one step at a time, and is therefore the way system flowcharts must portray processing phases. In recognizing the usefulness of system flowcharts, both the American Institute of Certified Public Accountants (AICPA) and the Institute of Management Accountants (IMA) consistently include test questions in their professional examinations, which require a working knowledge of system flowcharts.
Although no strict rules govern exactly how to construct a system flowchart, the following list provides some guidelines.
1. System flowcharts should read from top to bottom and from left to right. In drawing or reading such flowcharts, you should begin in the upper-left corner.
2. Because system flowcharting symbols are standardized, you should use these symbols when drawing your flowcharts—do not make up your own.
3. A processing symbol should always be found between an input symbol and an output symbol. This is called thesandwich rule.
4. Use on-page and off-page connectors to avoid crossed lines and cluttered flowcharts.
5. Sketch a flowchart before designing the final draft. Graphical documentation software tools (discussed shortly) make this job easier.
6. Add descriptions and comments in flowcharts to clarify processing elements. You can place these inside the processing symbols themselves, include them in annotation symbols attached to process or file symbols, or add them as separate notes on your system’s documentation.
PROCESS MAPS AND DATA FLOW DIAGRAMS
Like system and document flowcharts, process maps and data flow diagrams (DFDs) document the flow of data through an AIS. We examine both types of diagrams in this section of the chapter.
Process Maps
A business process is a natural group of business activities that create value for an organization.Process mapsdocument business processes in easy-to-follow diagrams. Did you understand the logic diagram in Figure 3-1 at the beginning of the chapter? It’s an example of a process map. Studies suggest that process maps are among the easiest to draw and are also among the easiest for novices to follow.
In businesses, a major process is usually the sales or order fulfillment process. A process map for this process (Figure 3-8) shows such activities as customers placing orders, warehouse personnel picking goods, and clerks shipping goods. Managers can create similar maps that show just about any other process—for example, depict how an organization processes time cards for a payroll application, how a business responds to customer returns, or how a manager deals with defective merchandise.
Case-in-Point 3.5 Increased competition and tighter profit margins have forced companies to look for places where they might be able to save money. One large accounting firm has used process mapping software to assist clients in evaluating and redesigning their business processes. For example, the firm’s business reengineering practice helped a financial services company cut its costs and become more efficient. The company was able to cut in half the time it took to approve a loan—and it needed 40% fewer staff to do it.
Internal and external auditors can use process maps to help them learn how a department or division operates, assist them in documenting what they have learned, and help them identify internal control weaknesses or problems in existing operations. An additional benefit is to use such maps as training aids. Consultants frequently use process maps to help them study business processes and redesign them for greater productivity.
Accountants and managers can also use this tool to help them describe current processes to others.
Like most other types of documentation, you can draw process maps in multi-level versions calledhierarchical process mapsthat show successively finer levels of detail. Such maps are especially popular on the web because viewers can click on individual symbols to
Order Goods CUSTOMER
SALES DEPT.
SHIPPING CREDIT &
BILLING
Submit Order
Check
Credit Credit
OK?
On Hand?
Check Inventory
Pick and Ship Goods
Prepare Payment
Send Invoice yes
yes
FIGURE 3-8 A process map for the order fulfillment process (created with Microsoft Word).
SHIPPING CREDIT &
BILLING
Submit Order
Customer approved for credit?
Customer account current?
New order falls within credit limit?
Approve for shipping Reject order
no
yes Credit
OK?
SALES DEPARTMENT
FIGURE 3-9 A second-level process map for the credit approval process of Figure 3-8.
see more information for any given process or decision. Figure 3-9, for example, illustrates a secondary-level process map for checking credit that might link to the ‘‘Check Credit’’
box in Figure 3-8.
Guidelines for Drawing Process Maps
Process maps vary considerably and the symbols found in web versions are remarkably inconsistent. Nonetheless, it is possible to use the symbols that you already know from drawing flowcharts to create process maps, including: a rectangle (to represent a process), a diamond (to represent decisions), an oval (to depict the starting and ending points for a process), an off-page connector, and a document symbol. Creating a good process map requires a blend of art, science, and craftsmanship, all of which mostly comes with practice.
Here are some guidelines to use when drawing process maps.4
1. Identify and define the process of interest. The goal is to stay focused on the scope of the process you are trying to map.
2. Understand the purpose for the process map. Is it to identify bottlenecks? To discover redundancies?
3. Meet with employees to get their ideas, suggestions, and comments. Don’t hesitate to ask challenging or probing questions.
4. Remember that processes have inputs, outputs, and enablers. An input could be an invoice; an output could be a payment check for a supplier, and an enabler helps a process achieve results. In AISs, information technology is itself a common enabler.
5. Show key decision points. A process map will not be an effective analytical tool without decision points (the intellectual or mental steps in a process).
6. Pay attention to the level of detail you capture. Did you capture enough detail to truly represent the process and explain it to others?
7. Avoid mapping the ‘‘should-be’’ or ‘‘could-be’’. Map what is.
8. Practice, practice, practice.
4Joe Paradiso, ‘‘The Essential Process: The Quick and Painless Path to Successful Process Mapping,’’Industrial Engineer, (April 2003), Vol. 35, p. 46– 49.
Data Flow Diagrams
Data Flow Diagrams (DFDs) are used primarily in the systems development process—for example, as a tool for analyzing an existing system or as a planning aid for creating a new system. Because documented data flows are important for understanding an AIS, many of the remaining chapters of this book use DFDs to illustrate the flow of data in the AISs under discussion.
Data Flow Diagram Symbols. Figure 3-10 illustrates the four basic symbols used in DFDs. A rectangle or square represents an external data source or data destination—for example, a customer. To show this, a DFD would include the word ‘‘customer’’ inside a data source or destination symbol. In Figure 3-10, the term ‘‘external entity’’ means ‘‘an entity outside the system under study,’’ not necessarily an entity that is external to the company. Thus, for example, a ‘‘customer’’ might be another division of the same company under study.
Data flow lines are lines with arrows that indicate the direction of data flow. Thus, data flow lines indicate the paths that data follow into, out of, or through the system under study. For this reason, every data source symbol will have one or more data flow lines leading away from it, and every data destination symbol will have one or more data flow lines leading into it. For clarity, you should label each data flow line to indicate exactly what data are flowing along it.
A circle or ‘‘bubble’’ in a DFD indicates a system entity or process that changes or transforms data. (Some authors prefer to use squares with rounded corners for this symbol.) In physical DFDs (discussed shortly), the label inside a bubble typically contains the title of the person performing a task—for example, ‘‘cashier.’’ In logical DFDs (also discussed shortly), the label inside the bubble describes a transformation process—for example,
‘‘process cash receipts.’’
Finally, DFDs use a set of parallel lines or an open rectangle to represent a store or repository of data. This is usually a file of some sort. If data are permanently stored, a data store symbol is mandatory. If data are collected over time and stored in some temporary
Data store (file) or
Internal entity (physical DFDs) or transformation process (logical DFDs) Data flow
External entity (data source or data destination)
FIGURE 3-10 Symbols for data flow diagrams.
place, you are not required to use a file symbol for this (although experts recommend including one for clarity).
Context Diagrams. As with system flowcharts and process maps, we typically draw DFDs in levels that show increasing amounts of detail. Designers first prepare a high-level DFD called a context diagram to provide an overview of a system. Figure 3-11 is an example of a context diagram for the payroll processing of Figure 3-6.
The DFD in Figure 3-11 shows the inputs and outputs of the application (payroll processing) as well as the data sources and destinations external to the application. Thus, this context diagram uses rectangles to identify ‘‘Timekeeping’’ and ‘‘Human Resources’’
as external entities, despite the fact that these departments are internal to the company.
This is because these entities are external to the payroll processing system under study.
The data flow lines connecting these entities to and from the system (e.g., time card data) are called system interfaces.
Physical Data Flow Diagrams. A context diagram shows very little detail. For this reason, system designers usually elaborate on the elements in context DFDs by decomposingthem into successively more detailed levels. These subsequent DFDs show more particulars, such as the detailed processes of the application, and the inputs and outputs associated with each processing step.
The first level of detail is commonly called aphysical data flow diagram. Figure 3-12 is an example for our payroll illustration. A physical DFD closely resembles the document flowcharts discussed earlier in this chapter; that is, it focuses on physical entities such as the employees involved in the system under study, as well as the tangible documents, reports, and similar hard-copy inputs and outputs that flow through the system. Thus, for example, the bubbles in the physical DFD of Figure 3-12 identify the data-entry clerk who enters payroll information into the computer, the payroll cashier who distributes paychecks to employees, and the tax accountant who sends tax information to the Internal Revenue Service of the federal government.
Figure 3-12 illustrates several important characteristics of physical DFDs. First, we observe that each bubble contains a number as well as a title. Including a number in each bubble makes it easier to reference it later. This also assists designers in the decomposition tasks discussed shortly. Second, we notice that a physical DFD includes the same inputs and outputs as its predecessor context diagram in Figure 3-11—i.e., the context DFD and the physical DFD are balanced. Thisbalancingis important because unbalanced DFDs are
Timekeeping
Human Resources
Government Agencies Management
Employees
Payroll Change Data Time Card Data
Paychecks
Tax Information Payroll Summaries Payroll
Processing System
FIGURE 3-11 A context diagram for a payroll processing system.
Timekeeping
Employee
Management Government
Agencies Human
Resources Payroll Change Data
Payroll Data
Paycheck
Payroll Summary Information
Payroll tax Information
Payroll tax Information Time Card Data
1.0 Data Entry Clerk
2.0 Payroll Cashier
3.0 Tax Accountant Weekly payroll data and changes
Payroll master file
FIGURE 3-12 A physical data flow diagram.
inconsistent and therefore probably contain errors. Third, we find that all the bubbles in the physical DFD contain the names of system entities (i.e., the titles of employees). These titles should correspond to the titles in an official organization chart.
Finally, we see that a physical DFD lists the job title of only one typical employee in an entity symbol, despite the fact that several employees may perform the same task—for example, several data-entry clerks or payroll cashiers. This last characteristic also applies when several employees perform the same task at different locations—for example, a company has several payroll cashiers who distribute paychecks at each of its manufacturing facilities. This keeps the DFD simple, more readable, and therefore more easily understood.
Logical Data Flow Diagrams. A physical DFD illustrates which internal and external entities participate in a given system but does not give the reader a good idea of what these participants do. For this task, we need one or more logical data flow diagrams that address this requirement.
Figure 3-13 is a logical DFD for the payroll illustration in Figure 3-12. In Figure 3-13, note that each bubble no longer contains the name of a system entity, but instead contains a verb that indicates a task the system performs. For example, instead of a single bubble with the title ‘‘data-entry clerk,’’ as in Figure 3-12, the logical DFD in Figure 3-13 shows two bubbles with the titles ‘‘process employee hours worked’’ and ‘‘process payroll change data’’ because these are separate data processing tasks such clerks perform.
From the standpoint of good system design and control, describing system processes is important because how a system performs its tasks is often more important than what tasks it performs. For example, all payroll systems prepare paychecks, but not all payroll systems do this exactly the same way. The differences may require different hardware, software,
Payroll Master File Time card
data
Payroll change data
Status and rate data
Employee hours data
Tax information Paycheck
Processed pa yroll
information Paychec
k data
Payroll summaries Payroll
information 1.0
Process employees
hours worked
3.0 Process paycheck
4.0 Process
payroll reports 2.0
Process payroll change data
Employee Government Management
Timekeeping
Human Resources
FIGURE 3-13 A logical data flow diagram for a payroll processing system.
procedures, or controls. Logical DFDs help designers decide what system resources to acquire, what activities employees must perform to run these systems, and how to protect and control these systems after they are installed.
Figure 3-13 is a level 0 data flow diagrambecause it shows only in broad terms what tasks a system performs. Most systems are more complex than this and therefore require more detail to describe them completely. The task of creating such detail is called decomposition, which becomes necessary because DFD designers try to limit each level diagram to between five and seven processing symbols (bubbles).
Figure 3-14 shows an example of a level 1 data flow diagram— an ‘‘explosion’’
of symbol 3.0 (in Figure 3-13) with caption ‘‘process paycheck.’’ Here, we see that
‘‘processing paychecks’’ entails computing gross pay, determining payroll deductions, and calculating net pay. If necessary, you can also show ancillary computer files at this level.
To fully document the system, you would continue to perform these decomposition tasks in still further DFDs. For example, you might decompose the procedure ‘‘compute payroll deductions’’ in bubble 3.2 of Figure 3-13 into several additional processes in lower-level DFDs—for example, separate DFDs for ‘‘compute medical deductions,’’ ‘‘com- pute savings plan deductions,’’ ‘‘compute tax deductions,’’ and so forth. In this way, a set of DFDs become linked together in a hierarchy.
Payroll Master File
Paycheck data
Processed payroll information
Summary paycheck data
Paycheck data with gross pay and deductions
Paycheck data with gross pay
Paycheck
3.1 Compute gross pay
3.2 Compute
payroll deductions 3.3
Compute net pay 3.4
Prepare paycheck
Employee
FIGURE 3-14 An exploded view of the ‘‘process paycheck’’ bubble of Figure 2-11.
Guidelines for Drawing Data Flow Diagrams
Data flow diagrams use fewer symbols than system flowcharts, and to some people are therefore easier to prepare and understand. Many companies use both types of documentation, with the choice often hinging on the preference of the designer. But like creating other types of system documentation, creating DFDs is as much art as science.
The following rules can help you design them better, make them clearer, and assist you in avoiding simple errors.
1. Avoid detail in high-level DFDs (i.e., in levels 0 and 1). Where appropriate, combine activities that are performed at the same place, at the same time, or that are logically related.
2. As a general rule, each logical DFD should contain between five and seven processing bubbles. This guideline helps keep things simple, and again helps you avoid showing too much detail in high-level DFDs.
3. Different data flows should have different names. This avoids confusion about what data are flowing where.
4. Unless they are outside the system or used for archiving, all data stores should have data flows both into them and out of them. Thus, an internal file symbol that lacks both of these data flow lines is usually in error.
5. Even if a file is temporary, it is usually desirable to include it in a DFD.
6. Classify most of the final recipients of system information as external entities.
7. Classify all personnel or departments that process the data of the current system as internal entities.
8. Display only normal processing routines in high-level DFDs. Avoid showing error routines or similar exception tasks in them.
9. Where several system entities perform the same task, show only one to represent them all. This rule also applies when system personnel perform the same task at different locations of the organization—for example, at different plants.
OTHER DOCUMENTATION TOOLS
There are many other tools for documenting AISs besides document flowcharts, system flowcharts, process maps, and data flow diagrams. Two of them are (1) program flowcharts, and (2) decision tables. Because these tools are used mostly by consultants and IT professionals rather than accountants, we will describe them only briefly. Accountants should have some familiarity with these tools, however, because they may see them—for example, when reviewing the design for a revised accounting system.
Program Flowcharts
Because large computer programs today involve millions of instructions, they require careful planning and the coordinated work of hundreds of systems analysts and programmers.
Typically, organizations usestructured programming techniques to create these large programs in a hierarchical fashion—that is, from the top down. This means that the developers design the main routines first and then design subroutines for subsidiary processing as major processing tasks become clear.
To help them plan the logic for each processing routine, IT professionals often create one or moreprogram flowcharts(Figure 3-15). Program flowcharts outline the processing logic for each part of a computer program and indicate the order in which processing steps take place. After designing such program flowcharts, the developer typically presents them to colleagues in a structured walkthrough or formal review of the logic. This process helps the reviewers assess the soundness of the logic, detect and correct design flaws, and make improvements. Upon approval, the program flowchart then becomes a
‘‘blueprint’’ for writing the instructions of the computer program itself, and of course serves to document the program as well.
Program flowcharts use many of the same symbols as system flowcharts (refer back to Figure 3-5). A few specialized symbols for program flowcharts are the diamond symbol (which indicates a decision point in the processing logic) and the oval symbol (which indicates a starting or stopping point).
Like system flowcharts and data flow diagrams, program flowcharts can be designed at different levels of detail. The highest-level program flowchart is sometimes called amacro program flowchartand provides an overview of the data processing logic. A lower-level program flowchart would indicate the detailed programming logic necessary to carry out a processing task. Figure 3-15 is a detailed (lower-level) program flowchart for a sales report application.
Initialize control total
to zero
Read a record
Print an output line
Print final output line with
control total Compute sales
amount = price × quantity
Add sales amount to control total
Last account?
Yes No
Stop Start
FIGURE 3-15 A program flowchart for a sales application.
Decision Tables
When a computer program involves a large number of conditions and subsequent courses of action, its program flowchart tends to be large and complex. Adecision table(Figure 3-16) is a table of conditions and processing tasks that indicates what action to take for each possibility. Sometimes, decision tables are used as an alternative to program flowcharts.
More commonly, they are used in addition to these flowcharts. To illustrate decision tables, consider the following scenario:
A credit union pays interest to its depositors at the rate of 5% per year. Accounts of less than $5 are not paid interest. Accounts of $1,000 or more that have been with the credit union for more than one year get paid the normal 5 percent, plus a bonus of. 5 percent.
Figure 3-16 illustrates a decision table to help the credit union decide how much interest to pay each account. Note that the decision table consists of four parts: (1) the condition stub outlines the potential conditions of the application, (2) the action stub outlines the available actions that can be taken, (3) the condition entries depict the possible combinations of conditions likely to occur, and (4) the action entries outline the action to be taken for each combination of conditions.
The rules at the top of the decision table set forth the combination of conditions that may occur, and the action entries show what to do for each of them. For the illustration at hand, three conditions affect the data processing of each account: (1) an account balance less than $5, (2) an account balance less than $1,000, and (3) an account one year old or less. As defined, each of these conditions can now be answered ‘‘yes’’ or ‘‘no.’’ Figure 3-15
Condition stub
Conditions
Account balance less than $5 Account balance less than $1,000 Account 1 year old or less Actions
Pay no interest Pay 5 percent interest Pay 5.5 percent interest
Y
*
* X 1
N
*Y
X 3 Rules
N Y
*
X 2
N N N
X 4
Action stub
Condition entries
Action entries
FIGURE 3-16 This is a decision table to help a credit union decide how much interest to pay each account. An asterisk (∗) means that the condition does not affect the course of action.
is a decision table for the illustration at hand, in which Y stands for ‘‘yes’’ and N stands for
‘‘no.’’ The combination of Ys and Ns in each column of the table illustrates each possible condition the system might encounter. Using Xs, the decision table also shows what course of action should be taken for each condition (i.e., how much interest should be paid to each account).
The major advantage of decision tables is that they summarize the processing tasks for a large number of conditions in a compact, easily understood format. This increases system understanding, resulting in fewer omissions of important processing possibilities. Decision tables also serve as useful documentation aids when new data processing conditions arise or when changes in organizational policy result in new actions for existing conditions. This advantage is particularly important to AISs because of organizational concern for accuracy and completeness in processing financial data.
One drawback of decision tables is that they do not show the order in which a program tests data conditions or takes processing actions, as do program flowcharts. This is a major deficiency because the order in which accounting data are tested or processed is often as important as the tests or processing themselves. A second drawback is that decision tables require an understanding of documentation techniques beyond flowcharting. Finally, decision tables require extra work to prepare, and this work may not be cost effective if program flowcharts must be prepared anyway.
Software Tools for Graphical Documentation and SOX Compliance
Accountants, consultants, and system developers can use a variety of software tools to creategraphical documentationof existing or proposed AISs. The simplest tools include presentation software, such as Microsoft PowerPoint, as well as word processing and spreadsheet software such as Microsoft Word and Excel. The advantages of using such tools closely parallel those of using word processing software instead of typewriters (e.g., easily revised documents, advanced formatting capabilities and coloring options, and a variety of reproduction capabilities). For example, the authors used Microsoft Word to create the process maps in Figures 3-8 and 3-9.
Microsoft Word, Excel, and PowerPoint. Using the ‘‘AutoShapes’’ option in the Drawing Toolbar of Microsoft Word, Excel or PowerPoint, you can reproduce most of the graphics symbols and logic diagrams in this chapter. (The connectors in Excel are different from, as well as better than, simple lines because they adjust automatically when you reposition symbols in your charts.) Two additional advantages of using Excel to create
graphical documentation are the ability to create large drawings (that exceed the margins of word-processing documents) and the option to embed computed values in flowcharting symbols. Problem 3 – 21 at the end of the chapter describes how to use Excel to create such graphical documentation.
CASE Tools. The capabilities of specialized graphical documentation software exceed those of word-processing or spreadsheet packages. These CASE tools (an acronym for computer-assisted software engineering) automate such documentation tasks as drawing or modifying flowcharts, drawing graphics and screen designs, developing reports, and even generating code from documentation. Thus, CASE tools are to flowcharts what word processors are to text documents. Figure 3-17 is an example of a CASE package in use, drawing a data flow diagram.
Most CASE products run on personal computers. Examples includeiGrafx(Micrografx, Inc.),allCLEAR(SPSS, Inc.),SmartDraw(SmartDraw Software, Inc.), andVisio(Microsoft Corp.). These products are especially popular with auditors and consultants, who use them to document AISs using the techniques discussed above, as well as to analyze the results.
Graphical documentation software enables its users to create a wide array of outputs, including data flow diagrams, entity-relationship diagrams (described in Chapter 7), system flowcharts, program flowcharts, process maps, and even computer network designs.
More complex CASE products enable their users to do even more. Examples include Application Factory (Cortex Corporation), Excelerator II (Intersolv), and Pacbase (CGI Systems, Inc.). These CASE tools enable system designers to create process models, data-entry screens, report formats, menu screens, structure charts, and customized user interfaces. Most CASE packages also include modules for creating data dictionaries and word
SED
G
ORDER ENT MARKETING R
I
Toolbox
BCA A BC
0.0 OIS SYSTEM DIAGRAM File Options Help
Level: 1 Select command:
PROCESS ORDER
ORDER/
INVENTORY DETAIL 1.0
MAINTAIN INVENTORY 3.0
FULFILL 2.0
RECEIVE 5.0-P ORDER/INVENTORY
DATA
ACT
ACCOUNTING
ORD ORDER ENTRY DEPARTMENT
REC
RECEIVING REQUEST FOR
CREDIT APPROVAL APPROVED CUSTOMER
ORDER ENTRY SIGNALS
CUSTOMER DETAIL
......
....
..
OPEN ORDER
INVENTORY DETAIL
RELEASED MAIL ORDER INVENTORY
DETAIL
CATALOGUE CHANGE
GOODS RECEIVED
DETAIL
Map
FIGURE 3-17 This CASE tool is a software program called Excelerator™, which is used here to create a data flow diagram. The toolbox on the left contains symbols that the user can select for his or her diagram.