Chapter 5. Protein Structure and Binding Site Predictions for S1P
15.1. Introduction
S1P1 is a frequent subject of investigation and is one of the first lipid GPCRs to have an agonist enter into clinical trials.1,2 The study of S1P1 employs similar methods to those used in the predictions of LPA2 but includes an examination of antagonist binding.
Section 5.2 summarizes the differences. A description of the predicted TM region is provided in Section 5.3, while Section 5.4 elucidates the results from the docking studies.
5.2. Modifications to Standard Method
The originally published sequence for S1P1 (primary accession number: P21453) is used throughout this work. The author recognizes that a corrected sequence (primary accession number Q9NYN8), which differs by two residues located (approximately) in TM5, is available. Future investigations will utilize the most accurate sequence.
Appendix B.1 lists the sequences used for transmembrane (TM) predictions, and Appendix B.2 shows the alignment of those sequences.
As stated previously, multiple iterations of helical optimization may be necessary to achieve convergence. The structure for S1P1 converges after two rounds of optimization. This procedure creates two packing structures for the TM barrel. To determine the structure relevant to binding/activation, the endogenous ligand is docked into both structures. The criteria used for evaluating the structures include minimum total energy and best binding energy.
Previous studies have identified an antagonist for S1P1. As it is possible that antagonists bind to GPCRs in a different pocket—or even in a different packing of the TM region—than agonists do, antagonists are docked using the full procedure developed for binding of agonists, although the loops are taken from the structure developed for agonists.
The ligand charges are calculated with sphingosine-1-phosphate in its zwitterionic form. When calculating binding energies and interaction energies, we only neutralize the protein. The ligand maintains zwitterion form throughout the analysis.
5.3. Structure of S1P
1TM2ndS clearly identifies seven hydrophobic regions (Figure 5.1). As Table 5.1 shows, the helices have the expected length, with relatively long extracellular loops and termini.
The hydrophobic centers define a reasonable plane for the center of the bilayer.
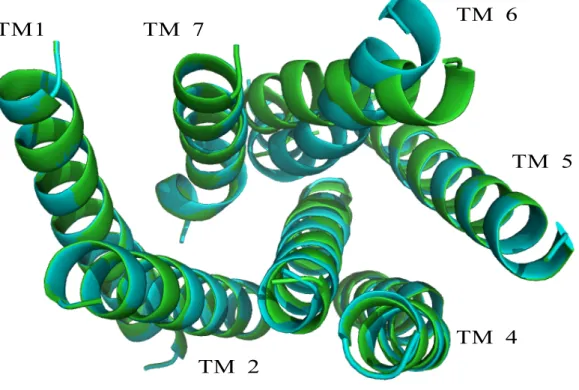
Unlike similar research into LPA2, two packing structures appear as putative structures after optimizing helical rotations. Helices 1, 2, 4, 5, and 7 are in the same orientation in both packings, but helices 3 and 6 are both rotated differently in each structure. Figure 5.2 shows an overlay of the alpha carbon backbones of each possible structure. Helix 6 in Structure A is rotated 90° from TM 6 in Structure B. The difference between the structures in helix 3 is less dramatic, with only a 30° difference. The root mean square deviation (RMSD) of the alpha carbon backbones is only 0.57 Å, but upon visual inspection it is apparent that there is less room for the ligand to bind within the TM barrel if helices 3 and 6 are part of the boundary of the binding pocket. The binding
pockets for retinal and LPA, in their native receptors, include residues on helix 6. The overlay of Structures A and B on top of the rhodopsin crystal structure (primary accession number: 1F88) shows that the rotation of helix 6 in Structure A most closely resembles rhodopsin (Figure 5.4). These results intimate that Class A GPCRs may share consistencies in the location of the binding pocket.
Helices 1, 2, 4, 5, and 7 are identical in Structure A and Structure B. Figure 5.5 compares the predicted positions of the most highly conserved residues in helices 1, 2, 4, 5 and 7 to the positions seen in rhodopsin crystal structures. Between S1P1 and rhodopsin, the ASN in helix 1 and the ASP in TM 2 have the most similar positioning with respect to rotation. Between the rhodopsin and S1P1 structures, helices 5 and 7 are rotated approximately 90° from each other, while the most highly conserved TRP residues on helix 4 are nearly 180° apart. The RMSD between the alpha carbon backbone of Structure A and rhodopsin is 4.35 Å, while rhodopsin and Structure B have an RMSD of 5.25 Å.
Hydrogen bond networks tie the helices together in both structures. Structure A has hydrogen bonds between helices 1 and 2, 2 and 7, 2 and 3, 3 and 6, and 4 and 5.
Structure B develops hydrogen bonds between helices 1 and 2, 2 and 7, 2 and 3, and 4 and 5. The hydrogen bonds between helices 3 and 6 cannot form in Structure B because of the rotation of those helices. Table 5.2 provides detailed information about the inter- helical hydrogen bonds. The hydrogen-bonding network between helices 1, 2, and 7 (which are oriented identically in both structures) mimics that seen in bovine rhodopsin3 (Figure 5.3). Other researchers have developed a homology model of S1P1 based on the crystal structure of rhodopsin.4 Both computationally developed models capture the
hydrogen-bonding network between TM regions 1, 2, and 7. They also both show hydrogen bonds between W182 on helix 4 and a histidine on helix 5. The homology model, though, shows the interaction between W182 and H201, while our model indicates a hydrogen bond between W182 and H199.
After minimizing each putative structure for 150 steps, Structure A is lower in energy than Structure B. The RMSD force for both proteins, after 150 steps, is between 0.7-0.8 (kcal/mol)/Å and the energies are 1867.22 kcal/mol and 1984.83 kcal/mol for Structures A and B, respectively. Given the similarities between Structure A and rhodopsin, and the difference in energy between Structure A and Structure B, it is likely that at least Structure A is biologically relevant.
5.4. Prediction of Putative Binding Sites
Although one of the TM barrel structures predicted by our method is lower in energy, both the endogenous ligand and an antagonist are docked into both putative protein structures. Activation of GPCRs is relatively poorly understood, and the differences between the apo structure and ligand-bound structures are unclear, so both predicted structures may be biologically relevant.
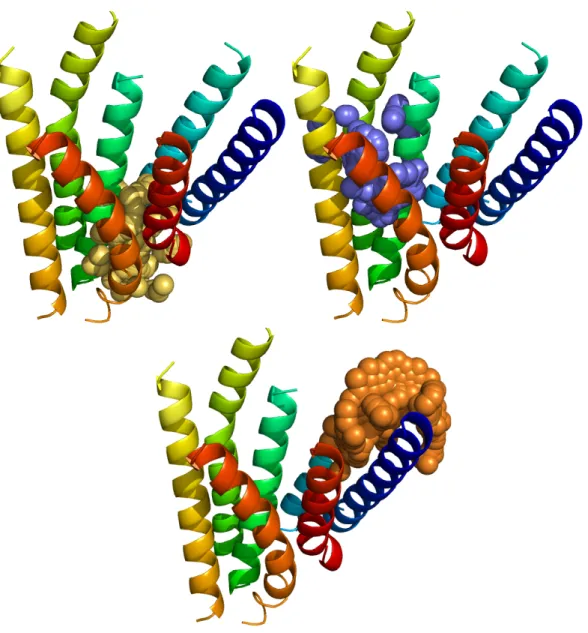
The bulky residues are mutated to alanines prior to defining the sphere sets that identify void spaces within the protein. These regions are investigated further as possible binding sites. The PASS5 algorithm detects seven sphere sets within the barrel of Structure A and five sphere sets in Structure B (Figures 5.6 and 5.7). For Structure A, two of the regions spill out toward the membrane, but the other five sphere sets are buried in the barrel. The PASS algorithm again obtains nearly full coverage of the TM region in
Structure B. Because of the high concentration of long residues at the intracellular end of helices 4, 5, and 6, PASS finds active site points almost outside the TM barrel (last panel, Figure 5.7).
The void spaces in each predicted TM barrel are well covered by spheres for potential binding sites. Not all putative binding sites predicted by PASS are logical if the ligand primarily binds within the TM barrel. The fewer sphere sets predicted for Structure B indicate that it contains less void space to dock the ligand.
5.4.1. Endogenous Ligand Binding Site
The structure prediction analysis shows that Structure A is lower energy, and the binding energies between S1P and Structure A are stronger than the binding energies involving Structure B (data not shown). As such, the results and discussion concerning agonist binding are limited to observations made about the Structure A-ligand complex.
The lowest energy S1P-S1P1 complex shows polar-polar interactions between the phosphate head and Y98/2.57Y, R120/3.28R, and E293/7.36E. E293 also forms an ionic interaction with the ammonium functional group on the ligand (Figure 5.8). Previous homology models identify two basic residues at the extracellular ends of TM5 and TM7 as also involved in the binding of the phosphate head.4,6 The model predicted in this work does not implicate those residues in binding. As noted before, this inconsistency does not inherently indicate a failure of our method but could result from the differences between activation and binding. The model we predict has the Lys at the extracellular end of helix 5 pointing toward the phosphate head of the ligand, but the two species are too distant to have any significant interactions. The Arg on helix 7, in our model, orients
its side chain toward helix 1 in order to form a weak hydrogen bond with a Thr residue there.
Previously developed models demonstrate that E121/3.29E forms a critical ionic interaction with the ammonium group on S1P. This interaction has been implicated in the selectivity of S1P1 for S1P, as opposed to LPA species. When the protein has a net charge, the model presented here shows a weak interaction between 3.29E and the ligand ,but a very strong interaction between the ligand and 7.36E. However, upon neutralizing the protein, 3.29E has a stronger interaction with the ligand than 7.36E does. As noted above, we keep zwitterionic charges for the ligand even after neutralizing the protein residues. Under these conditions, the interaction energy between 3.29E and the ligand is -3.52 kcal/mol, while the interaction with 7.36E is -2.64 kcal/mol.
Figure 5.9 highlights the way the tail of S1P fits between helices 3, 6, and 7, and has minor contacts with residues on helix 5. Figure 5.10 displays all residues that have interaction energies with the ligand greater than 1.5 kcal/mol. The overall interaction energy between S1P and the residues in the binding pocket is -47.2 kcal/mol (Table 5.3).
Because we use an uncorrected sequence for S1P1, direct comparisons to experimental data cannot be made. The employed sequence lacks a Leu residue that, according to our TM predictions, is located in TM 5. Mutation experiments isolated residues on helices 3, 5, and 6 as members of the binding pocket, suggesting that our putative binding pocket is similar to that investigated experimentally.7 Our binding site differs from the experimentally defined pocket, in that helix 5 is a minor component of the border around the binding pocket predicted in our model. Experimentally, helix 5 interacts extensively with the ligand. Both the homology model used to identify candidates for mutation and
our model orient helix 5 similarly, but not identically. As noted above, though, the Lys at the EC end of helix 5 is too distant from the ligand to strongly interact, which also indicates that the structure predicted here might not be the active form of S1P1. This inconsistency may solely result from the missing Leu in TM 5 in our model, or it may indicate other deficiencies in this structure prediction method. The challenges of mutating residues deep in the barrel of a GPCR, though, create some ambiguity in the analysis of mutagenesis studies, since one cannot guarantee that the mutation directly changes the structure of the binding pocket. Mutating residues critical to bundle packing may not prohibit folding of the protein, so it is still expressed, but might create a global disturbance in the structure of the protein which effects binding and/or activation.
Therefore, future experimental work must include residues identified in this work to insure that a full picture of the binding pocket is illuminated.
Using the Ballesteros and Weinstein numbering scheme, the residues on helix 6 that we predict as important are also identified by mutagenesis for their importance. For example, residue 6.40 is part of the hydrophobic binding pocket in our model and in experiments. In the corrected sequence, 6.40 is a Val residue, while it is a Leu in our predicted structure. These experiments do not examine residues on helix 7 for effects on binding or activation. The results from our study necessitate further experimental investigation.
Despite using a slightly different sequence for S1P1 than is currently regarded as the most accurate version, we find a similar binding mode to that identified in homology models and in experiments, although the hydrophobic pockets for the lipid tail show differences. The Arg residue, 3.28R, binds to the negatively charged phosphate head.
We identify two glutamic acid residues that contribute to the binding of the polar head group: 7.36E and 3.29E, while homology models have only identified 3.29E. Helices 3, 6, and 7 surround the hydrophobic binding pocket in this study, although helix 5 is also weakly involved. In comparison with experimental results and homology models, the structure presented here is plausible and adds insight into other interactions that have not been investigated elsewhere. In particular, future experiments must strive to identify the relative importance of helices 5 and 7.
5.4.2. Other Agonist Binding Sites
FTY720, a pro-drug in phase 3 clinical trials, is rapidly phosphorylated by a sphingosine kinase in vivo to FTY720-P (Structure 5.1). FTY720-P is an agonist for S1P1 and S1P3. Acting as an inverse agonist upon S1P1, FTY720-P inhibits lymophocyte trafficking in the body without affecting other components of the immune system, making it an excellent candidate for transplant patients and those with autoimmune diseases. The side effects of FTY720-P, purportedly from FTY720-P interacting with S1P3, primarily manifest in the cardiovascular system, most frequently leading to bradycardia.7 This cross-activation motivates a search to understand S1P1 activation and selectivity.
NH3+ O
P O
OH O-
HO
Structure 5.1 FTY720-P (racemic)
As noted previously (Chapters 3 and 4), other agonists are built through perturbations on the endogenous ligand. The S stereoisomer is more potent than the R, but both are studied as ligands for S1P1. The S stereoisomer does have a slightly stronger interaction with the protein than the R enantiomer. The interaction energy for S is -33.75 kcal/mol, while the interaction energy for R is -32.56 kcal/mol. These interaction energies are weaker than the interaction energy in the S1P-S1P1 complex. This contrasts with experimental data that indicate that FTY720-P has a significantly stronger interaction than the endogenous S1P ligand. As discussed above, disregarding entropy, especially with large ligands, can skew the rankings of ligands. The lipid tails on FTY720-P and S1P differ in the number of torsions, so the entropy term may be non- negligible when comparing the two ligands.
Despite the discrepancy in interaction energies, this theoretical model can provide qualitative insight into which ligand-protein interactions are critical for activation. In particular, FTY720-P shows two interactions with S1P1 that are not seen or are unavailable for S1P: a cation-pi interaction between the ammonium group and F125/3.33F, and a pi-pi interaction between that same phenylalanine and the aromatic ring in the ligand (Figure 5.11). The R stereoisomer does not form the cation-pi interaction, which may explain the difference in efficacy between the isomers. Since 3.33F shows distinctly different interactions between S1P and FTY720-P, it is an excellent candidate for mutation. Our data indicate that mutating F3.33 to alanine would significantly decrease, if not abolish, activity of S1P1 by FTY720-P and possibly S1P.
5.4.3. Antagonist Binding Sites
VPC23019 (Structure 5.2) is the lead compound in a series used to examine the structure- activity relationships in S1P1. This set of experiments isolates multiple antagonists for S1P1 and S1P3, all of which have the opposite stereochemistry of endogenous sphingosine-1-phosphate.8 Upon finding two helical packings for S1P1, we hypothesized that one structure is active upon binding to an antagonist, while the other is seen upon activation by an agonist. As a result, both structure packings are the targets of this antagonist docking study. As seen with the endogenous agonist, and contrary to our hypothesis, Structure A is lower in energy and has a stronger binding energy to VPC23019 than Structure B. Further discussions of VPC23019-S1P1 complexes refer only to Structure A.
NH3+
O P O
OH O-
O HN
Structure 5.2 VPC23019
The important structural differences between VPC23019 and S1P relate to stereochemistry and alkyl chain position, as other aryl compounds are known agonists of S1P1. Most aryl agonists, though, have para substitution on the aromatic ring, while VPC23019 is meta substituted. The S enantiomer of VPC2301 (identified in the literature as VPC25027) is a partial agonist of S1P1, suggesting that position of the alkyl group correlates with efficacy of agonists, while stereochemistry is determinative of activity.
The binding energy of VPC23019 docked into S1P1 is -15.32 kcal/mol, which is higher than the binding energies seen for agonist binding, but much more physically reasonable. This shift in the magnitude of the binding energies is unsurprising, since, as noted above, the binding energies of the lipids with long tails have little to no physical meaning, and one expects VPC23019 to have a better solvation energy in water. The agonists and antagonists in this study, though, have cavity energies of a similar magnitude (Table 5.4).
Although VPC23019 docks into the same general space as S1P, the binding modes are quite different. Figure 5.12 shows how the polar head of VPC23019 fits closer to helices 6 and 7 and has a relatively weak interaction with 3.28R, the arginine implicated in binding endogenous ligands throughout the edg family. This loss of interaction energy is compensated for by hydrogen bonding between VPC23019 and a tyrosine residue on helix 7. There are also strong interactions with an aspartic acid on helix 6 (D278) and the glutamic acid on helix 7 (E293) that is also in the binding pocket of S1P (Figure 5.13).
The ligand interaction with the Asp on helix 6 is of note, as it breaks up a salt bridge between the Asp and a lysine residue (K282). The position of K282 changes when the salt bridge breaks, putting it in close proximity to another Lys (K200). The repulsion between K282 and K278 could prevent helical rotation necessary for activation of the G protein heterotrimer. As D278 is the only residue we predict to interact with the ammonia group on the ligand, and the stereochemistry of that ammonia group differentiates between agonism and antagonism, the importance of it must be explored experimentally.
Davis et al. suggest that VPC23019 may be an inverse agonist for S1P1,8 an assertion that our results support. Inverse agonists bind to the same structure as true agonists, somehow disrupting the conformational changes that must occur for signal transduction. Given the similarities in the positions of the tails of S1P and VPC23019 (Figure 5.12, top panel), and that they are docked independently from one another, inverse agonism by VPC23019 seems more likely than antagonism.
5.5. Tables and Figures
NT (43) MGPTSVPLVKAHRSSVSDYVNYDIIVRHYNYTGKLNISADKEN TM 1 (29) SIKLTSVVFILICCFI
I
LENIFVLLTIWKLP 1 (10) TKKFHRPMYY
TM 2 (26) FIGNLALSDL
L
AGVAYTANLLLSGAT LP 2 (8) TYKLTPAQTM 3 (26) WFLREGSMFVALS
A
SVFSLLAIAIER LP 3 (16) YITMLKMKLHNGSNNFTM 4 (32) RLFLLISACWVI
S
LILGGLPIMGWNCISALSS LP 4 (6) CSTVLPTM 5 (28) LYHKHYILFCTTVFTL
L
LLSIVILYCRI LP 5 (29) YSLVRTRSRRLTFRKNISKASRSSENVAL TM 6 (28) LKTVIIVLSVFIAC
WAPLFILLLLDVGC LP 6 (7) KVKTCDITM 7 (21) LFRAEYFLVLAV
L
NSGTNPIICT (72) YTLTNKEMRRAFIRIMSCCKCPSGDSAGKFKRPIIA GMEFSRSKSDNSSHPQKDEGDNPETIMSSGNVNSSS
Table 5.1 There are, unsurprisingly, seven predicted helices for S1P1. The cytoplasmic region hosts the longer loops, and the C-terminus is longer than the N-terminus. The hydrophobic centers are highlighted in bold and the most highly conserved residue, used in the Ballesteros and Weinstein identification scheme, is underlined.
Donor Helix
Donor Residue
Acceptor Helix
Acceptor Residue
D-A Distance
(Å)
1 20-ASN ND2 2 9-ASP O 2.99
3 4-ARG NE 2 19-ASN OD1 2.85
7 17-THR OG1 2 9-ASP OD2 2.99
6 3-THR OG1 3 24-ILE O 3.19
4 24-TRP NE1 5 3-HSE NE2 3.19
5 4-LYS NZ 4 25-ASN OD1 2.88
Structure A
Donor Helix
Donor Residue
Acceptor Helix
Acceptor Residue
D-A Distance
(Å)
1 20-ASN ND2 2 9-ASP O 3.00
3 4-ARG NE 2 19-ASN OD1 2.92
7 17-THR OG1 2 9-ASP OD1 3.06
7 17-THR OG1 2 9-ASP OD2 3.16
4 24-TRP NE1 5 3-HSE NE2 3.15
5 4-LYS NZ 4 25-ASN OD1 2.64
5 4-LYS NZ 4 25-ASN OD1 2.64
5 4-LYS NZ 4 28-SER OG 2.96
Structure B
Table 5.2 A table listing the inter-helical hydrogen bonds in the predicted transmembrane packings for S1P1. The residue numbering is independent for each helix and can be compared to Table 5.1 to identify overall location in the protein.
Residue VdW Coulomb NonBond
TRP 268 -3.81 -0.42 -4.23
GLU 121 -1.42 -2.10 -3.52
PHE 125 -3.60 0.16 -3.44
CYS 267 -2.99 -0.33 -3.32
TYR 98 3.82 -6.64 -2.82
GLU 293 1.82 -4.46 -2.64
VAL 297 -2.69 0.42 -2.28
LEU 128 -2.55 0.44 -2.11
TYR 294 -2.99 0.90 -2.09
MET 124 -1.78 -0.26 -2.04
PHE 264 -1.87 -0.09 -1.96
ARG 120 2.14 -3.94 -1.80
LEU 271 -1.73 -0.03 -1.76
LEU 136 -1.49 0.07 -1.42
LEU 301 -1.59 0.18 -1.41
PHE 133 -1.46 0.06 -1.40
ILE 265 -1.29 -0.06 -1.35
LEU 215 -1.31 0.04 -1.27
SER 129 -1.12 0.06 -1.06
LEU 261 -0.99 -0.04 -1.03
ILE 219 -1.04 0.03 -1.01
LEU 298 -0.52 -0.39 -0.91
VAL 132 -0.77 0.09 -0.68
LEU 274 -1.07 0.54 -0.53
PHE 272 -0.34 -0.12 -0.46
VAL 218 -0.40 0.05 -0.35
VAL 300 -0.39 0.16 -0.23
CYS 222 -0.14 0.04 -0.11
Total -31.54 -15.66 -47.19
Table 5.3 A cavity analysis of S1P docked into S1P1 shows that the complex has an interaction energy of -47.2 kcal/mol. Multiple hydrophobic residues border the pocket for the lipid tail.
Ligand Cavity Energy (kcal/mol)
S1P -47.36
FTY720-P (S) -33.75
FTY720-P (R) -32.56
VPC23019 -44.3
Table 5.4 The antagonist VPC23019 has a cavity energy comparable to the endogenous ligand and larger than the drug candidate FTY720-P.
Figure 5.1 A examination of relative hydrophobicity vs. residue position shows seven regions that are significantly more hydrophobic than the rest of the protein. These seven regions of sequences are constructed into alpha helices and packed together to create the TM region of S1P1.
TM1
TM 2
TM 7 TM 6
TM 5
TM 4
Figure 5.2 The two putative packing structures for the TM region of S1P1. Helix 6 on Structure A (green) is rotated 90° clockwise (when looking from the EC region) from helix 6 on Structure B (cyan). There is also a slight difference (30°) between the rotations of helix 3.
Figure 5.3 Both S1P1 and bovine rhodopsin show a hydrogen bonding network between helices 1, 2, and 7. This hydrogen-bonding network is believed to be conserved through many Class A GPCRs.
Figure 5.4 The methods developed in this thesis predict two low energy packings for the transmembrane region of S1P1. Helix 6 in Structure A (green) closely matches the helical orientation of the rhodopsin crystal structure (purple). Structure B (cyan) is rotated -90° from Structure A at helix 6, and -30° at helix 3.
Figure 5.5 Rhodopsin (green) and S1P1 (purple) overlap closely in helices 1 and 2, according to conserved residue placement. Helices 5 and 7 have similar translations, but the rotations differ by approximately 30°. Helix 4 shows the most variation, with the highly Trp 180° apart.
(Figure 5.6 continues on the next page)
Figure 5.6 The sphere sets for Structure A, identified by the PASS algorithm, cover the entire barrel of the protein. The backbone of the protein is colored with blue at the N- terminus and red at the carboxy terminus. The extracellular region lies at the top of each panel.
(Figure 5.7 continues on the next page.)
Figure 5.7 The PASS algorithm finds active site points in most major pockets of Structure B, although the fifth sphere set primarily exists outside the TM barrel (bottom panel). The protein is shaded blue at the amino terminus and red at the C-terminus.
2.57Y
3.28R 7.36E
Figure 5.8 The polar head group on S1P creates multiple attractive forces upon interacting with S1P1. The arginine on helix 3 and the glutamate on helix 7 both form strong Coulombic interactions with the ligand, while the tyrosine on helix 2 forms a hydrogen bond with S1P.
Figure 5.9 Spingosine-1-phosphate fits into the TM barrel of S1P1 in the pocket between helices 3, 6, and 7. The protein, displayed as a ribbon model, is colored blue at the N- terminus and red at the carboxy terminus.
Y98
F264
L128 W268
E121
C267
Y294 E253
Figure 5.10 Sphingosine-1-phosphate fits in between helices 3, 6, and 7 of S1P1. There are multiple hydrophobic residues interacting with the ligand, indicative of a plausible binding pocket for the endogenous ligand.
Figure 5.11 FTY720-P (S) has a pi-pi interaction between the aromatic group on the ligand and F125 on helix 3.
TM 3
TM 7
TM 6
TM 5 TM 4
TM 2
Figure 5.12 VPC23019 (green) docks closer to helices 6 and 7 than S1P (cyan) does.
This position leads to a weaker interaction with 3.28R for the antagonist.
TM 7
TM 6
TM 3
D278
Y294 E293
R110
Figure 5.13 VPC23019 forms strong polar-polar interactions between E293, Y294, and D278. The hydrogen bonds formed with D278 are strong enough to disrupt a salt bridge between D278 and K282.
5.6. References
(1) Brinkmann, V.; Lynch, K. R. Current Opinion in Immunology 2002, 14, 569-575.
(2) Hale, J. J.; Yan, L.; Neway, W. E.; Hajdu, R.; Bergstrom, J. D.; Milligan, J. A.;
Shei, G.-J.; Chrebet, G. L.; Thornton, R. A.; Card, D.; Rosenbach, M.; Rosen, H.;
Mandala, S. Bioorganic & Medicinal Chemistry 2004, 12, 4803-4807.
(3) Okada, T., Sugihara, M., Bondar, A-N, Elstner, M., Entel, P., Buss, V. Journal of Molecular Biology 2004, 342, 571-583.
(4) Parrill, A. L.; Wang, D.-a.; Bautista, D. L.; Van Brocklyn, J. R.; Lorincz, Z.;
Fischer, D. J.; Baker, D. L.; Liliom, K.; Spiegel, S.; Tigyi, G. Journal of Biological Chemistry 2000, 275, 39379-39384.
(5) Brady, G. P., Jr.; Stouten, P.F. Journal of Computationally-Aided Molecular Design 2000, 14, 383-401.
(6) Bautista, D. L.; Baker, D. L.; Wang, D.; Fischer, D. J.; Brocklyn, J. V.; Spiegel, S.; Tigyi, G.; Parrill, A. L. Journal of Molecular Structure-Theochem 2000, 529, 219- 224.
(7) Fujiwara, Y.; Osborne, D. A.; Walker, M. D.; Wang, D.-a.; Bautista, D. A.;
Liliom, K.; Van Brocklyn, J. R.; Parrill, A. L.; Tigyi, G. Journal of Biological Chemistry 2007, 282, 2374-2385.
(8) Davis, M. D.; Clemens, J. J.; Macdonald, T. L.; Lynch, K. R. Journal of Biological Chemistry 2005, 280, 9833-9841.