Chapter 8 8
Chapter
Measuring and Managing Life-Cycle Costs
After completing this chapter, you will be able to:
1. Describe the total-life-cycle costing approach for managing product costs.
2. Explain target costing.
3. Compute target costs.
4. Calculate the breakeven time for a new product development project.
5. Select nonfinancial measures for product development processes.
6. Identify environmental costing issues.
Chemco International
Marais Young has just been appointed controller of a specialty chemical company after serving several years as senior manager of the manufactur- ing division. Although her performance was excellent in that division, she continually struggled with the narrow scope of the company’s manage- ment accounting system.
The system focused solely on assigning the costs of the manufacturing process to products and did not provide any insight into premanufacturing and postmanufacturing costs, such as the cost of developing products and disposing of toxic waste from the production process and the used chemi- cals that had been returned by customers. Competition in the chemicals industry had increased dramatically, and Marais knew she needed to under- stand the total costs over the entire life cycle of the company’s products.
She has heard that some companies in the industry have adopted an approach imported from Japan called target costing, which helps engineers lower the costs of products during the design and development stage. In addition, the variety of products produced by the company have different hazards and toxicities associated with them. With the cost of environmental compliance rising rapidly, Marais wanted to trace safety, take-back,
recycling, and disposal costs to individual products in the same way that activity-based costing now allows the tracing of manufacturing costs to
In the past several chapters, we have focused on measuring and improving product, cus- tomer, and process performance. Companies, however, should not only improve the prof- itability from existing products but also create new products and services. Successful innovation drives customer acquisition and growth, margin enhancement, and customer loyalty. Without innovation, a company’s advantage in the marketplace will eventually be imitated, forcing it to compete solely on price for commodity products and services.
Companies, such as Apple, become the industry’s leader and earn exceptional profits by bringing innovative products—well matched to targeted customers needs and expectations—to the market fast and efficiently. Product innovation is a prerequisite to even participate in some dynamic, technologically based industries, such as pharma- ceuticals, specialty chemicals, semiconductors, telecommunications, and media.
Companies that continually bring new products to the market quickly must also be concerned about the environmental impact from their innovation, as customers discard their now obsolete products. Societal concerns about pollution have caused companies such as Xerox, HP, and Sony to measure the total life-cycle costs of their products, including the impact of raw material extraction, energy consumption dur- ing use, and, finally, salvage, recycling, and disposal. We refer to total-life-cycle cost- ing (TLCC)as the approach companies now use to understand and manage all costs incurred in product design and development, through manufacturing, marketing, distribution, maintenance, service, and, finally, disposal (see Exhibit 8-1). Managing life-cycle costs is also known as managing costs “from the cradle to the grave.”
The innovation process itself is expensive. One automotive component supplier discovered that it incurred 10% of its expenses during product design and develop- ment, whereas its entire production direct labor costs were 9% of expenses. Yet it mon- itored and controlled direct labor expense tightly, whereas its design and development group had hardly any management accounting system to monitor its rate of expendi- ture in R&D or to measure the performance of the new products that it released to the production department.
Beyond managing the costs of product development, engineers and managers must plan ahead for a product’s production costs once its design and development have been
M
ANAGINGP
RODUCTS OVERT
HEIRL
IFEC
YCLEExhibit 8-1 Cycle Comprising the Total-Life- Cycle Costing Approach
Research, Development,
and Engineering Cycle Manufacturing Cycle
Target Costing
& Value Engineering Kaizen Costing (Chapter 7)
Post-Sale Service and Disposal Cycle
Activity-Based Costing (Chapter 5)
Total-Life-Cycle Costing, Environmental Costing
individual products, and MSDA costs to individual customers. She believed that better costing systems would help the company’s managers and product and process engineers make better decisions about how to design, produce, recycle, and dispose of products over their entire life cycle.
completed. After products reach the manufacturing stage, the opportunities for substan- tial cost reduction may be limited. Companies have learned that most of a product’s costs are designed in during the research and development stages. And many companies are now planning for the postproduction costs of retrieving, recycling, and salvaging their products (referred to as product take-back) after their customers are finished using them.
Consider the situation faced by managers of the Burleson Company who have just learned about a new product concept that may revolutionize their business. Their ini- tial research suggests to them that they can manufacture the product at a reasonably low cost, especially given the new technology that they have just acquired. They begin to consider how they can reorganize their operations to accommodate the production of the new product. Because they have only some preliminary ideas about the feasibil- ity of product design, they approach their research, development, and engineering (RD&E) division for further investigation. The report from the RD&E group tells them that the product can be produced, but the cost of developing prototypes is 20 times more than the average prototype costs. RD&E confirms, however, that the actual cost to manufacture the product after the first year will be low as Burleson gains experience with the new technology. Thus, the initial life-cycle cost of the product may be high, but unit manufacturing costs should be relatively low. With this new information, man- agers of the division have to determine whether they should forge ahead with devel- oping the new product in light of its high R&D costs, low manufacturing costs, and the opportunity costs of committing their scarce engineers for this project.
Each part of a company’s value chain—new product development, production, dis- tribution, marketing, sales, and postsales service and disposal—is typically managed by a different organizational function. Although costs may be collected and traced to each function, companies need a total-life-cycle perspective that integrates the trade- offs and performance over time and across functional units. From the company’s perspective, total-life-cycle product costing integrates RD&E, manufacturing, and post- sales service and disposal. Let us look at each.
Research, Development, and Engineering Stage
Theresearch, development, and engineering (RD&E) stageconsists of three substages:
1.Market research, during which emerging customer needs are assessed and ideas are generated for new products.
2.Product design, during which scientists and engineers develop the technical specifications of products.
3.Product development, during which the company creates features critical to customer satisfaction and designs prototypes, production processes, and any special tooling required.
By some estimates, 80% to 85% of a product’s total life-cycle costs are committed by decisions made in the RD&E stage of the product’s life (see Exhibit 8-2). Decisions made during this cycle can have a huge impact on the costs incurred in later stages.
Spending an additional dollar in better design can often save $8 to $10 in manufac- turing and postmanufacturing activities, by reducing the costs of design changes, service costs, and take-back and recycling costs.
Manufacturing Stage
After the RD&E stage, the company enters the manufacturing stage, in which it spends money—on materials, labor, machinery, and indirect costs—to produce and distribute the product. This stage offers little opportunity for engineering decisions to reduce product costs through redesign decisions since most costs have already been
determined during the RD&E stage. In Exhibit 8-2, the lower curve illustrates how costs are incurred over both the RD&E and the manufacturing cycle. For moderate to long life-cycle products, the costs incurred during RD&E will be less than 10% of total-life-cycle costs. But the decisions made during the RD&E stage will determine 80% of the costs that will be incurred in subsequent stages. Traditional cost account- ing and process improvement methods focus their attention on the manufacturing stage. This is the role for product and process costing, facilities layout, kaizen, bench- marking, and just-in-time manufacturing (discussed in Chapters 4 through 7). These methods help reduce product costs during the manufacturing stage. But they ignore the potential for effective cost management during the RD&E stage.
Postsale Service and Disposal Stage
In the third stage, companies incur costs for postsale service and disposal. Although the costs for service and disposal are committed in the RD&E stage, the actual service stage begins once the first unit of a product is in the hands of the customer. Thus, this stage over- laps somewhat with the manufacturing stage. It typically consists of three substages:
1.Rapid growth from the first time the product is shipped through the growth stage of its sales.
2.Transition from the peak of sales to the peak in the service cycle.
3.Maturity from the peak in the service cycle to the time of the last shipment made to a customer; disposal occurs at the end of a product’s life and lasts until the customer retires the final unit of a product.
Disposal costs include those associated with eliminating any harmful effects associated with the end of a product’s useful life. Products whose disposal could involve harmful effects to the environment, such as nuclear waste or other toxic chemicals, can incur very high salvage, recycling, and disposal costs.
A breakdown of costs for each of the functional life cycles will differ, depending on the industry and specific product produced. Exhibit 8-3 illustrates four types of products and the variation of costs over their total life cycles. For example, the manufacturing Exhibit 8-2
Total-Life-Cycle Costing:
Relationship between
Committed Costs and Incurred Costs
100%
80%
60%
40%
20%
0%
Research, Development, and
Engineering Cycle Manufacturing
Postsale Service and
Disposal
Cost Committed
Costs Incurred
$ Costs
Traditional Accounting
Focus Stages of the
Total Life Cycle
costs of the commercial aircraft company are approximately 40% of total incurred costs.
RD&E and postsale service and disposal incur 20% and 40%, respectively. An understanding of total-life-cycle costs encourages product engineers to select product designs that make them easier to service and easier and less costly to dispose of at the end of their useful life. Computer software development during the RD&E stage creates and debugs the software code. It can cost 100 times more to correct a software defect dur- ing its operating stage than to prevent or catch the bug in the design phase.
Exhibit 8-3
Percentage of Life-Cycle Costs Incurred across Four Types of Products
STAGE OFLIFECYCLE TYPE OFPRODUCT
CYCLE COMBATJETS COMMERCIALAIRCRAFT NUCLEARMISSILES COMPUTERSOFTWARE
RD&E 21% 20% 20% 75%a
Manufacturing 45% 40% 60% a
Service and disposal 34% 40% 20% 25%
Average length of life cycle 30 years 25 years 2 to 25 years 5 years
aFor computer software, both RD&E and manufacturing are often tied directly together.
Japanese engineers in the 1960s developed an approach called target costingto help them consider manufacturing costs early in their design decisions. Target costing helps engineers design new products that meet customers’ expectations and that can be manufactured at a desired cost. Target costing is an important management
T
ARGETC
OSTINGJapanese camera companies use target costing to lower the manufacturing costs of a new generation of products during its research, development, and engi- neering stage.
Reuters Limited
Exhibit 8-4
A Comparison of the Process of Traditional U.S. and Japanese Cost Reduction Methods
TRADITIONALU.S. COSTREDUCTION JAPANESETARGETCOSTING
Market research to determine Market research to determine consumer
customer requirements needs and price points
Product specification Production specification and design
Design Target selling price (Stc)
(and target product volume) Engineering
− Supplier pricing
Target profit (Ptc)
ESTIMATED COST (Ct) ⫽
(if too high, return to design phase)
Desired profit margin (Pt) TARGET COST (Ctc)
⫽
Value Supplier cost
engineering reduction
Expected selling price (St)−Estimated cost (Ct) (Both value engineering and collaboration with suppliers are used to achieve the target
costs for each component)
Manufacturing Manufacturing
Periodic cost reduction Continuous cost reduction
➪
➪ ➪
➪ ➪
➪➪➪ ➪
➪ ➪
➪
accounting method for cost reduction during the design stage of a product’s life cycle and one that can explicitly help to manage total-life-cycle costs.
The traditional product development method followed in the United States and other Western companies is shown as the left-hand column in Exhibit 8-4. It starts with market research into customer requirements for the new product, and the price they are willing to pay for a product that performs according to those requirements.
From this research, engineers determine the product’s specifications to deliver the desired performance. They then perform detailed product design and engineering for the product to meet its specifications.
After the product has been completely designed, the development team re- quests prices from raw materials and component suppliers, and production cost es- timates from manufacturing engineers. This leads to the first estimate of the product’s cost (Ct), where tindicates a product cost estimate derived from this tra- ditional, sequential design and development process. The team then estimates the product’s profit margin (Pt) by subtracting the estimated cost from the expected selling price (St), which has also been determined during the initial market research.
The new product’s profit margin is the difference between the expected selling price and the estimated production cost1as expressed in the following equation:
Pt⫽St⫺Ct
1Robin Cooper developed the structure for comparing costs in this manner in “Nissan Motor Company, Ltd.: Target Costing System,” HBS No. 9-194-040 (Boston: Harvard Business School Publishing, 1994).
Another widely used approach, the cost-plus method, adds the desired profit margin for the product Pcpto the expected product cost (Ccp) where cpindicates num- bers derived from the cost-plus method. This calculation yields the selling price (Scp).
In equation form, this relationship is expressed as follows:
Scp⫽Ccp⫹Pcp
In both the traditional and cost-plus methods, product designers do not attempt to achieve a particular cost target. The company either accepts the profit margin allowed as the difference between the market-determined selling price and the estimated prod- uct cost, or it attempts to set the price sufficiently high to earn the desired margin over the product’s cost, without paying much attention to customers’ willingness to pay. In both methods, product development engineers do not attempt to actively influence the product’s cost. They design the product to meet its specifications and accept the costs as the consequence of their design and development decisions.
Target costing, in contrast, strives to actively reduce a product’s cost during its RD&E stage rather than wait until the product has been released into production to start the cost reduction, or kaizen, process. As previously noted, cost reduction dur- ing the manufacturing stage is generally more costly and less effective than during the RD&E stage. In target costing (see right-hand column of Exhibit 8-4), both the sequence of steps and the way of thinking about determining product costs differ significantly from traditional costing. Although the initial steps—market research to determine customer requirements and product specification—appear similar to tra- ditional costing, target costing introduces some important differences. First, market research under target costing is not a single event as it often is under the traditional approach. Rather, the approach is customer driven, with customer input obtained con- tinually throughout the process. Second, the product engineers attempt to design costs out of the product before design and development ends and manufacturing begins. This approach is particularly effective since, as previously stated, 80% or more of a product’s total-life-cycle costs get committed during the RD&E cycle (review Exhibit 8-2). Third, target costing uses the total-life-cycle concept by adopting the perspective of minimizing the cost of ownership of a product over its useful life. Thus, not only are costs such as the initial purchase price considered, but so are the costs of operating, servicing, maintaining, repairing, and disposing of the product.
In a third target costing innovation, the engineers set an allowable cost for the product that enables the targeted product profit margin to be achieved at a price that customers are willing to pay. With this approach, a target selling price and target prod- uct volume are chosen on the basis of the company’s perceived value of the product to the customer. The target profit margin results from a long-run profit analysis that is often based on return on sales (net income ⫼sales). Return on sales is the most widely used measure because it can be linked most closely to profitability for each product. The target costis defined as the difference between the target selling price and the target profit margin. (Note that tcindicates numbers derived under the target costing approach.) This relationship for the target costing approach is shown in the following equation:
Ctc⫽Stc⫺Ptc
Once the target cost has been set for the entire product, the engineers next determine the target costs for each component in the product. The value engineering processexamines the design of each component to determine whether it is possible to reduce costs while maintaining functionality and performance. In some cases, the engineers can change the product’s or component’s design, substitute new materials, or modify and improve the manufacturing process. For example, a product redesign may enable the same function- ality to be achieved but with fewer parts or with more common rather than unique parts.
Recall from activity-based costing that it is less expensive to produce 10% more from an existing production run than to change over to switch to a low-production run for a spe- cialty component. It is less expensive to order 10% more of a component from an exist- ing supplier than to find a new vendor to order a low quantity of a specialty component.
All of these decisions and trade-offs are best made during the RD&E stage when the product’s design is still fluid rather than during the manufacturing stage when it is far more costly to do a major redesign of a product. Several iterations of value engineering usually are needed before the final target cost gets achieved.
Two other differences characterize the target costing process. First, throughout the entire process, cross-functional product teams made up of individuals repre- senting the entire value chain—both inside and outside the organization—guide the process. For example, it is not uncommon for a team to consist of people from inside the organization (such as design engineering, manufacturing operations, manage- ment accounting, and marketing) and representatives from outside the organization (including suppliers, customers, distributors, and waste disposers).
A second difference is that suppliers play a critical role in making target costing work. Often the company asks its suppliers to participate in finding ways to reduce the cost of specific components or an entire subassembly or module. Companies offer incentive plans to suppliers who come up with the largest cost reduction ideas. As companies work more closely with their suppliers during the RD&E stage, they use a set of methods collectively known as supply chain management. Supply chain management develops cooperative, mutually beneficial, long-term relationships between buyers and suppliers. The benefits are many. For example, as trust develops between buyer and supplier, decisions about how to resolve cost reduction problems can be made with shared information about various aspects of each other’s opera- tions. In some organizations, the buyer may even expend resources to train the supplier’s employees in some aspect of the business, or a supplier may assign one of its employees to work with the buyer to understand a new product. Such interactions are quite different from the short-term, arms-length relationships that are character- istic of a transactions-based buyer–seller relationship.
A Target Costing Example
How does target costing actually work in practice?2We illustrate the target costing process with an example drawn from actual experiences but using a hypothetical company, Kitchenhelp, Inc.
Among other products, Kitchenhelp manufactures coffeemakers. Market research has identified eight features of a coffeemaker that are important to customers:
1.Coffee tastes and smells like espresso.
2.The coffeemaker is easy to take apart and clean.
3.Capacity is at least six cups.
4.The coffeemaker has an attractive design (since it is continually visible as it sits on a kitchen counter).
5.The coffeemaker has a clock timer to start automatically at a designated time.
6.The grinder performs well with different kinds of coffee beans.
7.The coffeemaker keeps the coffee warm after making it.
8.The coffeemaker automatically shuts off after a designated time period.
2We thank Shahid Ansari, Jan Bell, Tom Klammer, and Carol Lawrence for allowing us to use this example from their book Target Costing(Boston: Houghton Mifflin Company, 2004).
These customer requirements become the basis for the engineering design of the cof- feemaker. Engineers must ensure that the product encompasses all of the features that are important to customers. Assume that Kitchenhelp’s current coffeemaker unit costs $50 to manufacture. Management has decided that the cost of the new unit has to be reduced to broaden its appeal to a much larger customer audience.3Product engineers perform cost analysis and value engineering to reduce the cost of each of the coffeemaker’s components.
Cost Analysis
For Kitchenhelp, cost analysis involves determining what components of the cof- feemaker (heating element, control panel, or grinder) to target for cost reduction and then assigning a cost target to each of these components. Cost analysis also focuses on the interaction between components and parts. Often a reduction in the cost of one component may be more than offset by a cost increase elsewhere. For example, decreasing the cost of the outer shell of the coffeemaker by making it smaller may increase the costs of shrinking the size of the control panel, electronic circuitry, and heating element. Cost analysis requires five subactivities:
1. Develop a list of product components and functions. Cost reduction efforts start by listing the various product components and identifying the functions that they per- form and their current estimated cost. The initial product design and cost estimates provide this information. The list tells us what components and functions are needed to satisfy customer requirements and what it might cost to provide these functions.
Exhibit 8-5 shows a diagram of the various components of the proposed coffeemaker.
2. Perform a functional cost breakdown. Each of the various parts and compo- nents of the coffeemaker performs a specific function. The next step is to identify that function and to estimate the cost. The functional cost breakdown is shown in
Exhibit 8-5 Major
Components of Kitchenhelp’s Proposed Coffeemaker
Drive shaft
Brew basket assembly
Lid release Well lid Water well Water tap arm Carafe lid
Glass carafe Handle
Warmer Coffee bean
measurer Brew
basket lid
Brew basket Filter Gear Basket base Water level indicator Plug Cord Body Blade
3To simplify the example, we assume that selling, general, and administrative costs stay the same, although in practice these costs can change as well.
Exhibit 8-6. For example, the function of the brew basket is to grind and filter coffee.
The current estimated cost is $9 for the basket, which represents 18% of the total manufacturing cost for this product. To keep the example simple, we have com- bined several functions and components for the coffeemaker. At a detail level, the brew basket or the electronic control panel will be broken into several subcompo- nents. The total for all components is $50.
3. Determine the relative importance of customers’ requirements. Engineers often have a different view of a product’s functionality than customers. Recall that Kitchenhelp had identified eight features important to its customers. The engineer’s view of a product as a collection of functions must be reconciled with a customer’s view of a product as a set of performance features. To connect a product’s functions to the features that customers want, engineers first assess the relative importance that customers place on the various features. They conduct a formal survey of prospec- tive customers asking them to rank the relative importance of the product’s eight fea- tures. The results from this survey are shown in Exhibit 8-7. The importance ranking is based on a scale from 1 to 5, where a 5 means that the feature is very important and a score of 1 indicates that it is unimportant. From this exhibit, we learn that the taste and smell of coffee is the most important feature, and multiple grinder settings is the least important.
Exhibit 8-6 Functional Cost Breakdown for Kitchenhelp’s Coffeemaker
COST
COMPONENT FUNCTION AMOUNT PERCENT
Brew basket Grinds and filters coffee $9 18%
Carafe Holds and keeps coffee warm 2 4
Coffee warmer Keeps coffee warm 3 6
Body shape and water well Holds water and encasement 9 18
Heating element Warms water and pushes it 4 8
Electronic display panel Controls grinder/clock settings 23 46
Total $50 100%
Exhibit 8-7
Customer Feature Ranking for Kitchenhelp’s Coffeemaker
CUSTOMERREQUIREMENTS CUSTOMERRANKING RELATIVERANKING
1 5
NOTIMPORTANT VERYIMPORTANT INPERCENT
Coffee tastes and smells like espresso 5 20%
Coffeemaker is easy to clean 4 16
Looks nice 2 8
Has 6⫹cup capacity 3 12
Starts automatically at designated time 4 16
Works well with different coffee beans 1 4
Keeps the coffee warm 3 12
Automatically shuts off 3 12
Total 100%
The last column of Exhibit 8-7 converts the raw scores for the importance of features into a relative ranking of features. The total feature score is 25 (calculated as 5 ⫹4⫹2⫹ 3⫹4⫹1⫹3⫹3⫽25) and each feature’s score gets expressed as a percentage of this total score of 25. For example, coffee taste has a ranking of 20% (a score of 5 out of 25) indicating that 20% of the total value a customer derives from this coffeemaker comes from the taste of the coffee.
4. Relating features to functions. Engineers can now convert the relative rankings of features into an importance ranking for each product function. Since components carry out the functions of a product and are the key design parameters, this step relates customer rankings to the components that best meet that particular requirement. The engineers use a tool called a quality function deployment (QFD) matrixfor display- ing the information about these three variables—features, functions (components), and competitive evaluation—in a matrix format.
The QFD matrix (see Exhibit 8-8 for Kitchenhelp’s coffeemaker) highlights the relationships among competitive offerings, customer requirements, and design parameters. The QFD matrix summarizes the information about product functions from Exhibit 8-6 with customer rankings from Exhibit 8-7. It adds two other pieces of information that have been collected during market research: the correlation between a component or design parameter and customer requirements and information about how customers evaluate competitor offerings on these same features.
The matrix shows that the requirement that the coffee taste like espresso has a high correlation with the design of the brew basket and the heating element. Similarly, how many cups the coffeemaker can hold is correlated to the water well and carafe size. It also shows that taste, the most important feature to a customer, is currently rated at 3 for Kitchenhelp and 2 for its competitor. This tells Kitchenhelp that while it is ahead of the competition, it still is far from the customer’s ideal taste experience. On appearance, the competition obviously has a better looking product, with a rating of 5. However, the customer ranking for this feature is 2, which suggests that Kitchenhelp should not spend much of its resources to improve the coffeemaker’s appearance.
Exhibit 8-8
A QFD Matrix for Kitchenhelp’s Coffeemaker
COMPONENTS OR BODY/ COMPARISON CUSTOMER
FUNCTIONS➞ BREW COFFEE WATER HEATING DISPLAY COMPETITOR VS. FEATURE
BASKET CARAFE WARMER WELL ELEMENT PANEL OURPRODUCT RANKING
CUSTOMERREQUIREMENTS 1 2 3 4 5
Tastes/smells like espresso ▲ ▲ ■ ❏ 5
Easy to clean ● ● ▲ ❏ ■ 4
Looks nice ▲ ▲ ❏ ■ 2
Has 6⫹cup capacity ▲ ▲ ■ ❏ 3
Starts automatically on time ▲ ❏ ■ 4
Works with different beans ❍ ▲ ■ ❏ 1
Keeps the coffee warm ● ▲ ■ ❏ 3
Automatic shutoff ▲ ❏ ■ 3
Correlation of design parameters and customer requirements: Comparative competitor
▲⫽Strong correlation rankings:
●⫽Moderate correlation ■⫽Competitor ranking
❍⫽Weak correlation ❏⫽Our ranking
➞
5. Develop relative functional rankings. The QFD matrix enabled the engineers to convert feature rankings into functional or component rankings, shown as a general association in Exhibit 8-8. This is valuable but the engineers still need one additional piece of information: the percentage that each component contributes to a customer feature, as shown in Exhibit 8-9. You can see in this exhibit that the feature “Tastes/
smells like espresso” depends on the design of the brew basket and heating element (an association also shown in Exhibit 8-8). Engineers feel that the brew basket and heating element component contribute equally to the “taste” feature, and they assign each a 50%
contribution to taste. The relative value ranking of the “taste” feature is 20%. Therefore, since both components contribute equally, they assign each of the two components a value ranking of 10%. The last row of Exhibit 8-9 showseach component’s approximate value to a customerby adding up all the value contributions from a component to all customer-desired features. You can see that the brew basket component has an overall value of 15% to a customer, and that the carafe has a value of 10%. Note that the last row and last column add up to 100%. They are simply different views of customer values.
The last column represents the value of each feature, and the last row represents the value of each component that delivers the desired features.
Conduct Value Engineering
Once the five-step cost analysis has been completed, engineers start the value engi- neering (VE) activity. During VE, engineers analyze the functions of the various com- ponents and attempt to improve the components’ and product’s design to lower overall cost without reductions in required performance, reliability, maintainability, quality, safety, recyclability, and usability. For example, the purpose or function of a heating element is to heat water to a desired temperature. Value engineering asks how the function of raising room temperature water to 110 degrees within three minutes can be accomplished at a lower cost. It analyzes both product and manufac- turing process design and reduces costs by generating ideas for simplifying both.
Exhibit 8-9
Kitchenhelp Coffeemaker: Percentage Contribution of Each Component to Customer Requirements
COMPONENTS➞ BODY/ RELATIVE
BREW COFFEE WATER HEATING DISPLAY FEATURE
CUSTOMER BASKET CARAFE WARMER WELL ELEMENT PANEL RANKING
REQUIREMENTS
Tastes/smells like
espresso 50% ⫻20⫽10 50%⫻20⫽10 20%
Easy to clean 30% ⫻16⫽4.8 10% ⫻16⫽1.6 60%⫻16⫽9.6 16
Looks nice 60%⫻8⫽4.8 40%⫻8⫽3.2 8
Has 6⫹cup capacity 50%⫻12⫽6 50%⫻12⫽6 12
Starts automatically
on time 100%⫻16⫽16 16
Has multiple grinder
settings 5%⫻4⫽0.2 95%⫻4⫽3.8 4
Keeps the coffee warm 20%⫻12⫽2.4 80% ⫻12⫽9.6 12
Automatic shutoff 100%⫻12⫽12 12
Converted component
ranking 15.0 10.0 9.6 20.4 10.0 35.0 100%
➞
Value engineering is a key activity within target costing and consists of the following two subactivities:
1. Identify components for cost reduction. Choosing which components to select requires computing a value index. This is the ratio of the value (degree of importance) to the customer and the percentage of total cost devoted to each component. For the coffeemaker, the value information appears in the last row of Exhibit 8-9, and the rel- ative cost information is in the last column of Exhibit 8-6. Both of these quantities are expressed as percentages. Exhibit 8-10 shows the value index calculation and its implications for cost reduction. Components with a value index of less than 1 are candidates for value engineering. Components with a high value index are candi- dates for enhancement since we are spending too little for a feature that is important to the customer. These components present an opportunity to enhance the product.
Cost and relative importance are plotted in Exhibit 8-11.
The optimal value zone in Exhibit 8-11 indicates the value band in which no action is necessary. The optimal value zone is based on the experience and opinions of target costing team members. The zone is usually wider at the bottom of the value index chart, where low importance and low cost occur, and narrower at the top, where features are important and cost variations are larger. The area of the graph above the optimal value zone indicates components that are candidates for cost reduction. Items below the zone are candidates for enhancement.
Exhibit 8-10
Value Index for Kitchenhelp’s Coffeemaker
COMPONENTCOST RELATIVEIMPORTANCE
COMPONENT ORFUNCTION (%OF TOTAL) (EX. 8-6) (EX. 8-9) (IN%) VALUEINDEX(COL3⫼2) ACTIONIMPLIED
Brew basket 18 15.0 0.83 Reduce cost
Carafe 4 10.0 2.50 Enhance
Coffee warmer 6 9.6 1.60 Enhance
Body shape and water well 18 20.4 1.13 O.K.
Heating element 8 10.0 1.25 Enhance
Electronic display panel 46 35.0 0.76 Reduce cost
100% 100%
Exhibit 8-11 Value Index Chart for Kitchenhelp’s Coffeemaker
Reduce cost
Enhance Display
Relative Importance
Relative Cost
Brew basket Heater Warmer
50 45 40 35 30 25 20 15 10 5
0 10 20 30 40 50
Optimal valuezone Body
Carafe
2. Generate cost reduction and function enhancement ideas. Engineers engage in creative thinking and brainstorming to identify what can be reduced, eliminated, com- bined, substituted, rearranged, or enhanced to provide the same or higher level of func- tionality from a component at less cost. Exhibit 8-12 lists several of the cost reduction ideas that Kitchenhelp’s engineers have proposed to reduce the cost of the electronic display panel, the prime target for cost reduction identified by the value index. Perhaps reducing the number of parts, simplifying the assembly, and not overengineering the product beyond what a customer needs will lower cost. Finally, testing and imple- menting ideas is the last subactivity within value engineering. Promising ideas are eval- uated to ensure that they are technically feasible and acceptable to customers.
Concerns about Target Costing
Although target costing has some obvious advantages, some studies of target costing indicate potential problems in implementation, especially if a focus on meeting the target cost diverts attention away from the other elements of overall company goals.4 Consider the following examples:
1. Lack of understanding of the target costing concept. For many in the West, target costing is not a mainstream concept. Without a clear understanding of the ben- efits, many senior executives reject the idea.
2. Poor implementation of the teamwork concept. Teamwork and trust issues can lead to significant problems in implementing target costing. In some cases, companies put excessive pressure on subcontractors and suppliers to conform to schedules and reduce costs. This can lead to alienation or failure of the subcontrac- tor. Sometimes design engineers become upset when other parts of the organization are not cost conscious; they argue that they exert much effort to squeeze pennies out of the cost of a product while other parts of the organization (administration, marketing, and distribution) are wasting dollars. Thus, many organizations must enhance cross-functional teamwork, trust, and cooperation to succeed at target costing.
3. Employee burnout. Employees, especially design engineers in Japanese compa- nies, work under continual pressure to meet target costing goals and eventually expe- rience burnout from the pressure and become far less effective in their jobs.
4. Overly long development time. Although the target cost might be met, devel- opment time may increase because of repeated value engineering cycles to reduce
4See M. Sakurai, “Past and Future of Japanese Management Accounting,” Journal of Cost Management (Fall 1995): 1–14; and Y. Kato, G. Boer, and C. W. Chow, “Target Costing: An Integrated Management Process,” Journal of Cost Management(Spring 1995): 39–51.
Exhibit 8-12 Kitchenhelp Coffeemaker:
Electronic Display Panel Value Engineering Ideas to Reduce Cost
PANELSUBCOMPONENT COSTREDUCTIONIDEA
Power supply Reducewattage—more than needed in current design.
Flexible circuit Eliminateflexible circuit. Use wiring harness.
Printed wire board Standardizeboard specifications. Use mass-produced unit.
Clock timer Combinewith printed wire board.
Central processor chip Substitutestandard 8088 chip instead of custom design.
Heater connector Rearrangelayout of board to heater connection.
costs, ultimately leading to the product coming late to market. For some types of prod- ucts, being six months late may be far more costly than having small cost overruns.
Companies may find it possible to manage many of these factors, but organi- zations interested in using the target costing process should be aware of them be- fore immediately attempting to adopt this cost reduction method. The behavioral issues associated with motivating employees to meet ambitious targets are partic- ularly important to consider. We will discuss these issues more fully in Chapter 9.
Despite these concerns, target costing does provide engineers and managers with a great tool at the time of greatest leverage, the RD&E stage, to reduce total-life- cycle product costs.
A survey conducted by Kobe University of Japanese companies showed that of those responding, 100% of transportation equipment manufacturers, 75% of precision equipment manufacturers, 88% of electrical manufacturers, and 83% of machinery manufacturers stated that they used target costing.5These companies had been expe- riencing diminishing returns from their kaizen costing and just-in-time production systems and were looking for new opportunities to reduce manufacturing and service costs by focusing on cost reduction activities that could be accomplished during the RD&E stage.6
In the United States, target costing has gained momentum as a management method; however, it is not only a method of cost control but also a comprehensive IN PRACTICE
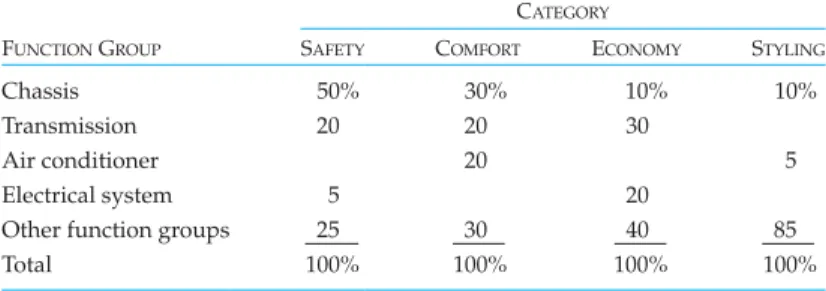
Target Costing and the Mercedes-Benz M-Class In the early 1990s, Mercedes-Benz wanted to develop a new line of SUVs, the Mercedes-Benz M-Class. Pro- duction began in 1997 at the Tuscaloosa plant in Alabama. Mercedes decided to use target costing to help them define costs before they were committed.
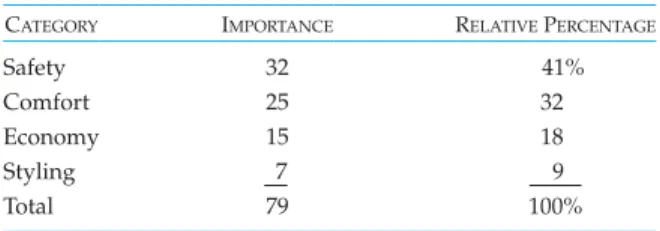
Mercedes relied on a number of customer, design, product, and marketing clinics before manufacturing the product and determined that safety, comfort, econ- omy, and styling were the four key characteristics that customers were concerned about. Engineers deter- mined that the key components for the automobile
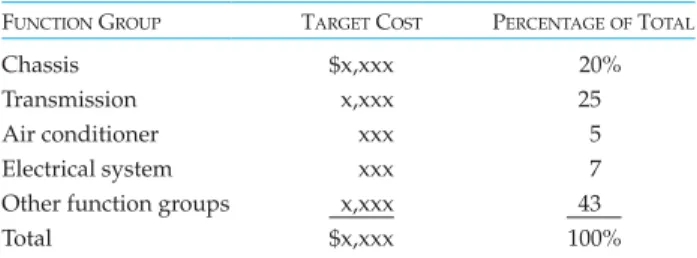
were the chassis, transmission, air conditioner, electri- cal system, and other systems.
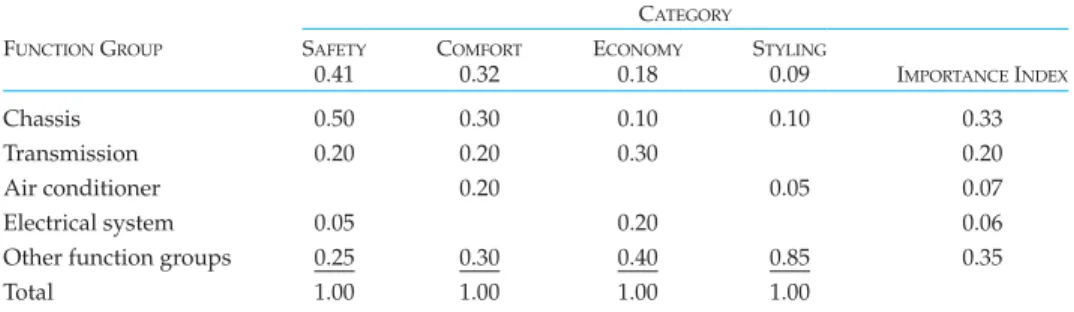
Using an approach very similar to the one used for design and development of the Kitchenhelp cof- feemaker, Mercedes determined the relationships among customer requirements and engineering components.
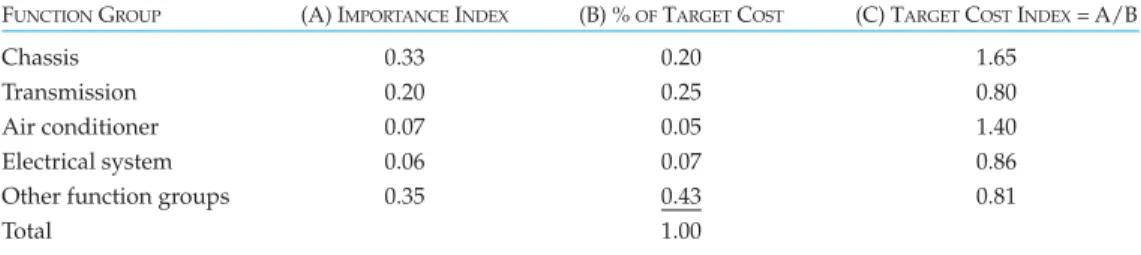
What follows is an illustration of how the final value index for the Mercedes-Benz M-Class might look. The value index shows that both the chassis and the air con- ditioner could be enhanced, while the transmission, elec- trical system, and other systems’ costs could be reduced.
Source:Professor Thomas L. Albright, “Use of Target Costing in Developing the Mercedes-Benz M Class,” class presentation, University of Alabama.
COMPONENT ORFUNCTION
COMPONENTCOST
(%OFTOTAL) RELATIVE
IMPORTANCE(%) VALUE
INDEX
ACTION
IMPLIED
Chassis 20 33 1.65 Enhance
Transmission 25 20 0.80 Reduce cost
Air conditioner 5 7 1.40 Enhance
Electrical systems 7 6 0.86 Reduce cost
Other systems 43 35 0.81 Reduce cost
5See Kato et al., “Target Costing.”
6See R. Cooper and R. Slagmulder, Target Costing and Value Engineering(Portland, OR: Productivity Press, 1997).
approach to profit planning and cost management. Companies such as Boeing, Texas Instruments, Eastman Kodak, and DaimlerChrysler have successfully adopted target costing in their businesses.7
8Charles H. House and Raymond L. Price, “The Return Map: Tracking Product Teams,” Harvard Business Review(January–February 1991): 92–100; also Marvin L. Patterson, “Designing Metrics,”
Chapter 3 in Accelerating Innovation: Improving the Process of Product Development(New York: Van Nostrand Reinhold, 1993).
9For financial reporting purposes, research and development expenses are expensed each reporting period (fiscal year quarter) so many companies never accumulate in one account the total spending on a project over the multiple periods required for the RD&E stage.
7See J. Dutton and M. Ferguson, “Target Costing at Texas Instruments,” Journal of Cost Management (Fall 1996): 33–38.
B
REAKEVENT
IME: A C
OMPREHENSIVEM
ETRIC FORN
EWP
RODUCTD
EVELOPMENTNew product development requires work to be performed by many of an organiza- tion’s departments: marketing, engineering, finance, operations, sales, and service. In many companies, the work in these various departments is not coordinated well; each department does its own job by receiving inputs from one or more departments, per- forming its work, and, when finished, handing its work output to another department.
Such fragmented, compartmentalized activities lead to poor hand-offs between departments, delays, high costs, and frequent errors.
Product development delays are particularly problematic since delaying the launch of a product into the market by six months can cost a company up to 35% of the product’s lifetime profits, a far more consequential loss than exceeding the project’s R&D budget by 10%. Target costing, as we described, does an excellent job of reducing total-life-cycle costs. But like all cost-based measures, it does not reflect all of the economic factors associated with creating value for customers and share- holders. Companies that are attempting to manage an intangible asset such as their new product pipeline are particularly in need of nonfinancial measures, the motiva- tion for the Balanced Scorecard that we discussed in Chapter 2.
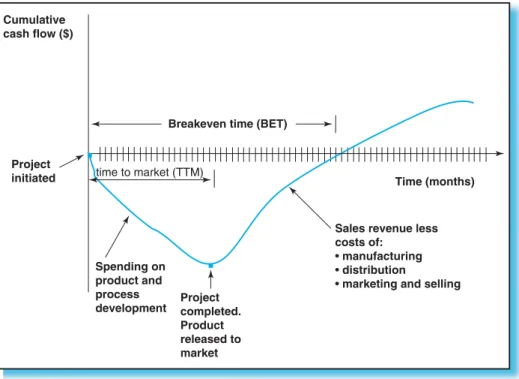
Several decades ago, Hewlett-Packard engineers developed a comprehensive metric for the product development process, called the breakeven time (BET), to motivate and measure the benefits from cross-functional integration during the prod- uct development cycle.8BET measures the length of time from the project’s beginning until the product has been introduced and generated enough profit to pay back the investment originally made in its development (see Exhibit 8-13). BET brings together in a single measure three critical elements in an effective and efficient product devel- opment process. First, for the company to break even on its RD&E process, its invest- ment in the product development process must be recovered. So BET requires tracking the entire cost of the design and development process.9It provides incentives to make the product development process faster and less costly. Second, BET stresses profitability. It encourages marketing managers, manufacturing personnel, and design engineers to work together to develop a product that meets real customer needs, including offering the product through an effective sales channel at an attrac- tive price, and at a manufacturing cost that enables the company to earn profits that can repay the product development investment cost. Third, BET is denominated in time: it encourages the launch of new products faster than the competition so that higher sales can be earned sooner to repay the product development investment.
Beyond the technical aspects of the BET measure, which we will illustrate shortly, success in improving the comprehensive measure encourages collaboration and
integration across organizational functions. It allows people from different disciplines to come together at the start of every product development project to estimate the time and money they require to perform their tasks, and the impact of their efforts on the success of the entire project. The metric facilitates discussion and decision making during the project among people from the multiple functions as more information about the project, customers, and competitors becomes available.
The breakeven time graph (see Exhibit 8-13) plots cumulative profits on the yor vertical axis, and elapsed time on the x or horizontal axis. Initially, the company spends on market research and on developing the technical specifications for the new product, such as its features, target cost and price, feasibility of the proposed manu- facturing technology and processes, and preliminary project plan. These initial costs, at the start of the project, cause the project’s profit curve to head in the negative direction since the project is unprofitable at this point. If the project is approved for further development, additional costs get incurred for product development, value engineering, building prototypes, testing, and doing the engineering changes to develop a feasible product along with its associated manufacturing processes. The RD&E stage ends when the company makes a commitment to produce, sell, and deliver the product.
As production gears up during the manufacturing stage, sales get realized and, as assumed in Exhibit 8-13, if the sales revenues exceed the production, marketing, sales, and distribution costs of the product, the cumulative profitability curve finally heads upward. Eventually, the company hopes that the profits earned over the initial years of the product’s launch will repay its front-end marketing research and all RD&E costs. BET measures how long it takes for these initial costs to be recovered.
Of course, the goal is not just to break even but to earn a substantial profit from the new product launch. To keep the analysis simple, the HP engineers found that a focus on the time required just to break even on the project stimulated a productive Exhibit 8-13
Illustration of Breakeven Time
Cumulative cash flow ($)
Project initiated
Breakeven time (BET)
Time (months)
Spending on product and process
development Project completed.
Product released to market
Sales revenue less costs of:
•manufacturing
•distribution
•marketing and selling time to market (TTM)
and collaborative dialogue among employees in the marketing, engineering, manu- facturing, finance, sales, logistics, and service departments.10
We illustrate these points with a simple numerical example. Consider the data shown in panel A of Exhibit 8-14 for Greyson Technology’s launch of a new digital communications device. The project’s cross-functional project team prepared the data shown in panel A after extensive discussion of the new product’s specification’s, estimated RD&E time, and the likely selling price, manufacturing cost, rate of sales, and incremental marketing, distribution, sales, and service costs. The team anticipated that market research and subsequent product development would take seven quarters
10As introduced at HP and illustrated here, the BET metric does not account for the time-value of money. This is a significant omission for most development projects where the BET is measured in several years. It is a simple extension to use net present value techniques (not discussed in this text- book) to calculate a discounted breakeven time metric, which will always be longer than the undis- counted version described in this chapter.
Exhibit 8-14
Greyson Technology New Product Introduction
Panel A
Y1, Q1 Y1, Q2 Y1, Q3 Y1, Q4 Y2, Q1 Y2, Q2 Y2, Q3 Y2, Q4 Y3, Q1 Y3, Q2 Y3, Q3 Y3, Q4 Market research* (100) (50)
Product development* (80) (200) (200) (200) (200) (60)
Selling price 20 20 20 19 19 18
Cost per unit 12 11 10 10 10 10
Margin/unit 8 9 10 9 9 8
Sales quantity* 25 40 50 50 50 50
Contribution* 200 360 500 450 450 400
MSDA expenses* 80 100 120 120 120 120
Product profi t* 120 260 380 330 330 280
Quarterly profi t/loss* (100) (130) (200) (200) (200) (200) 60 260 380 330 330 280 Cumulative profi t/loss* (100) (230) (430) (630) (830) (1,030) (970) (710) (330) − 330 610
Panel B
Y1, Q1 Y1, Q2 Y1, Q3 Y1, Q4 Y2, Q1 Y2, Q2 Y2, Q3 Y2, Q4 Y3, Q1 Y3, Q2 Y3, Q3 Y3, Q4 Market research* (100) (50)
Product development* (100) (250) (250) (250) (250)
Selling price 22 22 22 22 20 20 20
Cost per unit 12 11 10 10 10 10 10
Margin/unit 10 11 12 12 10 10 10
Sales quantity* 30 40 50 50 50 50 50
Contribution* 300 440 600 600 500 500 500
MSDA expenses* 80 100 120 120 120 120 120
Product profi t* 220 340 480 480 380 380 380
Quarterly profi t/loss* (100) (150) (250) (250) (250) (30) 340 480 480 380 380 380 Cumulative profi t/loss* (100) (250) (500) (750) (1,000) (1,030) (690) (210) 270 650 1,030 1,410
*In thousands
(20 months) to launch the new product, and a total of $1,090,000 of spending over this time period. Once launched, the team expected that the product would have a selling price of $20 per unit, cost per unit of $12, and first quarter sales of 25,000 units. It also estimated the MSDA expenses associated with this new product ($80,000 in the initial quarter, increasing up to $120,000 in future quarters). The team anticipated some modest production cost reductions due to learning effects and application of kaizen costing during the first few months of production. It also forecasted that as the market for the device matured and lower cost competitors entered, the selling price and margins would begin to erode.
Combining all of these data—product development time and cost, selling prices, production costs, sales quantities over time, and MSDA expenses—the example shows a BET of 30 months; the product recovers its $1,090,000 development costs at the end of the second quarter in year 3. Although the actual calculation of BET is simple, its calculation requires the active participation of key employees from multi- ple departments to provide information on new product features and functionality, development time and cost, expected selling price and volumes, and expected man- ufacturing and MSDA costs over the product’s useful lifetime.
The BET metric allows the product development team to conduct sensitivity analyses on key parameters in the product’s development process. Many companies, when financial difficulties arise, respond by slowing down the spending on new prod- uct development. But this action will delay the time when the product comes to the market; at this later date, the product will likely be be a follower, not a product leader;
as such, it will command a lower selling price and generate lower sales volumes.
Quarterly financial reporting shows the benefits from reduced spending on RD&E but not the loss in future revenues and profits from bringing the product to market a year or two later. By having a metric such as BET readily available, perhaps Greyson’s managers will see that reducing the spending on RD&E now causes a much larger loss in future cash flows.
Consider the alternative scenario shown in panel B of Exhibit 8-14 in which the development team contemplates accelerating product development by spending more during the RD&E stage. For example, they plan to raise spending by $50,000 per quarter to $250,000 between year 1, quarter 3, and year 2, quarter 2. Because of the higher and more intensive spending, Greyson launches the product three months earlier. This brings the product to market faster, opening up a longer lead time before competitors can offer rival products with similar functionality. As a consequence, the initial selling price is 10% higher and opening period sales are also somewhat higher.
Even with the higher total spending on RD&E in the panel B scenario, Greyson breaks even on the project in the middle of year 3, quarter 1, five months earlier than in the original scenario. Of course, the sustainable profits, beyond the breakeven time, are also substantially higher in the panel B scenario because of the advantages from being the first-to-market with the new technology.
Among the other scenarios to consider might be a product with less innovative functionality, which would require a shorter and less expensive development time, but also lower market share, and lower selling price and a longer BET. Conversely, the development team can also debate, at the start of the project, the consequences from a longer and more expensive product development process caused by attempting to meet highly demanding specifications from the marketing study.
The BET metric is not a decision-making tool. It does, however, offer a means by which a multifunctional product development team can conduct productive discus- sions and make trade-offs between the time, cost, and functionality of new product proposals along with the product’s anticipated sales volume and prices, and produc- tion and other organizational costs.