Chabot, Crystal structures and crystal chemistry of ternary rare earth transition metal borides, silicides and homologs 113. Rogl, Phase equilibria in ternary and higher order systems with rare earth elements and silicon 1 52.K.H.J.
C. Kang *
INTRODUCTION
Before Professor Leroy Eyring died, he changed the content of his interest on his internet website homepage to "Oxygen and Hydrogen Source for the Hydrogen Economy". The unique non-stoichiometric features of higher lanthanide oxides are also highlighted and the intrinsic relationship between macroscopic properties and nanometer-scale structures is shown.
HISTORICAL OVERVIEW OF THE LANTHANIDE HIGHER OXIDES
The transformation matrices establishing the relationship between the fluorite subcells and the fluorite-related supercells for most of the new phases have been found. For theδ phase it is even difficult to determine the number of oxygen atoms in the unit cell or the relationship between the fluorite f.c.c.

INTRINSIC FEATURES OF THE LANTHANIDE HIGHER OXIDES
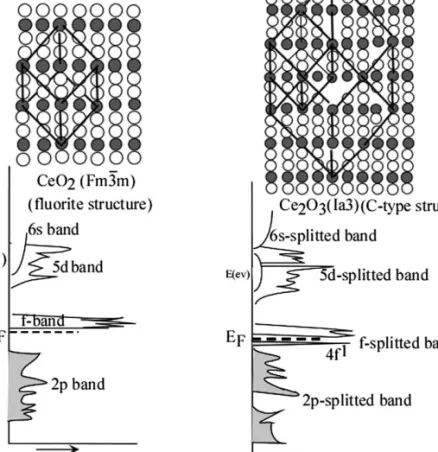
Beyond the large differences in unit cell volumes, the basis of this difference was the relationship between the fluorine f.c.c. diffraction spots and superstructure spots of intermediate phases. As a result, the unit cell of Ce2O3 is twice the size of the fluorine phase and the symmetry changes from Fm-3m.
THERMODYNAMIC PROPERTIES OF THE LANTHANIDE HIGHER OXIDES
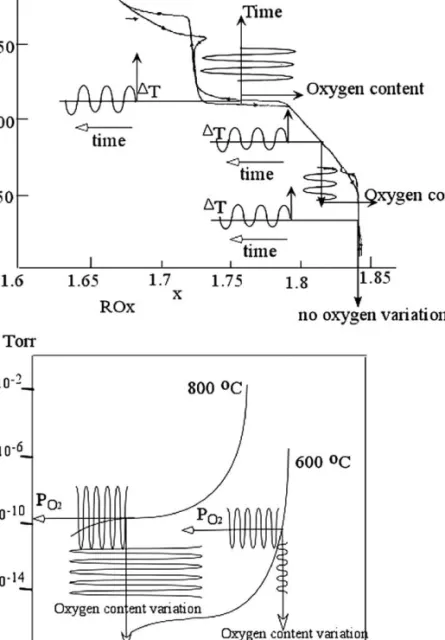
- Phase diagrams with bi-variant parameters: temperature and oxygen partial pressure
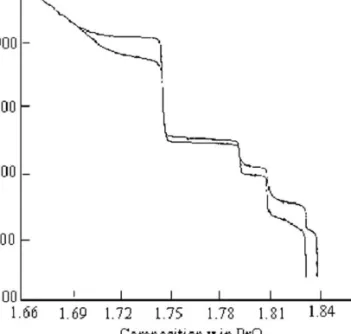
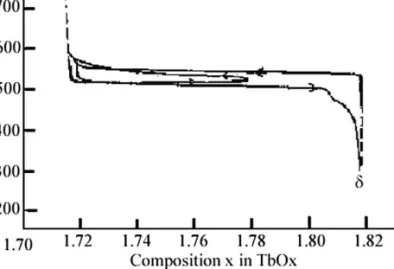
- Hysteresis and composition domains
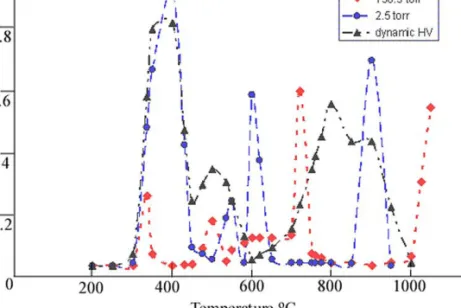
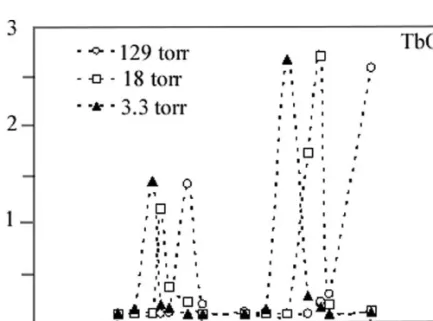
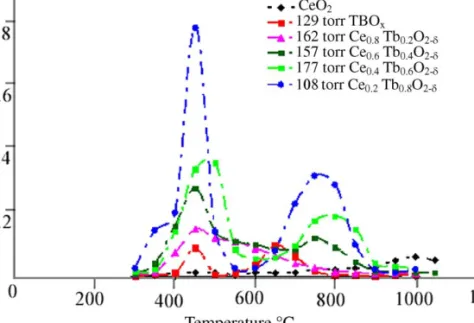
- Oxygen releasing features of the binary and ternary oxides containing Ce, Pr, Tb
The oxygen content of the higher lanthanide oxides always varies with temperature and oxygen partial pressure. As noted in the previous section, the heat treatment history will largely determine the oxygen content of the higher lanthanide oxides.

STRUCTURAL CHARACTERISTICS OF THE LANTHANIDE HIGHER OXIDES
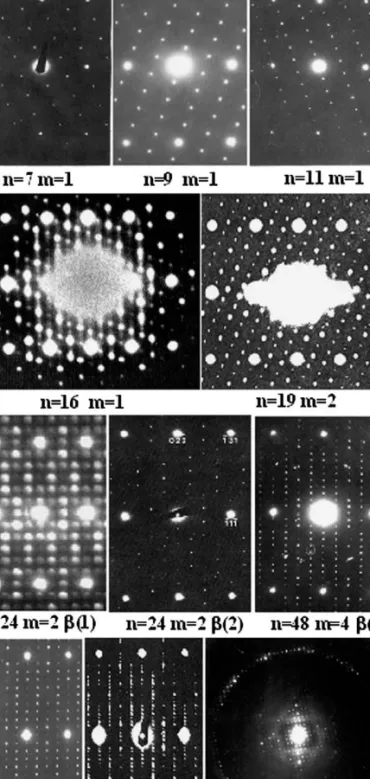
- Experimental electron diffraction data of the lanthanide higher oxides
- Refined structures of the five homologous phases of the lanthanide higher oxides from experimental neutron diffraction data
- Fluorite-type module theory
- Rationalization of homologous series of oxygen-deficient
- Coordination number of the lanthanide metal in the lanthanide higher oxides
- Module type and average valence state of the lanthanide higher oxides
- Composition domains in the lanthanide higher oxides
- Surface character and oxygen migration
- Structural modeling the undetermined structure of the lanthanide higher oxides
- From the binary oxide to the ternary oxide
It is well known that in the higher lanthanide oxides the coordination number of the lanthanide cation is 6, 7 or 8. This is how the broad non-stoichiometry of the higher lanthanide oxides can be formed.
CONDUCTIVITY AND CATALYTIC PROPERTIES OF THE LANTHANIDE HIGHER OXIDES
- Electrical conductivity of the lanthanide higher oxides
- Conductivity of the ternary lanthanide higher oxides
- Catalytic properties of the lanthanide higher oxides
- Solvolytic disproportionation of the lanthanide higher oxides
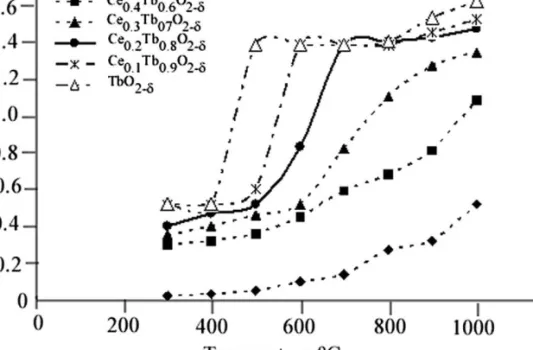
Because the oxygen content of the higher oxides is dominated by the oxygen partial pressure, the conductivity of the higher lanthanide oxide must be measured as a function of the oxygen partial pressure. The configuration of the oxygen vacancies determines the diffusivity of the oxygen vacancy (Shuk and Greenblatt, 1999). It appears that the ternary and quaternary of the higher lanthanide oxides have potential applications in the catalyst field (Bernal et al., 2005a, 2005b).

SUMMARY
The "Swiss cheese" shows the difference between the lanthanide higher oxides and a mixed valent transition metal oxide, for example Pb3O4. The PbO2 crystal formed by leaching of Pb3O4 is crystallized from the solution in which the dissolved Pb2+ reacts with H2O which forms Pb4+ and precipitates a crystal of PbO2 (Kang et al., 1988c). Figure 48 shows the leaching process of Pb3O4 . The module theory, developed by Professor LeRoy Eyring, can be used to elucidate the thermodynamic properties, hysteresis, fast anion migration, the structures and the redox reactions of the oxygen-deficient fluorite-related homologous series of the lanthanide higher oxides.
ACKNOWLEDGEMENTS
Professor Leroy Eyring's contributions will promote applications in redox catalysis, oxygen sensing and mixed conductors, IT-SOFC, oxygen and hydrogen production.
CHAPTER 237
SYNTHESIS
This simple technique enables reactions at high temperatures in relatively short reaction times (Pöttgen et al., 1999b). In some cases, it was possible to brake high quality single crystal sheets (a few mm2in area) out of the solidified buttons (Chinchure et al., 2002). The latter has been successfully used for the growth of phosphide crystals (Kanatzidis et al., 2005).
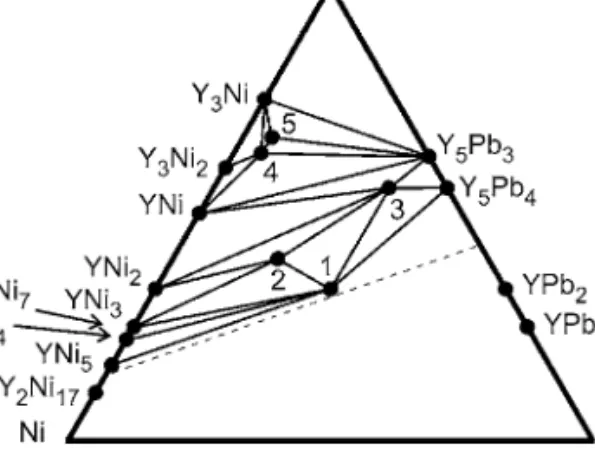
PHASE DIAGRAMS
Typically, the arc fused blocks are sealed in evacuated silica ampules and annealed at temperatures between 670 and 870 K, depending on the compound composition. A method that has hardly been used to date for the synthesis of the RxTyPbzplumbides is the lead flux. This difference becomes clear when we look at the binary Ni-Sn(Pb) and Cu-Sn(Pb) systems (Massalski, 1986).
CRYSTAL CHEMISTRY
- Lattice parameters
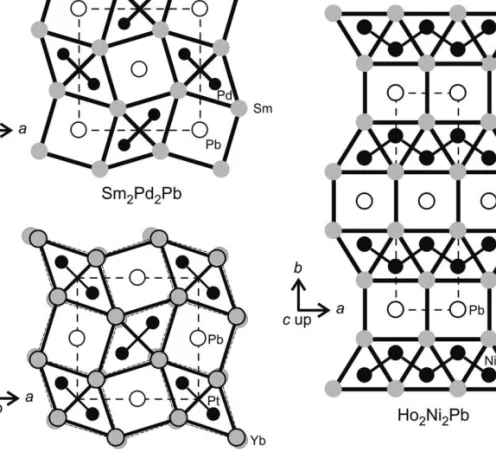
- The structure types Mo 2 FeB 2 , Er 2 Au 2 Sn and Mn 2 AlB 2
- The structure types KHg 2 and TiNiSi
- The structure type ZrNiAl
- The structure type Ho 6 Co 2 Ga
- The structure types AuBe 5 and Cu 3 Au
- The structure types Ce 8 Pd 24 Sb and Sm 12 Ni 6 In
- The structure type Hf 5 CuSn 3
- The structure type La 6 Co 11 Ga 3
- The structure type Yb 3 Rh 4 Sn 13
- The structure type La 4 Ni 3 Pb 4
AlB2 subcell tripling occurs in CaLiSn (Müller and Voltz, 1974) and YbAgPb (Merlo et al., 1996) structures. Thus, superstructure reflections are observed, which indicate the arrangement of transition metal and lead atoms. This change in structure type is driven by the size of the rare earth elements.
CHEMICAL AND PHYSICAL PROPERTIES
- Ternary equiatomic plumbides RTPb
- Ternary plumbides R 2 T 2 Pb
- Ternary plumbides R 6 T 13 Pb
- Ternary plumbides R 4 Ni 3 Pb 4
- The plumbide Ce 8 Pd 24 Pb
- The plumbide Dy 5 CuPb 3
EuAuPb (Arpe, 1998; Pöttgen and Johrendt, 2000) shows a magnetic moment of 6.8 μB/Eu atom in the paramagnetic range and antiferromagnetic ordering at 7 K. The magnetic ordering is manifested in the temperature dependence of the resistances through abrupt changes in the slopes (decrease in scattering of spin disturbances). The magnetic ordering was also clearly detected in the specific heat measurements (Cho et al., 1998).
SUMMARY AND OUTLOOK
Phase equilibria and crystal chemistry in metallic rare earth ternary systems, in: Gschneidner Jr., K.A., Eyring, L., eds. Crystal structures and crystal chemistry of ternary borides, silicides and homologs of rare earth metals, in: Gschneidner Jr., KA, Eyring, L., eds. Crystal Structures and Crystal Chemistry of Ternary Rare Earths, in: Gschneidner Jr., K.A., Eyring, L., eds.
SYNTHESIS TECHNIQUES
Although RB12 is a different class of materials compared to the icosahedra-containing borides in that they are metallic compounds (with the exception of YbB12) and have the cuboctahedron as a structural unit, they are also referred to as "higher borides ". and recently interesting variations in their magnetic behavior are being discovered. It is noted here that the term "higher borides" is not well defined and has sometimes been used to describe any boron-containing compound that is merely boron-rich. In this review, the term "higher borides" is used to refer to the rare earth borides distinguished by having a lot of boron in them, namely (ignoring any minor additions of 3rd elements), borides having RBn with 12.
BONDING IN HIGHER BORIDES
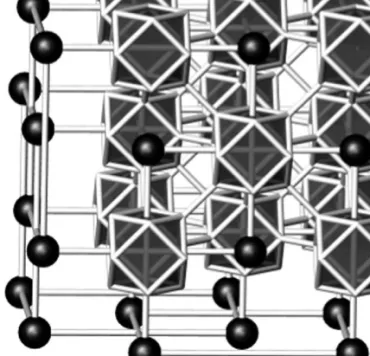
One way to view the structure of the higher rare earth borides is that the boron atoms form electron-deficient clusters arranged in a three-dimensional framework. This electron deficit of the clusters leads to dramatically different physical properties for trivalent and divalent metal borides, as illustrated, for example, in the following section on the dodecaborides. Finally, the framework formed by the boron clusters is relatively rigid and therefore there are limitations on the size of the metal atoms/ions that can occupy the cavities.

DODECABORIDES RB 12
- Structure
- Physical properties .1 Electrical properties
The transition temperature TC = 4.7 K originally reported is different from that of simple YB6 (TC = 6.5-7.1 K, Matthias et al., 1968) which would be a presumed typical impurity. It is noted that there is no isotope effect for elemental Zr (Bucher et al., 1965). For example, RB4 (R = Dy, Er) has been found to embody a Shastry-Sutherland-type frustrated magnetic spin system (Watanuki et al., 2005; Michimura et al., 2006).
NOMENCLATURE/NOTATION OF THE HIGHER BORIDES
- Structure of RB 66
- Physical properties of RB 66
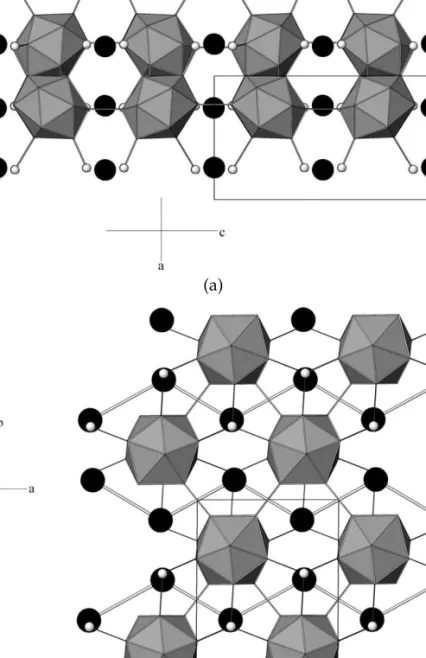
Because of the close spacing and occupancy of the yttrium sites in the peanut, it was initially thought that yttrium atoms could not simultaneously occupy both sites. With this in mind, a schematic view of the structure of YB66 is given in Fig. 5 (Higashi et al. 1997b). Infrared spectroscopy measurements on YB66 reveal a strong absorption band around 130 cm−1, which is thought to be due to local oscillation of yttrium atoms (Werheit et al., 1991).
- Magnetic properties of TbB 50
- Crystal growth realized through addition of Si, and GdB 44 Si 2
- Structure of RB 50 -type compounds
- Substitution of magnetic atoms
- The ytterbium phase
- Electrical resistivity of RB 50 -type compounds
- Application of high fields
- Nature of the antiferromagnetic transition of RB 50 -type compounds
- ESR of GdB 44 Si 2 : indications of one dimensionality
- Mechanism of the magnetic interaction in RB 50 -type compounds
- Magnetic structure of RB 50 -type compounds
- Summary of magnetism of RB 50 -type compounds
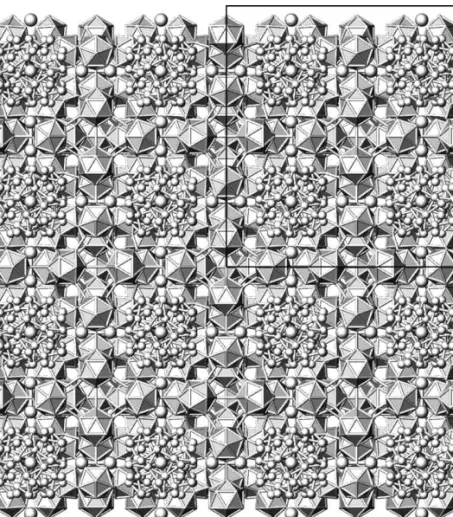
The small circles indicate boron atoms, medium circles are silicon atoms of the B12Si3 polyhedron. Two different views of the structure formed by the B12(B12)8(B12Si3)4 superclusters are given in Figure 11. The intrinsic nature of the transition in the RB50-type compounds was further investigated through a non-magnetic doping effect (Mori, 2004).
RB 25 AND RAlB 14
- Structures of RB 25 and RAlB 14
- Bonding in RB 25 and RAlB 14
- Electrical properties of RB 25 and RAlB 14
- Magnetic properties of RB 25
- Magnetic properties of RAlB 14
- Crystal structures
- Magnetic properties: spin glass behavior
- Dynamical properties: indication of 2 dimensionality
- Comparison of magnetic properties
- Summary of the spin glass behavior
- Structures of RB 18 Si 5 and R 1.8 B 36 C 2 Si 8
- Electrical properties of RB 18 Si 5
- Magnetic properties of RB 18 Si 5 and R 1.8 B 36 C 2 Si 8
- Field dependence
The separation of the rare earth atoms within the regular triangular layer (indicated by the thin bonds) is 5.62 Å in this case. The separation of the rare earth atoms within the regular triangular layer (indicated by the thin bonds) is 5.62 Å. The configuration of the rare earth atoms in the basal planes of the three compounds RB15.5CN, RB22C2N and RB28.5C4 is similar.
Sc HIGHER BORIDES
The magnitude of the magnetic interaction of RB18Si5 compared to RB50-type compounds and RB25 compounds is consistent with the picture of the B12 icosahedra mediating the magnetic interaction. Growing single crystals of any of these compounds in large size and good quality has proven difficult and the physical properties of these scandium higher borides have not yet been investigated in detail. Resistance measurements on a Sc3.67−xB41.4−y−zC0.67+zSi0.33−w crystal containing impurity inclusions showed variable range hopping behavior (Mori et al., unpublished), which is typically observed in boron icosahedra borides, as described in this review.
THERMOELECTRIC PROPERTIES OF HIGHER BORIDES
- Doping of YB 66
- RB 44 Si 2 (RB 50 -type) compounds
It has been found that the Nb doping results in an increase in thermal conductivity by about a factor of 2. The temperature dependence of the thermopowerα for some of the R–B–C(N) compounds is plotted in Figure 43. The origin of the striking n-type behavior observed in the homologous R–B–C(N) compounds has not yet been fully elucidated, but is indicated to relate to the two-dimensional rare earth strata (Mori et al., 2008a).

SUMMARY/CONCLUSION AND OUTLOOK
The seed method showed less increase in the thermal conductivity and appears to be a powerful processing technique. Although the currently obtained absolute values of power factors still need to be improved, these compounds may provide an n-type boride counterpart to the well-known p-type boron carbide which is one of the few thermoelectric materials viable for extremely high temperature use (1500) K), and further research on the R–B–C(N) compounds is merited. Furthermore, n-type electrical properties, which are thought not to exist in boron icosahedra compounds, unless.

CHAPTER 239
1 Types of Magnetic Order in HoNi2B2C 262 4.9.2 Metamagnetic Transitions and Magnetoresistance 263 4.9.3 Re- and Near-Reentry Behavior 266 4.9.4 Interplay of Superconductivity and Magnetism in 293 6.2 Effects of Chemical Pressure and Disorder 295 6.3 Magnetic Impurities in a Nonmagnetic Superconductor 302 6.4 Nonmagnetic Impurities in an Antiferromagnetic Super-. P (hydrostatic) pressure Pu uniaxial pressure q nesting vector ρ electrical resistivity ρ0 residual resistivity ρc vortex core size ρN normal state electrical resistivity-.