2
Characterization of Biodiversity
FA. BISBY Lead Authors:
F.A. Bisby and J. Coddington (Chapter 2.1); J.P Thorpe, J. Smartt (Chapter 2.2);
R. Hengeveld, P.J. Edwards, S.J. Duffield (Chapter 2.3) Contributors:
/. Cracraft, D.L. Hawksworth, D. Lipscomb, N.R. Morin, P. Munyenyembe, G.J. Olsen,
D.LJ. Quiche, MM. V van Regenmortel, Y.R. Rostov (Chapter 2.1); A.L Alkock,
M. Chauvet, K.A. Crandall, D.R. Given, S.J.G. Hall, J.M. Iriondo, T.M. Lewinsohn,
S.M. Lynch, G.M. Mace, A.M. Sole-Cava, E. Stackebrandt, A.R. Templeton, RC. Watts
(Chapter 2.2); M.T. Kalin-Arroyo, J. Bullock, R.G.H. Bunce, E.A. Norse, A. Magurran,
K. Natarajan, S.L Pimm, R.E. Ricklefs (Chapter 2.3)
CONTENTS
Elective Summary 25
2.0 Introduction to the characterization of biodiversity 27 2.0.1 What is biodiversity? 27 2.0.2 What components of biodiversity are to be
characterized? 27 2.0.3 What is meant by characterizing biodiversity? 27
2.1 Biodiversity from a taxonomic and evolutionary
perspective 27 2.1.0 Introduction: patterns of living organisms -
classification and evolution 27 2.1,0.1 Folk classifications and the origin of
scientific taxonomy 29 2 1.1 The basics of taxonomic characterization:
what taxonomists do 31 2.1.1.1 The role of specimens in taxonomy 31 2.1.1.2 Stability of scientific names 33 2.1.2 Characterizing flora, fauna and microbiota:
preparing Floras, handbooks and keys 33 2.1.2.1 The amount of research work involved 34 2.1.2.2 Modem developments: databases and
expert identification systems 35 2.1.3 Characterizing systematic patterns: the species,
their evolution and their classification 36 2.1.3.1 Analysing systematic data to reconstruct
evolutionary history 36 2.1.3.2 From phylogenetic trees to formal
classifications 38 2.1.3.3 Why do classification schemes change? 38 2.1.4 Charac;enzing species 40 2.1.4.1 The morphological species concept 41 2.1.4.2 The biological species concept 41 2.1.4.3 The phylogenetic species concept 43 2.1.4.4 The pluralistic approach 44 2.1.5 The power of taxonomy and taxonomic products 46
2.1.5.1 Taxonomic products: an essential technological infrastruciure for biotechnology, natural resources
management, and regulation 46 2.1.5.2 As a summary of biodiversity and
evoluiionary patterns 47 2.1.5.3 As a basis for prediction 49 2.1.5.4 Other uses of taxonomic techniques 50 ' ° Taxonomic measures of species diversity 51
2.1.6.1 Evaluating taxonomic isolation of
individual species 51 2.1.6.2 Measuring taxonomic diversity of biota
or ecosystems 53 2.1,7 Conclusion 53 References 53
2.2 Genetic diversity as a component of biodiversity 57 2.2.0 Introduction 57 2.2.1 Partitioning of genetic variability below the
species level 61 2.2.1.1 Analysis of karyotypic variation 63
2.2.1.1.1 Karyotypic variation analysis techniques 63 2.2.1.1.2 Genetic diversity studies 63 2.2.1.1.3 Assessment 64 2.2.1.2 Molecular methods for assessing levels
of genetic diversity 65 2.2.1.2.! Allozymes 65 2.2.1.2.2 Restriction fragment length
polymorphism (RFLP) 67 2.2.1.2.3 Multi-locus DNA fingerprinting
of minisatellite loci 68 2.2.1.2.4 Single-locus DNA fingerprinting
of minisatellite loci 68 2.2.1.2.5 Gene cloning and poly me rase
chain reaction (PCR) 68 2.2.126 Nucleotide sequences 69 2.2.1.2.7 Applications of PCR 69 2.2.1.2.8 Conclusions 69 2.2.2 Patterns of differentiation under domestication 70
2.2.2.1 Characterizing biodiversity within
domesticated species 73 2 2 2 2 The genetic basis of cultivarsand breeds 75 2.2.2.3 Species complexes and gene flow 76 2.2.2.4 Future developments 77 2.2.3 Investigating genetic diversity 77 2.2.3.1 Type of biological material available 79 2.2.3.2 Research and development 79 2.2.4 Case studies of the use of genetic techniques
in studies of wiihtn-species and between-
species diversity 79 2.2.4.1 Pctrtula 79 2.2.4.2 Aiutlis 81 References 82
24
\ Characterization of Biodiversity 2.3 Biodiversity from an ecological perspective
2.3.1 Introduction 2.3.2 Diversity within areas
2.3.2.1 Species richness and species diversity 2.3 2.1.1 Comparing diversity across species groups: coherence of patterns
2.3.2.1.2 Comparing areas of different sixes
8S
•SS
'XI
'Mi 2.3.2.1.3 The relative abundance of species 91 2.3.2.2 Taxic diversity 91 2.3.2.3 Functional diversity 92
2.3.2.3.1 Autecological diversity (species in isolation) 92 2 3.2.3.2 Synecological diversity (species
in communities) 93
2 3.3 Diversity between areas
2.3.3.1 The general difficulties in classifying ecological communities
2.3.3.2 Classifications based on species composition
2.3.3.2.1 Phytosociology 2.3.3.2.2 Global classifications of
species distribution 2.3.3.3 Global classifications of ecosystems 2.3.3.4 Characterising and classifying landscapes 2.3.3.5 Diversity in ecological systems
2.3.3.6 The importance of better ecological classifications
2.3,4 Conclusions References
<M
94
96 97 100 102 102 102 103 j 104 \
#-
EXECUTIVE SUMMARY
. jhe recognition and characterization of biodiversity depends critically on the work of three scientific disciplines. Taxonomy provides the reference system and depicts the pattern or tree of diversity for all organisms (Chapter 2.1). Genetics gives a direct knowledge of the gene variations found within and between species (Chapter 2.2). Ecology provides knowledge of the varied ecological systems in which taxonomic and genetic diversity is located, and of which it provides the functional components (Chapter 2.3).
• There appear to be no short cuts to full examination of biodiversity. All three disciplines report in this assessment that, having characterized only part of the world's biological diversity, it will be necessary to undertake similar work to survey the remainder.
While predictions can be made, they are no substitute for full enumeration. It is in the nature of biodiversity that surprises and uniqueness abound: predictive methods, such as the use of indicator species, latitudinal gradients, and mapping of hotspots, are of limited value,
• Taxonomy provides the core reference system and knowledge-base on which all discussion of biodiversity hinges: the framework within which biodiversity is recognized and in which species diversity characterization occurs. The most commonly used units of biological diversity are species, the basic kinds of organisms.
* Taxonomic characterization of the world's organisms is a mammoth but essential strategic task with which only limited progress has been made: just I 75 of the estimated 13 to 14 million species have so far been described, and most of these are still poorly known in biological terms.
There is not even a comprehensive catalogue of these 1.75 million known species.
* Despite its universal usage as a basic unit of taxonomy, it is difficult to agree on an exact definition of what constitutes a species. As a result there is considerable variation in concept and usage which may be reflected in differing classifications and species totals
- Taxonomists have the task of enumerating which species exist and placing them in a taxonomic hierarchy. This taxonomic hierarchy serves both as a classification used for reference purposes and as a summary of the evolutionary tree. It can also be used to predict properties of certain organisms. The hierarchy is characterized by observation of the patterns of resemblances in comparative features such as morphology, anatomy, chemistry (including molecular data), behaviour and life-history.
• Systematic and evolutionary studies provide valuable knowledge about the evolutionary origins and patterns of life, the scientific map of diversity. This is the map that must be used in planning conservation, prospecting, exploitation, regulation, and sustainable use.
• It is considered important that assessments used in the evaluation of resources and conservation options make adequate use of taxic diversity measures which take into account not just numbers of species but their taxonomic positions and the differing contributions that different species make. The map or tree of diversity is occupied by very varied densities of species: in some parts there are thousands of species, in others just one or two. It follows that the very few species in certain parts of the pattern are of exceptionally high scientific value,
* Genetic diversity is the diversity of the sets of genes carried by different organisms: it occurs not only on a small scale between organisms of the same population, but on a progressively larger scale between organisms in different populations of the same species, between closely related species such as those in the same genus, and between more distantly related species, those in different families, orders, kingdoms and domains. Genetic diversity may be characterized by a range of techniques: by observation of inherited genetic traits, by viewing under the microscope the chromosomes that carry the genes, and by reading the genetic information carried on the chromosomes using molecular techniques.
* Genes transmit features from one generation to the next, so determining by inheritance and in interaction with the environment, the pattern of variation realized in features
26 Characterization of Biodiversity seen within and between species. Similarly alterations in
the genes carried forward to future generations mark the path of evolution. Yet scientists observe that in neither case is there a strictly one-to-one relationship between genetic diversity and the realized diversity of organisms characterized by taxonomists.
zones differ taxonomically in the flora and fauna present, even between areas of similar physical environment (e.g.
within the same ecoregion) or similar physiognomy (e.g.
within the same biome). Conversely, the physiognomic differences between bionics within one biogeographic zone are para I led by those within another.
• Genetic analysis, including molecular techniques.
provides a formidable tool for gaining access to precise gene differences both within and be!ween species. Within species genetic details can characterise the traits and the populations on which natural selection and the process of evolution is acting. Between closely related species gene comparisons can reveal details of speciation and colonization.
• It is selection acting on genetic diversity that carries forward both ecological adaptation and microevolution: to limit or reduce the genetic diversity within a species is to limit or reduce its potential or actual role in the ecological and evolutionary development of the biosphere.
• The food plants, animals, fungi and other micro- organisms on which all humankind depend arise from genetic variants of originally wild organisms. The genetic resources in both wild and domesticated organisms thus represent a patrimony of resources for future use. Even the present well-developed food crops and animal resources are constantly at risk because of the rapid adaptation of pests and diseases: skilful and extensive manipulation of genetic resources is needed even to maintain agricultural productivity,
• Organisms are not evenly distributed: they occur in an intricate spatial mosaic, classified on a world scale into biogeographic zones, biomes, ecoregions and oceanic realms, and at a variety of smaller scales within landscapes into ecosystems, communities and assemblages.
• In terrestrial systems the community found at any one point can be characterized by the physical environment (ecoregion), the physiognomic type (biome), and the floristic/faunistic (biogeographic) zone in which it occurs In marine systems communities are characterized in terms of the physical environment and the faunistic (biogeographic) zone.
• The units of classification used on a global scale differ in how they are recognised and consequently in the distinctions between their subdivisions. Biogeographic
• All existing global classifications of ecological systems are to some extent inadequate, either in their methodology or in their spatial coverage, or in both. A robust classification of the world's ecosystems which can be used to map the distribution of ecological resources is urgently needed.
• The biodiversity within an area can be characterized by measures of species richness, species diversity, taxic diversity and functional diversity - each highlighting different perspectives.
(a) Species richness (also called a-diversity) measures the number of species within an area, giving equal weight to each species.
(b) Species diversity measures the species in an area, adjusting for both sampling effects and species abundance.
(c) Taxic diversity measures the taxonomic dispersion of species, thus emphasizing evolutionarily isolated species that contribute greatly to the assemblage of features or options.
(d) Functional diversity assesses the richness of functional features and interrelations in an area, identifying food webs along with keystone species and guilds, characterised by a variety of measures, strategies and spectra.
• A serious limitation on all measures of species diversity in an ecosystem is our inability to survey all organisms at any site: only a few taxonomic groups are sufficiently known for complete field surveys to be made.
• At the smaller scale, landscapes are composed of areas characterised as ecosystems or communities. The diversity between areas is measured as (^-diversity, the change in species present.
• Systems diversity is assessed as the richness of ecological systems in a region or landscape.
Characterization of Biodiversity 27 20 introduction to the characterization of biodiversity
2.0.1 What is biodiversity?
As explained in Section I, biodiversity means the variability among living organisms from all sources and the ecological systems of which they arc a part; this includes diversity within species, between species and of ecosystems. Were life to occur on other planets, or living organisms to be rescued from fossils preserved millions of years ago, the concept could include these as well. It can be partitioned, so that we can talk of the biodiversity of a country, of an area, or of an ecosystem, of a group of organisms, or within a single species.
Biodiversity can be set in a time frame so that species extinctions, the disappearance of ecological associations, or the loss of genetic variants in an extant species can all be classed as losses of biodiversity. New elements of life - by mutation, by natural or artificial selection, by speciation or artificial breeding, by biotechnology, or by ecological manipulation - can similarly be viewed as additions to biodiversity.
2.0.2 What is meant by characterizing biodiversity?
The scientific characterization of biodiversity involves what may seem like two different processes, the observation and characterization of the main units of variation {e.g. genes, species and ecosystems), and the quantification of variation within and between them (genetic distance, taxonomic relatedness, etc.). In reality they are part of the same process: the analysis of pattern defines the units as well as characterizing their variation.
In each of the three chapters that follow an assessment is made both of the reference framework and units used, and of the methods for quantifying variation. Chapter 2.1 deals with the central issue of characterizing species or taxonomic diversity. Chapter 2.2 assesses genetic diversity that occurs both within and between species. Chapter 2.3 introduces the diversity of ecological systems in which this species and genetic diversity occurs, a theme further developed in Sections 5 and 6.
A number of techniques described here are of wide application both in characterizing diversity and in topics addressed in later sections. The molecular techniques described as part of genetic diversity (Chapter 2.2) are widely used in taxonomic analysis (2.1) and in biotechnology (Section 10). The taxic diversity measures described in 2.1 are increasingly of interest in the comparison of ecological systems (2.3). No attempt is made to appraise cultural diversity: with its human and cultural dimensions, this is left until Sections 11 and 12.
Lastly, we should comment that this assessment of characterization units and techniques leaves rather a dissected view of biodiversity at different levels of description. It is for other sections to assess our knowledge of how the system works as a whole.
2.1 Biodiversity from a taxonomic and evolutionary perspective
This chapter contains an introduction to the taxonomic and evolutionary characterization biodiversity (2.1.0-2.1.4).
This is followed by an overview of the power and utility of taxonomic products in general biodiversity usage (2.1.5), and in the particular context of species diversity assessment (2.1.6).
2.1.0 Introduction: patterns of living organisms - classification and evolution
The study of the different kinds of living organisms, the variations among and between them, how they are distinguished one from another, and their patterns of relationship, is known as taxonomy or biosystematics (see Box 2.1-1 for strict definitions). Taxonomy is thus fundamental in providing the units and the pattern to humankind's notion of species diversity. Indeed, the first estimates of global biodiversity were those made by taxonomists.
At one end of the range of taxonomic studies are rather practical operations such as naming and cataloguing what kinds of organisms exist (including the preparation of checklists, plant Floras, animal handbooks, computerized identification tools, etc.), the information science aspect of taxonomy. At the other end are sophisticated studies of the branching tree and geographic patterns of evolution by descent (known as phytogeny) and taxonomic measures of biodiversity. Simple introductory texts are provided by Ross (1974), Jeffrey (1982), Heywood (1976) and Liorente-Bousquets (1990).
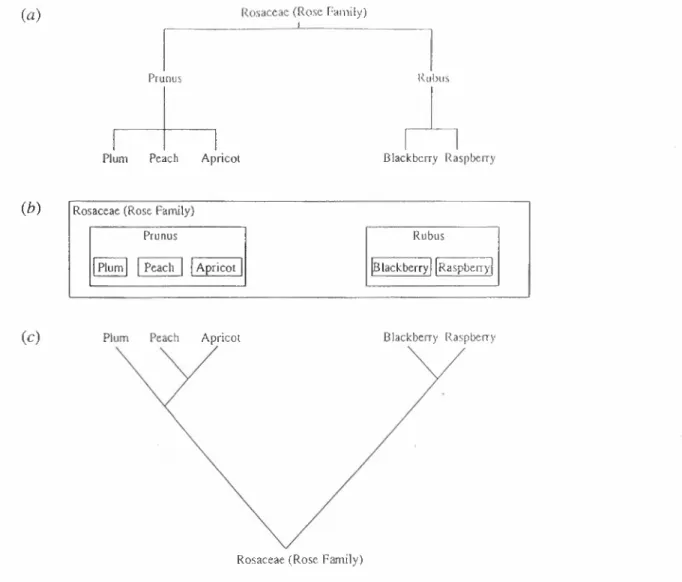
Despite the sometimes bewildering complexity of forms observed, biosystematists have succeeded in most major groups in recognizing the patterns of variation and occurrence that are observed. The patterns can be depicted graphically as nested hierarchies, boxes within boxes, or branching trees (Figure 2.1-1) which, as we shall see later, can be thought of either as a nested classification or as a tree of descent. This practice originated simply as a human method of organizing knowledge, as in Aristotle's principle of Logical Division (Turrill 1942), where organisms are divided into contrasted classes: A, not A; useful, not useful;
woody, not woody. Similarly, in Diderot's Encyclopedic (Diderot 1751-65) all "knowledge, including both biology and many other topics, is connected on a hierarchical tree printed inside the book's covers. But since the acceptance of Darwin's theory of evolution by descent with modification (Darwin 1859), the success of using a hierarchy is attributed to organisms having evolved by descent with modification through time, a process that produces a branching tree. The pattern of life actually is intrinsically tree-like and hierarchical in variation pattern.
At the lowest level of this hierarchy are individual organisms which live and die fe.g. a particular dog, a
28 Characterization of Biodiversity Box 2.1-1: Definitions of taxonomy and biosystematics.
A distinction between taxonomy and biosystematics
Taxonomy in the strict sense refers lo all information science aspects of handling the different sets of organisms. The word is sometimes used in contexts outside biology so, strictly, one should speak of biological taxonomy. Mayr (1969) defines it thus:
Taxonomy is the theory and practice of classifying organisms.
It can be thought of as having four components (Bisby 1984: Abbott el ai. 1985; R ad ford 1986: Hawksworlh and Bisby 1988):
(i) the classification (it) the nomenclature
(iii) circumscriptions or descriptions (iv) identification aids
Biosystematics is a broader topic, which includes taxonomy, but also includes the full breadth and richness of associated biological disciplines, including elements of evolution, phytogeny, population genetics and biogeography (Hawksworth and Bisby 1988; Quicke 1993). In the late 1930s the term systematics was used in Britain to emphasize the move away from classical taxonomy, as in the phrase 'The New Systematics', and the establishment of 'The Systematics Association'. Simpson (1961) and Mayr (1969) define it thus:
Systematics is the scientific study of the kinds and diversity of organisms and of any and all relationships among them.
Again the word is used in non-biological contexts: biosystematics makes clear the biological context.
particular tree, a particular bacterium). Individuals occur usually as members of more-or-less continuously existing populations, which can be variously characterized, depending on their breeding systems, either as being related by the process of mating amongst their immediate ancestors (as among humans, among beetles and among palm trees), or as having a common descent from a single recent ancestor (as in the HIV virus). These populations themselves fall into patterns, some being clearly similar and of the same species, others being different to varying degrees and thus of different species e.g. species of rats:
Norway rat (Rattus norvegicus), roof rat (Rattus rattus);
species of Prunus: plum, cherry, peach, apricot; species of large cats: lion, jaguar, leopard, tiger. Even though the exact definition of a species is a matter for debate, the species is used universally as the basic category of the classification.
As the common names sometimes imply, some species are clearly members of recognizable larger aggregations (or the descendants of a common ancestral form) known as genera (singular, genus): e.g. date palm, canary date palm, dwarf date palm - species in the date palm genus Phoenix.
This process of aggregating similar or related forms can be continued to form larger aggregations. Genera are
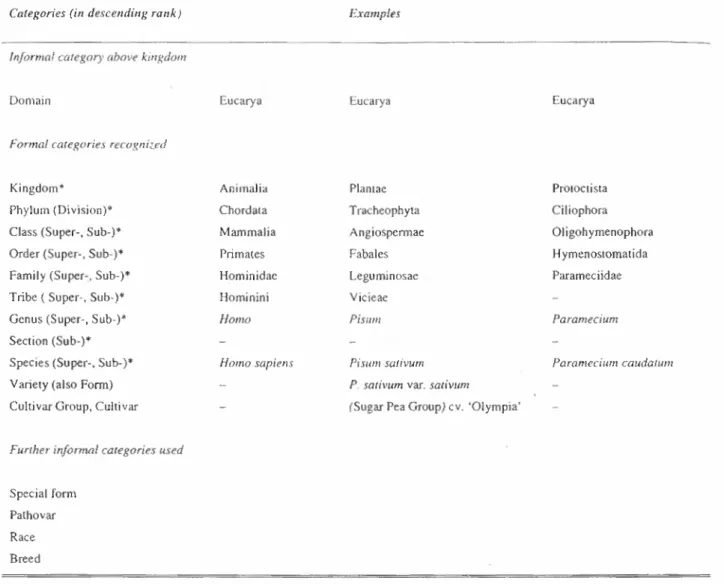
aggregated into families, families into orders, and so on up the hierarchy as shown in Table 2.1-1. The higher categories of the hierarchy, such as families and orders, are vitally important for communication; they permit discussion, generalization and information retrieval about particular sets of organisms. The overall result is a hierarchical classification going the whole way from species (or even subspecies, or human-made varieties called cuitivars or breeds, within species) up to the major kingdoms such as plants, animals and fungi.
To give some idea of our progress in understanding life on Earth a comprehensive, detailed classification of living organisms on earth compiled into a single work (Parker 1982) recognizes 4 kingdoms, 64 phyla, 146 classes, 869 orders and about 7000 families. However, recent advances in the study of cell organdies and DNA sequences have led to rapid changes in the topmost categories: Whittaker (1969) and Margulis and Schwartz (1982) propose five kingdoms and Woese (1994) places three domains above the kingdoms (as depicted in Figure 2.1-5). The total of 1.75 million species thought to have been described to the present day represents a small fraction of the 13 to 14 million species estimated to exist in total. There is at present no comprehensive catalogue even of these 1.75
Characterization of Biodiversity 29
(a)
Rosaccac (Rose Family)Prunus Rubu
Plum Peach Apricot Blackberry Raspberry
(b)
Rosaccac (Rose Family}Prunus Rubus
Plum Peach Apricot Blackberry Raspberry
(c)
Plum Peach Apricot Blackberry RaspberryRosaceae (Rose Family)
Figure 2.1-1: Three graphical representations of the laxonomic hierarchy of some members of the Rosaceae: (a) nested hierarchy; (b) box-within-box, and (c) a branching tree.
million species (see Chapter 3.1 for further discussion and Tables 3.1.2-1 and 3.1.2-2 for species counts)
Two properties of the taxonomic hierarchy are pivotal to its value in characterizing species diversity. First, the hierarchy provides a reference system that permits the summary, storage and retrieval of information about all organisms (Simpson 1961: Blackwelder 1967; Mayr 1969; Farris 1979; Bisby 1984), Secondly, the hierarchy atletnpts to be natural, by reflecting the presumed pathway of evolution and the pattern of resemblances among the organisms (Darwin 1859; Haeckcl 1866; Cam 1954;
Simpson 1961; Mayr 1963, Davis and Heywood 1963;
Hennig 1966).
2.1.0.! Folk classifications and the origin of scientific taxonomy
Throughout history humans have classified organisms. Wc use our innate classificatory abilities every day: we eat rice
in quantity but not peppercorns. In supermarkets many foods are arranged by species. All human societies have folk taxonomies - traditional classifications of organisms often associated with cultural, survival and culinary practices (Berlin 1992). The limit of Fast Hudson Bay recognize two major kinds of animals, umajitq which are game animals, and umajuquts which are domestic ones (Atran 1990). The Tzeltal Indians of Chiapas, Mexico, use four life-forms - trees, herbs, grasses and vines (Table 2.1-2;
Berlin el al. 1974), a system winch contains logical structures (generic tax a) analogous to the genus and species of scientific taxonomy.
ft is from these folk classifications that scientific taxonomy emerged, initially in Europe, bringing together the more formalized cataloguing of medicinal herbs, world- wide collecting expeditions, particularly by the seafaring nations, and the dawn of scientific discovery in biology.
Mediaeval herbals contained descriptions of herbal extracts
JO Characterization oj Biodiversity
Table 2.1-1: Major taxonomic categories.
Categories (in descending rank} Examples
Informal category above kingdom
Domain Lucarya Eucarya Eucarya
forma! categories recognized
Kingdom*
Phylum (Division)*
Class (Super-, Sub-)*
Order (Super-, Sub-)*
Family (Super-, Sub-)*
Tribe ( Super-, Sub-)*
Genus (Super-, Sub-)*
Section (Sub-)*
Species (Super-, Sub-)*
Variety (also Form) Cultivar Group, Cultivar
Animal ia Planiae Chord ata Trac heo p h y ta Mammalia Angiospermae Primates Fabales Hominidae Legu mi n osae Hominini Vicieae Homo Pisttm
Homo sapiens Pismn sativum P sativum var. sativum
(Sugar Pea Groups cv. 'Olympia'
Protect ista Ciliophora Oligohymenophora Hymenostomatida Parameciidae
Parainecium
Paramecium caudaium
Further informal categories used
Special form Pathovar Race Breed
* These categories are often subdivided still further by the addition of the prefixes sub- or super- in addition to the stem ranks themselves, e.g. a superfamily may contain several families, and a family several subfamilies.
Table 2.1-2; Folk taxonomy of the Tzeltal Indians of Chiapas, Mexico (from Berlin etal. 1974).
Category
fe^' trees' wamat 'herbs'
?ak 'grasses'
?ak 'vines' Unaffiliaied taxa Ambiguous taxa
Total
Number of generic taxa
178 1 19 35
:M
97 IB
471
and crude illustrations of the plants from which they came, often with a number of animal extracts and even inanimate items alongside. The thoughtless copying of such works and the attempts to shoe-horn into them new discoveries from all over the world soon led to chaos. It was against this background that the cataloguing energies of the eighteenth century Swedish naturalist Carl Linnaeus, and the first attempts at natural classification by the French naturalists, were so badly needed.
For a long time species were named using a descriptive Latin phrase, but no formal system was widespread. It was Linnaeus who adopted the binomial system in later editions of his master catalogues Systema Naturae (Linnaeus 1735) and Species Plamarum (Linnaeus 1753), and a system of nomenclature broadly similar to his has continued to the present day. It is now formally embodied in the various
Characterization of Biodiversity
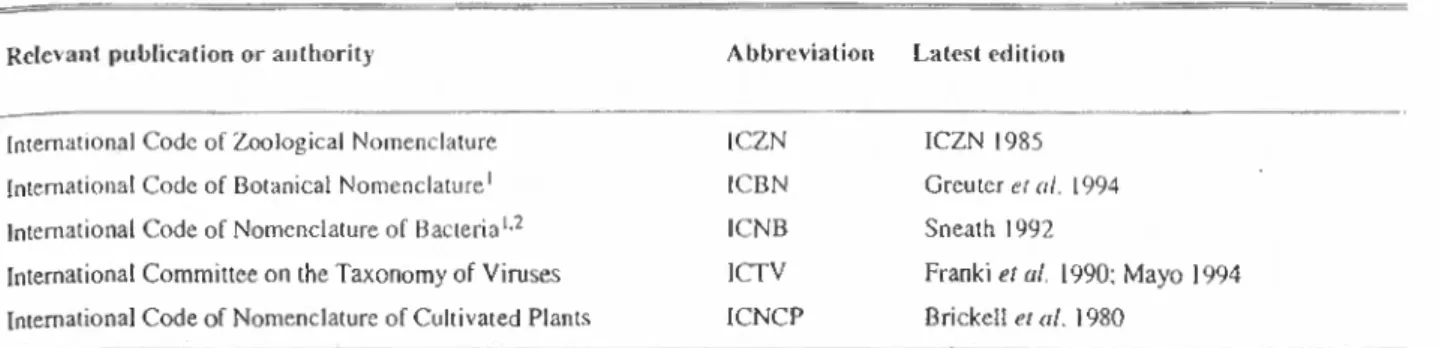
Table 2.1-3: The Codes and Committees dial define rules and recommendations for the scientific names oftaxa.
31
Relevant publication or authority Abbreviation Latest edition
iCZN ICZN 1985
iCBN Greuter et at. 1994 1CNB Sneath 1992
1CTV Frankiefo/ 1990; Mayo 1994 ICNCP Brickcll et ai. 1980
International Code of Zoological Nomenclature International Code of Botanical Nomenclature1
international Code of Nomenclature of Bacteria1^ International Committee on the Taxonomy of Viruses International Code of Nomenclature of Cultivated Plants
1. Blue-green algae (Cyanobacteria) have variously been treated as plants or bacteria, giving rise to confusing applications of both ICBN and ICNB.
2 Fungi are covered by the ICBN/as are Cyanobacteria and certain Protozoa.
international rules for nomenclature and almost universally endorsed as the scientific names of organisms. Starting in the same period, much of the classification that we use today was put in place by de Jussieu, Adanson, Cuvier, Lamarck and Geoffroy Saint-Hilaire. It was they who recognized the major natural groupings of animals and plants, albeit without Darwin's insights into evolution or today's understanding of phylogenetic taxonomy. The classification and nomenclature system has developed continuously from that time and now enables workers in all sorts of professions from all over the world to communicate reasonably effectively about the same organisms, be they plants, animals, fungi or other microorganisms.
2.1.1 The basics of taxonomic characterization: what taxonomists do
There are common elements to nearly all taxonomic studies despite the different practices relevant to different groups of organisms (Blackwelder 1967; Davis and Heywood 1963). Most studies start from the examination of live or preserved specimens, either because newly discovered specimens do not fit the known patterns, or because specimens are being re-examined to solve a problem in the existing taxonomy. Some specimens are found to belong to already-known species. They are identified and the data associated with the specimen are added to the documentation for the species, possibly adding new localities, or variations in the description Others prove to be of a previously unnamed organism. After careful research in the literature, and thorough examination of the new taxon, a new species, subspecies or variety is described and named using the international codes of nomenclature (see Table 2.1-3).
Ideally most taxonomic studies would be revisions of an entire group of organisms over its complete geographical range - a whole genus, family or order - but this is difficult to achieve both because of the labour involved and because
of the logistics needed to see specimens or cultures and study the organisms over several continents. Depending on the size of the group and its distribution, it may take anything from three to ten years of full-time work, in extreme cases even a lifetime, for a taxonomist to complete.
The advantage is that all species can be examined in a comparable way, and that if all have been examined, decisions and descriptions of genera and families will not be confounded by intermediate or more extreme species missed out of the study. Such studies involve examining all available specimens, often by loans from the major collections supplemented by local and specialist collections, followed by the publication of a clear summary of the taxa.
It is also important to ascertain the correct name for each taxon plus synonyms where they occur.
2.1.1.1 The role of specimens in taxonomy
Collections of biological specimens serve several distinct fundamental functions in the characterization of biodiversity. One of these, discussed here, is as the raw material for taxonomy: all taxonomic research is based on the comparison of large numbers of specimens. Equally important for biodiversity survey and inventory is the use of these same collections of specimens as the raw data for biological recording, discussed in Section 7: the time, the place, and the species for each biodiversity data point come from one of these specimens. We thus think of the collections of living and preserved specimens as fundamental resources for biodiversity assessment world- wide, the subject of Chapter 3.2. A third, specialist, usage is for so-called type specimens used to fix the application of names to organisms, discussed in 2.1.1,2
The specimens needed by taxonomists cover a very wide range: preserved specimens in museums and herbaria, living specimens in zoos, aquaria, botanic gardens, arboreta, germplasm banks and culture collections; and associated data such as descriptions, illustrations, chemical
32
(a)
Characterization of Biodiversity ':
(C)
^—+.
•*—4—ilMft #' •#
-f-*Hlf-
-4-—f' 4# 4"'r^"4|
id)
PIHPP.NA PBUTRNAPVICSVOM PFORRHA
PIMPKWA PUUTHWA PVESVO'I prORrll-IA
CCl'CACCOOG,roT-CCACCTG--C'|iCTC,ft:c-C-l,-CCA,l,CC'I1C<.,:cCCAO.\
OCTCACGGCGTCT-eeACCTC--GeTTCTCC-AC-CCATCCTCCCCCAGA TTTC K IT AA A'l' ATT ACTTC C AT!' A' I" IT FT ATT KI 'A TC ATC ATC G A A A AC A CCTCACCGOGTCl'-GCACCTC- -CTCTCTAC-CT-CCATCCTCCCCCACA
ccocci,C"K:c--CA'ri,cAc:,i"reT»:«:(:cc;cc(:cA,i,ccTCC'i>:A*!'-ri,ACTC cccccTC'reiG--cc,ri'AATrcG,i'ctx:cccecw:ATCcccc"i,i:'A,rriiAC'i,c Tl' AT A' l" I -] TGC TC A1 - PC ATI "IV! C r AC I 'A i • A AC A] -1 TrCCT C AT i'T AC TC CiCATCCCTCC- - C AT PC AKTlt"! CGCCT AIXJOl ATC C I CC;T(. A" T r ACTt!
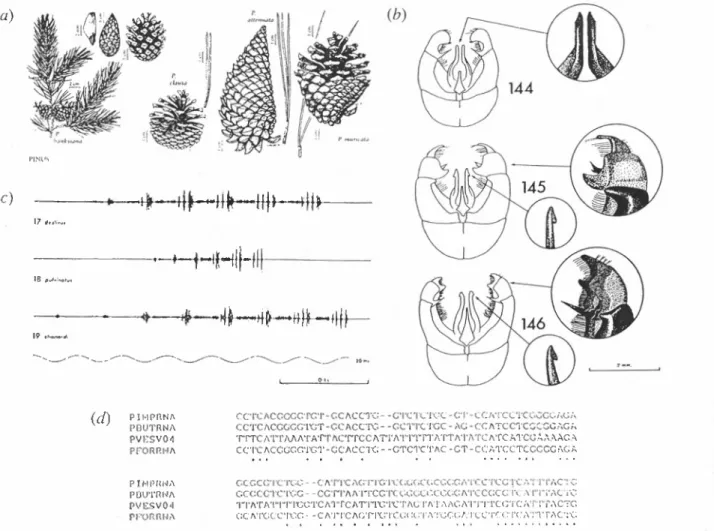
Figure 2.1-2: Comparative data in systematics: (a) gross morphological features in pine trees (Pinus, Morin el al. 1993), (b) microscopic features of gcnitalia in bumble bees {Bombus, Alford 1975), (c) oscillograms of grasshopper calling songs (Enckortkippus, Raggeand Reynolds 1984), and ((/) 18S ribosomal DNA sequences (from the V4 hypervariablc region) in flagellates (Paraphyso/nonas imperforata, P. butcheri, P. vestita and P.foraminifera, Accession Nos. Z29680, 229679, Z28335 & 233646 in the EMBL Sequence Data Library, communicated by J Rice, 1995).
records, sound recordings and genome sequences stored in libraries, film and tape archives and computer databases.
There is a need to marshal large numbers of specimens from the full geographical range side by side for comparison, and to document and preserve evidence of diversity with specimens providing fixed data points.
Taxonomists need to see the widest possible range of specimens for the group of organisms under study. A full geographical and ecological range, plus specimens of differing life stages and temporal variations are needed:
juveniles and adults, vegetative and reproductive, male and female, winter and summer plumage, larvae, pupae and adults, seeds, eggs or spores as appropriate to the organism.
The specimens used for accessing these vary from entire populations {e.g. a bacterial culture), to individual plants or animals (eg. a pressed plant or a pinned insect), to fragments such as fruits, skulls, skins or blood samples.
Associated data sets such as DNA sequences, oscillograms of animal calls and behavioural recordings may be relevant too. Some different data types are illustrated in Figure 2.1-2.
Ideally the data used for studying each group of organisms will span an immense range of characteristics drawn from different organs, different life stages and different aspects of the biology (sec Figure 2.1-2). It is the morphology (physical shape and structure of the organism) and the anatomy (shape and structure of internal organs) that are most easily available and consequently most widely used. Even microscopic details, e.g. of insect genitalia or of fungal spore sculpturing, are often well preserved. Modern techniques such as electron microscopy, phytochemical analyses and DNA sequencing can often be applied to specimens of all ages,
Taxonomic research increasingly involves substantial work in the field to study the living organism in situ, or to establish living collections in a laboratory setting. This is an opportunity to collect data that cannot be obtained from preserved specimens, such as physiological measurements.
Behaviours such as feeding or food plant preferences, locomotory patterns, mierohabitat preferences, timing of sexual or other biological activity (phenology, diurnality
Characterization of Biodiversity i.<
versus nocturnality, migration, circadian rhythms in depth for oceanic plankton), can all contribute to a systematic study Many species build burrows, nests, brood chambers.
retreats, webs, moulting chambers, egg-sacs, and other such constructs. Where these behaviours reflect heritable variation they provide valuable sources of systematic data revealing patterns of variation comparable to those in morphology and anatomy. Samples destined for gene sequencing, particular forms of anatomical comparison, or chemical analysis may require special techniques of preservation. Videotapes of behaviour or audiotapes of calls are obtainable only through fieldwork and must be stored and preserved in special repositories.
Each specimen collected in the field and deposited in one of the public collections is of potential value far beyond the particular study or programme for which it was collected.
There is a consequent responsibility on the collector to establish without doubt the minimum parameters: location (increasingly giving precise latitude and longitude using a global positioning device), altitude or depth, date of collection and an identifying unique collector's name and number. Other valuable data are items that cannot be derived from the specimen at a later date - such as substrate, odour, sounds, colours (which often fade), behaviours, and position on a host. Maximum benefit will be obtained if, possibly after immediate usages, every specimen is deposited in a public collection where it can be used many times to contribute to biodiversity knowledge:
the resources thus generated are reviewed in Chapter 3.2.
For the system of specimen usage to work well amongst taxonomists it is important that at least one duplicate of each specimen, or the single specimen itself, be deposited at a public collection in the country of origin (this is usually a condition of collecting permits), and that such collections should make the specimens available for loan to taxonomists.
2.1.12 Stability of scientific names
The object of scientific nomenclature is to provide a stable unique name for each organism (.Jeffrey 1989}. The usage and giving of names is governed by the various international codes of nomenclature winch, for historical and biological reasons, are slightly different for certain major groups of organisms (Table 2.1-3). All of the codes provide a mechanism for publishing a new name for a newly recognized taxon. for fixing a name to a particular organism by citing a type, and for arbitrating between synonyms where a taxon has accidemly been named more than once, or where two tax a have been united into one.
he type of a species name is a particular cited specimen in a particular collection, the type specimen. The continued preservation of type specimens in public collections is important so that subsequent checks can be made that the
ri£nt name is being applied to the right organism.
In many cases the giving of names has proved to be a troublesome business (QuickC 1993). On the one hand it is essential that taxonomists continue [o map the pattern of variation and descent: this leads to changes in the classification and consequent changes of names, an inevitable price to pay for progress. We do need these changes if modern data and new discoveries are lo be incorporated into our view of the taxonomy. More troubling, however, are cases of seemingly unnecessary name changes arising from different interpretations of the rules, or the continual discovery of older names that take priority under some of the codes Recent discussions have started a move to climinale such nomenclatura! changes, either by permitting certain names to be conserved, or by listing names In current usage and protecting them from the priority of older names (Mawkswonh 1991, 1992)
Some problems arise from the existence of different codes for different groups of organisms. Certain organisms, such as the blue-green algae, have even been treated variably under one code or another, leading to ambiguity or duplication (Table 2.1-3). There are also cases of organisms under different codes being given the same name: the names must be unique but only within the domain of one code. Steps are being taken to harmonize the existing codes and a working body of TUBS is now discussing the difficult task of preparing a unified code for all organisms (Hawksworth 1994; Hawksworth et at. 1994),
Common or vernacular names, although often used very precisely in a given community, are usually neither unique nor universal. The problem is a tendency to re-use common names for wholly or slightly different organisms as human communities, colonial powers and languages have moved from one place to another. The names vaeiam and retama.
for instance, cover a wide range of plant species in Arabic-, Spanish- and Portuguese-speaking countries.
2,1.2 Characterizing flora, fauna and microhiota:
preparing Floras, handbooks and keys
One of the main tasks of taxonomy is to characterize the species of plants, animals and microorganisms so that they can be recognized, used and studied by others. With the exception of the orally communicated folk taxonomies IA
indigenous peoples, biologists all over the world have.
since the eighteenth century, drawn their knowledge on species characterization from the primary catalogues created by the lie Id work and research of an international community of taxonomists. Ke> elements in these primarj works are (I) the classification twhat species and higher laxa exist). (2) the nomenclature (unique scientific names for the species and higher taxaj. (3) descriptions of the organisms in these species and higher taxa. and t4;
identification aids (with which to identify to winch species and higher taxon a freshly encountered specimen belongs I.
Linnaeus called his primary catalogue a Systema Naturae
34 Characterization of Biodiversity (Linnaeus 1753) and recent electronic publications use
phrases such as Species Diversity Information System (e.g.
the 1LDIS LegumeLine database, Zarucchi et al. 1994;
Bisby et at. 1994) and Expert Identification Systems {e.g.
the ET1 CD-ROM Linnaeus Protist, Lobsters of the World, Estep et al. 1992: Estep and Rey 1993: Holthius 1994): but the majority are published books called Floras. Faunas, Monographs, Catalogues, Checklists, Handbooks or Keys.
Vascular plant primary catalogues fall into two classes:
Floras and monographs. Floras document all of the higher plants in a given land area, such as local Floras, national Floras and regional Floras. National Floras exist for quite a large set of nations (see Frodin (1984) for coverage) and regional Floras have been completed for the former USSR (Komarov et al. 1934-60), for Europe (Tulm et at.
1964-80) and for West Tropical Africa (Hutchinson and Dalziel 1927-36). Projects are in progress for some other regions (e.g. Flora of North America. Morin 1993 et seq.;
Flora Matesiana, van Steenis 1948 et seq.) but for many species-rich tropical areas there is still no effective inventory. Botanical monographs document all plants in a given higher taxon world-wide or in a region, as in generic and family monographs
In practice the study of a major taxon world-wide is often not practicable, so there are few worldwide monographs, mostly of genera, and rather more regional monographs of genera or families. Again, there are no recent monographs of the large or tropical plant families.
For animals, the pattern is much less tidy, and for good reason1 The equivalent to the plant scene would be Faunas (all animals of an area) and monographs (all animals in a group, world-wide). But there are so many more animal species, and they belong to widely different groups, each of which may have its own discipline of specialists, such as entomologists, herpetologtsts, ornithologists, lepidopterists, etc. Most descriptive works are restricted to a single higher taxon and are variously local, national or occasionally regional in scope. The result is an even more patchy coverage than is found in plants with not only some overlaps, but very, very large gaps: many major groups are uncatalogued for large parts of the world. Even the best- covered countries (in Western Europe and North America) have far from complete coverage of all animal groups Standing way above the other problems is the difficulty in cataloguing insects (over 950 000 world-wide Wilson 1992), of which the beetles, Coleoptera, dominate with 290 000 species. Where Fauna projects have been undertaken, as in the Faune de France (FFSSN 1921-66), the work is always segmented into different volumes researched by different authors. There are rather few guides to the coverage of the world's animals: notable are Sims and Hollis (1980). Animal Identification in three volumes covering marine and brackish water animals (Vol. I), land and freshwater animals excluding insects
(Vol. 2) and insects (Vol. 3), and Key Works for Northwestern Europe (Sims et al. 1988).
Lastly - what is the level of treatment of the other major groups, such as marine and lower plants, marine animals, fungi, bacteria and the viruses? There are some groups that are partially covered: the bryophytes, mosses and liverworts (rather few species and reasonably accessible to field botanists), fish (of economic importance), some bacteria (of medical importance) and some fungal groups (of economic importance). For most of the rest, coverage is sparse indeed: few coherent catalogues exist even for the many species known to taxonomists, let alone the vast numbers of species yet to be discovered.
2.1.2.1 The amount of research work involved
The type and amount of research needed to create one of these primary works varies enormously, particularly with how many species are to be covered, whether the group of organisms is well or poorly known, and how well explored is the region to be covered. For poorly-known groups and little-explored areas, years of field exploration may be needed both to accumulate sufficient specimens of each species encountered and to increase the chances that all species in the area have been encountered. Conversely, for well-known groups and much- explored areas there may already be a plethora of material lodged in museums or herbaria: die problems relate more to seeing all this material (borrowing it or visiting it), and to sorting out conflicts in existing taxonomic treatments of the organisms. Depending on how full a treatment is prepared, and particularly on whether all four elements are represented (classification, nomenclature, description and keys), the creator of the work will need to pass the following milestones:
1. Form a concept of the exact set of species being treated, often involving decisions on:
• what are the species: how are they delimited, how are problems of apparent overlap, intermediacy, hybridization and discontinuity dealt with;
• how are these species classified, either within the existing published classification, by extending the classification, by adjudicating between alternative views, or by creating a new classification
2. Form an opinion on the correct (or new) name for each species and each higher taxon, and on the names and taxa from other treatments to be placed in synonymy.
3. Create a description of each species by studying the range of variation within that species as evidenced by field observations or by examining preserved specimens.
The range of variability in one area may be greater or
Characterization of Biodiversity
Fieure 2.1-3: {a) Annual rales of production of" trie major regional Floras (Polhill 1990).
J5
Flora Started First Species Total % Species/ Actual or projected
issue published year completion
Europaca 195% 1964 11 557 - 100 770 1978
SSR 1931 1933 17 520 - 100 515 1964
Australia 197V 1981 2 631 18000 15 329 2043
West Tropical Africa 1951 1954 7 349 - 100 387 1972
Neotropica 196% 1968 4 624 90 000 5 220 2397
Southern Africa 1966 2 834 19 500 15 17.1 2124
Zambesiaca 1956 1960 3215 9 300 35 110 2044
Tropical East Africa 1949 1952 6 425 10 500 61 173 2013
Malesiana 1947 1954 4 837 25 000 19 1 IS 2135
(b) Total number of species treatments published in major regional Floras, in five-year intervals (Polhill 1990).
iKXn
o
' ••->
Sftl
-:>::
£ B
200
I970-75
less than that recorded in other works for other areas.
Additional descriptive features such as illustrations, distribution maps, ecological features, etc. may be added as well.
4. Create an identification key that leads unambiguously to an identification for freshly encountered specimens.
Where possible easily visible, clearly demarcated characters should be used.
To give some idea of the amount of work involved, we cue the successful completion of Flora Europaea (Tutin et at. I 964—a0). [is five volumes, containing a medium (synoptic) rather than full treatment of 11 557 plant species from the well-known, well-collected flora of Europe took 25 years work for a network of full- and part-time specialists to complete. But progress is much slower in the tropical regional Floras where more original research and ficldwork is needed, as illustrated in Polhill's (1990) comparison of nine regional Floras summarized in Figure 2-1-3 a and 6.
Floras. Faunas, monographs, many handbooks, and guides all tend to contain all four elements - classification, nomenclature, descriptions and keys. However, there can be substantial variations in how complete the descriptions are, whether voucher specimens are cited, whether illustrations and maps arc included and in the extent of additional ecological, behavioural or economic ml on nation given ('heck lists normally contain I he classification and nomenclature of species, but accompanied by just a geographical distribution - no descriptions or identification aids, They are produced either as quicker projects, or to cover a wider geographical or taxonomic range than could otherwise be contemplated for full treatment. Keys are sometimes published atone, as a preliminary to fuller treatment, as companions to existing works, or to resolve urgent needs lor identification in economic or medical contexts.
2.1.2.2 Modern developments: databases and expert identification systems
This is written at a time of unprecedented change in the technology and dissemination of primary and other taxonomic works. Information technology is rapidly
36 Characterization of Biodiversity bringing in electronic communication amongst dispersed
taxonomic contributors working as teams, the creation of major taxonomic works as databases, and the electronic dissemination of information to users by communications networks such as Internet or hy CD-ROM disks. Some of the electronic products are simply electronic versions or compilations from existing primary works, but increasingly major primary projects are being compiled in this way: for instance the ICLARM/FAO bishBase international project on fish (Lourdes et at. 1994: Froese and Pauly 1994) incorporates the primary database on fish genera and species (rischmeyer 1990. 1992). and the ILDIS species diversity system on legume plants is based on a fresh synthesis of the species taxonomy of Lcguminosae by a world-wide network of experts (Zarucchi et al. 1994; Bisby et at. 1994).
A particularly important development is the bringing together of two technologies, the use of descriptive data tables in computer identification routines (Pankhurst 1975, 1978, 1991; Dal I wit? 1974. 1980). and the facilities in modern computing environments to use windows containing diagrams, illustrations, photographs and maps The resulting expert identification systems such as those produced by the Dallwitz school using the DELTA format (Beetle Larvae of the World, Lawrence et al. 1994;
Families of Flowering Plants, Watson and Dallwitz 1994) and by ETI, the Expert Centre for Taxonomic Identification (Linnaeus Protist. Estep and Ray 1993; Lobsters of (he World. Hohhius 1994) are surely the sign of things to come.
Electronic means are also opening up the possibility of creating master catalogues both of larger and larger groups, and eventually of all known organisms. The IOPI World Plant Checklist (Burnett 1993; Bisby et al. 1993) and the BIOTA Terrestrial Arthropods projects (Hodges and Thompson, in press), for instance, propose to list all plants and all terrestrial arthropods. Very many groups of organisms now have rapidly progressing master catalogue systems (Bisby 1993. 1994) and the Species 2000 program of IUBS. CODATA and 1UMS is proposing that many of these create a federated system which could lead to an index of all of the world's known organisms
2.1.3 Characterizing systematic patterns: the species, their evolution and their classification
With the publication of Darwin's On the Origin of Species...
in 1859. a major change was initiated in the way that the hierarchy of life was understood. Darwin's theory of evolution made sense of the natural patterns observed in the variation between organisms. Evolution occurs when organisms experience genetic mutations or recombinations.
or when gene frequencies in populations change because of differing rates of reproduction or mortality Through natural selection or genetic drift these heritable changes may spread throughout the population and over time can
lead to the production of new lineages closely similar to their relatives but differing by the possession of one or more new features (Ridley 1985, 1993; Futuyma 1987;
Skellon 1993). If this new lineage continues to diversify throughout evolutionary time-spans, a wholly new higher laxon (lineage or clade) comes into being. Such lineage diversification produces a strictly hierarchical pattern. The roughly 4.5 billion years of biotie evolution has led to an enormous diversity of living forms on Earth. These forms can be grouped as sets within sets (a nested, hierarchical pattern) based on how recently they shared a common ancestor.
Darwin's observations of selective breeding and the way In which characteristics could he inherited, coupled with the immense diversity of different forms, for example of the birds and reptiles lit; sa« on Ins voyage ;u tin- Galapagos, suggested to him that heritable differences between individuals could build up to produce new species and consequently higher taxa over long periods of time.
Darwin himself was unaware of the mechanisms of genetics, but later studies have revealed how characters are heritable and mutable. Genetic mutation and recombination can each produce heritable novel characters which either by the process of natural selection or by non-selected random genetic drift lead to populations in different places diverging from one another over time (refer to Chapters 4.2 and 4.3).
Thus the products of evolution are arrayed in natural groups which all people, to a greater or lesser extent, can recognize. The evolutionary explanation of this pattern and diversity is the most important rationale for the taxonomic system used by scientists. This arrangement of the diversity of forms of organisms into a hierarchy serves our goals of communication, and information storage and retrieval, by reflecting the evolutionary process that created these forms in the first place.
2.1.3.1 Analysing systematic data to reconstruct evolutionary history
The results of the evolutionary process described above can be reconstructed by careful comparative study of the taxa involved (Hennig 1966; Eldredge and Cracraft 1980; Wiley 1981; Crisc 1983; Forey et al. 1992). Evolutionary mutation results in one of three patterns; new features arise, old features are lost, or pre-existing features are transformed to a greater or lesser extent. Any of these patterns are evolutionary changes In practice, taxonomies find such heritable changes at all levels of the taxonomic hierarchy and at all levels of organ is imc organization, from single changes in DNA sequences to large changes in skeletal organization or even the entire body plan of the organism.
Because descendants inherit the features ot their ancestors, a new mutation that first appeared in the ancestor
I
|Characterization of Biodiversity
nds to be passed to its descendants. The set of all organisms, living and dead, that descended from thai original modified ancestor is known as a lineage or clade The novel mutation is known as a character, trait or feature.
The old version of the trait is termed primitive, and the new version is derived. Over immense spans of geological time, speciation may occur so that the lineage splits into several to many species. Subsequently mutations may occur that delimit subsidiary lineages. From a strictly taxonomic point of view, why these changes occur, or whether they are beneficial, neutral or even detrimental to the species in which they occurred is irrelevant. What matters is that any given group of taxa both agree and differ in which characters they possess. Thus spiders are the only Arachnids that have terminal abdominal spinnerets and thoracic poison glands that open through the fang. On the other hand, only some spiders can make viscid, sticky silk;
the webs of other species are dry. The simplest hypothesis is that the common ancestor of all spiders had spinnerets and fangs, but that only the common ancestor of a particular subset of spiders made viscid silk. For this simple case it is easy to see how important events in evolutionary history are reconstructed. The evolution of poison fangs and spinnerets marks the origin of spiders, and the invention of viscid silk marks the origin of a particular subfamily of spiders, the Araneoidca,
In evolutionary theory, characters of organisms that are similar because of inheritance from a common ancestor are called homologies. Classic examples are the wings or feathers of birds. No other group has feathers, and close examination of any feather discloses additional complex similarities that substantiate the homology of feathers.
Another example is the sting of a wasp, actually the modified female ovipositor. Only some Hymenopteran species have stings, and in all of these species the sting is always the modified female ovipositor.
If evolution consisted only of the gain of complex homologies that were never lost by descendants, reconstructing evolutionary history would be simple indeed.
Two processes complicate the issue. First, natural selection is amazingly efficient at moulding what appears to be the same feature from different starting points, a phenomenon termed evolutionary convergence. The wings of birds and bats are so similar that many years ago the homology of the two features was an open question. Detailed comparison, however, revealed substantial differences The.fleshy, spiny stems of some African Euphorbia plants are convergent on those of New World cacti. Porpoises are mammals, not fish, despite their fins. However, often the only way to test if two features are convergent or truly homologous is through quantitative analysis.
The second process that complicates systematic analysis is loss of features. Snakes originally had two pairs of limbs like other terrestrial vertebrates, but most have lost all trace of
,o
37
Character 1 Character 2 Character 3 Character 4 Character 5 Character 6 Character 7
4 0
t j j i %
Cow 0 0 1 1 0 0 0
Horse
0 0 1 i 0 0 0 Cat 1 0 0 0 ] 1 1 Fox 0 I 0 0 1 I 1Wolf
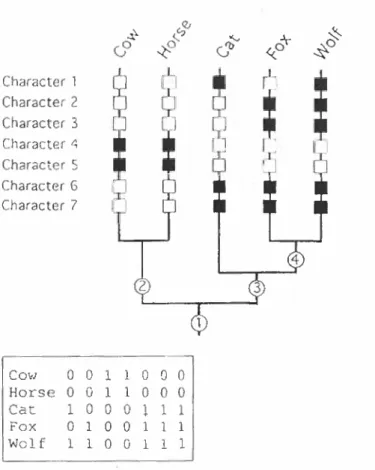
1 1 0 () ]. 1 1Figure 2.1-4: A simple data matrix and the implied phylogenetic hypothesis of four taxonomic groups.
them. Fleas may not have wings, but many other features betray their relation to winged insects. Once again, it is frequently impossible to distinguish secondary loss of features from primitive absence except through quantitative analysis.
In practice, systematic data are compiled as a matrix of characters by taxa and analysed quantitatively by computer.
By reading across (or down) the matrix, one can either read off all the relevant characters of a particular taxon, or conversely see which of a number of taxa possess a particular feature. The computer analysis is designed to provide the best possible estimate of the phylogeny of the group (as described above), expressed as a branching diagram or evolutionary tree. Such diagrams are often called trees, phylograms. dendrograms, or cladograms (because they indicare relationships between clades of organisms). For simple examples of straightforward data, the best estimate of the phylogeny is often obvious (Figure 2,1-4). but for larger numbers of taxa and characters, computer algorithms are used to produce estimates (Kitching 1992). A number of different algorithms ate currently available (e.g. parsimony, maximum likelihood, or neighbour-joining techniques), and the subject ol which provides the best estimate under what circumstances is an area of very active research (Swofford and Olsen
1990),
38 Characterization of Biodive rsity Box 2.1-2: The relationships of the cow, horse, cat,
ox and wolf.
Cow Horse Wolf
For this tree the groups are:
fr Cow
^=
Horse (r -<s ( \ ( Cat Fox Wolf
\s-—J) ^ /\
and these groups can be convened to taxa in the laxonomic hierarchy:
fcow) (Horse] (^Cat ") ( Fox ] (wdfj Genera (cowj (Horse] fcat~] Fox Wolf Subfamilies
Cow Horse Cat Fox Wolf Families
2.13.2 From phylogcnestc trees to format classifications The trees that result from comparing characters in species are
usually thought to be a graphic representation of the evolutionary relatedness of the taxa. These trees should be viewed as relative statements of relationship. For example, in Box 2.1-2 the wolf and the fox are hypothesized to share a more recent common ancestor with one another than with the cat, but the cat, wolf and fox all share a more recent common ancestor with one another than with I he hoofed mammals such as cow and horse: the tree, therefore, shows a hierarchy of relationships. A tree does not explicitly hypothesize ancestor-descendam relationships. For example, the tree hypothesizes that wolf and fox are related, but not that wolves evolved from foxes or that foxes evolved from wolves.
One of the tasks of a taxonomist is to convert this graphic representation ol relationship into the formal hierarchical classification of taxonomic categories such as genus, family, order, etc. In converting the tree to a classification, the systcmatist gives groups that share a common ancestor the formal taxonomic names Such groups are called monophyleiic taxa and they are
recognized because they share unique derived characters.
The tree shows several sets of most closely related taxa that are nested within larger sets thai contain additional taxa.
These larger groups are, in turn, nested within even larger groups By this process the phylogenetic tree is transformed into the taxonomic hierarchy used as a classification. In creating categories, systematise choose sets that naturally reflect the hierarchy inherent in the tree.
Despite the utility of the traditional taxonomic hierarchy in summarizing diversity and evolutionary relatedness, there are real problems in incorporating elements of the phylogeny into the hierarchy in a precise way. The difficulties relate to the subjectivity in deciding taxonomic rank, and the fact that phylogenies often imply hierarchies with more levels and greater asymmetry than is allowed in the taxonomic hierarchy. A simple example given in Box 2.1-3 makes this clear.
Some biologists (lumpers) stress similarities held in common by the organisms being studied and so tend to group several species into a single genus as in Box 2 1 -3 (a).
Others (splitters) stress differences between the species and so tend to divide the species into several different genera (Corliss 1976) as in Box 2.1-3 (rf).
As a group of species is studied in more detail, it is not uncommon for it to be ever more finely subdivided or for the group as a whole to be elevated to a higher taxonomic category. This simply reflects the fact that detailed study uncovers more characters that emphasize the differences among the species, Microsporidia, which comprise a unique group of obligate, intracellular parasitic protists, are such a group now receiving increased taxonomic attention.
Until recently, their ubiquity did not cause a threat to humans and few systematists worked to describe and classify the species. But since 1985, physicians have • documented an unusual rise in worldwide infections in AIDS patients caused by four genera (Encephalitozoon, Nosema, Pleisiophora and Enterocytozoon), and identifying microsporidian species is impeding diagnosis and effective treatment of patients. As a result, research has been focused on the group and the number and diversity ot forms observed have risen sharply.
2.1.3.3 Why do classification schemes change?
Scientists working in genetic resources, biotechnology, agriculture, conservation and other disciplines that use existing classifications are often disconcerted to find that systematists change the classification scheme. These changes are, however, just the logical consequences of discovery of new data and new taxa, and correction of two kinds of mistaken interpretation.
New technologies constantly give rise to new sources of character information. New information reveals new similarities and differences among taxa that cause us to revise the placement of a tax on in a tree, or to choose to
Characterization of Biodiversity .W Box 2.1-3: A phyloficnetic tree which shows relative reialcdness between len species (A-J).
AGCDEFGHI
In this tree, A and B share a common ancestor and so are called sister taxa. Examining this tree you see that D and E, F and G, and I and J are also sister taxa. The sister group to species C is the group A + B, and so forth. There are several different ways to sort these species into acceptable, monophyletic genera, shown below. For example, the decision to place taxon C as one of many species in a genus {a) or as a single species in its own genus (d) is an artificial decision based on the personal preference of the taxonomist.
(h)
id)
lump or split a taxon within an existing classification. An example of this sort of change is illustrated dramatically by the revision of prokaryote classifications resulting from molecular genetic data that have become available only within the past decade (Figure 2. 1 -5 ).
The discovery of previously unknown species will also change classifications. If unique, these species will have to have new taxa created for them. In addition, they have new characters or new combinations of characters whose study revises our hypotheses about evolutionary relationships of
a|l the taxa. There have been some recent spectacular discoveries of new vertebrates such as the plankton-feeding megamouth shark described in 1983, the Vu Quang antelope of Southeast Asia in 1993, and the golden bamboo
•emur (Hapalemur aureus) from Madagascar in 1986. Bui
llus is only lite lip uf the ia-bcr';.1. Many more new -,pivu\
(especially microscopic organisms) are waiting to be discovered. Indeed, we cannot presently say how many species exist on Earth and some people's estimates range over an order of magnitude, from 5 to 80 million species.
For most species thai have been documented, relatively little is known about their historical relationships.
biological characteristics, or distributions within the Earth's habitats and ecosystems
The first common sort of interpretative mistake that bedevils systematic analysis is the discovery thai the defining features of a taxon are convergent rather than homologous (see 2 I 3.1). The taxon then is known to be polyphyletic (the taxa do not share a recent common ancestor but instead the group has been defined by a

![Figure 2.1-5: Fundamentally fifferem views of the taxonomy of life based on [a] gross morphology (two kingdoms as](https://thumb-ap.123doks.com/thumbv2/123dok/11166669.0/19.921.55.396.61.963/figure-fundamentally-fifferem-views-taxonomy-based-morphology-kingdoms.webp)


