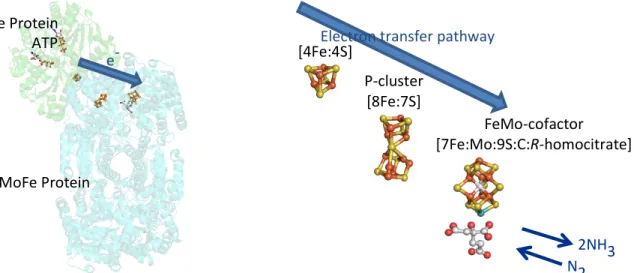
Cofactor FeMo: A [7Fe:Mo:9S:C:R-homocitrate] group that resides in the alpha subunit of the MoFe protein and is the active site of nitrogenase. A thorough understanding of the biological mechanism of nitrogen fixation has the potential to greatly impact sustainable agriculture.
B. Structure of nitrogenase
Such a protein would probably consist of an iron-sulfur cluster similar to the nitrogenase active site. Cofactors are conserved in both structure and location, as are most elements of protein secondary structure.
C. Mechanism of biological nitrogen fixation
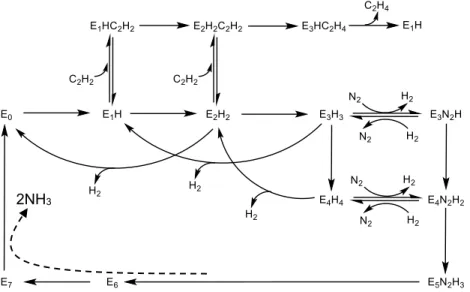
Standard model of biological nitrogen fixation
A. Introduction to and characterization of Cp
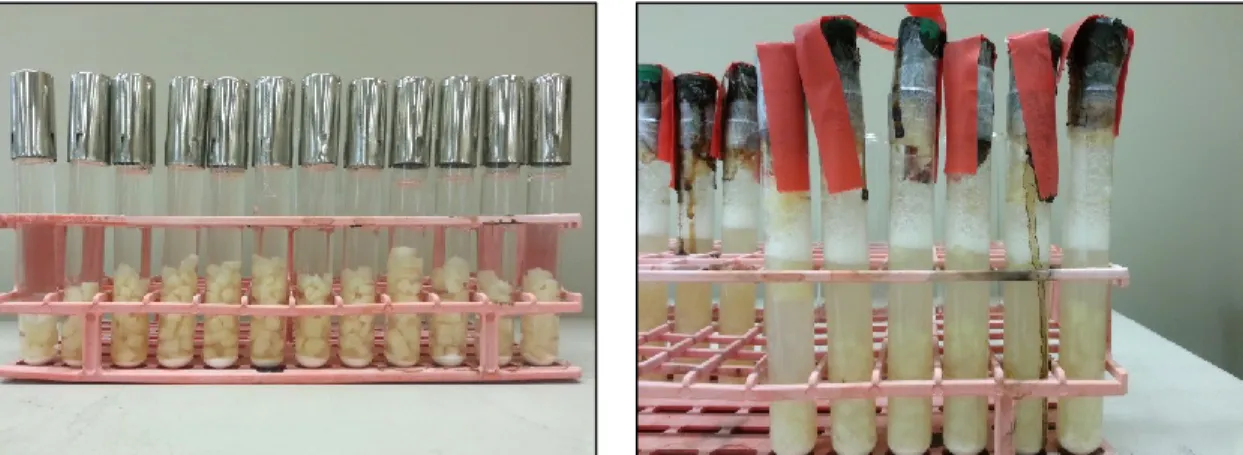
The absence of additional bands indicates that the Cp culture is free of non-bacterial contamination. Short rods and spherical objects are Cp cells oriented at an angle. middle) DAPI-stained Cp culture fixed on a glass slide. right) Cp culture stained with DAPI at the spore production stage.
B. Cell growths
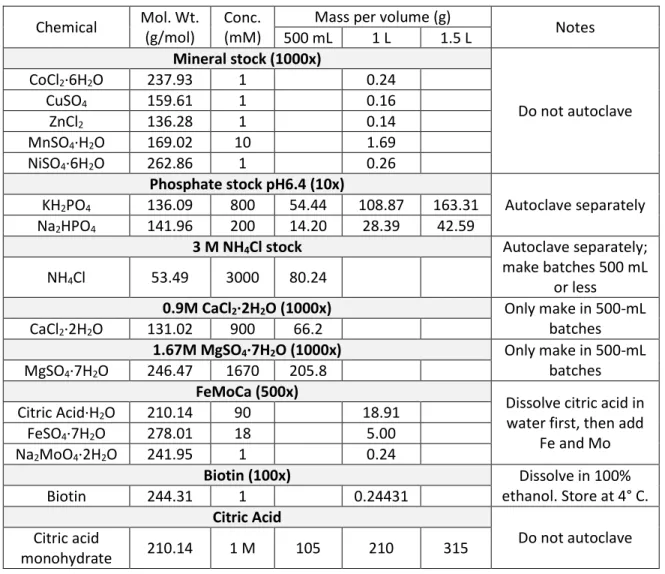
- M CaCl 2 ·2H 2 O (1000x) Only make in 500-mL batches
- M MgSO 4 ·7H 2 O (1000x) Only make in 500-mL batches
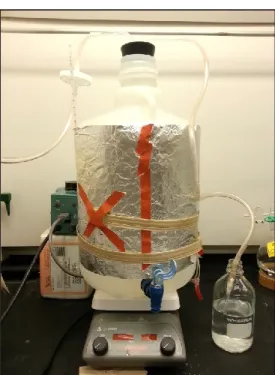
Another layer of aluminum foil was wrapped around the outside of the carboy (not shown) to avoid heat loss to the atmosphere. Carbon OD600 was measured at inoculation and hourly starting at 5 h.
15 L culture with no ammonium supplement
15 L culture with 2.5 mM ammonium supplement
15 L culture with 10 mM ammonium supplement
Example growth curve for harvest cultures at 2.5 mM ammonium supplement
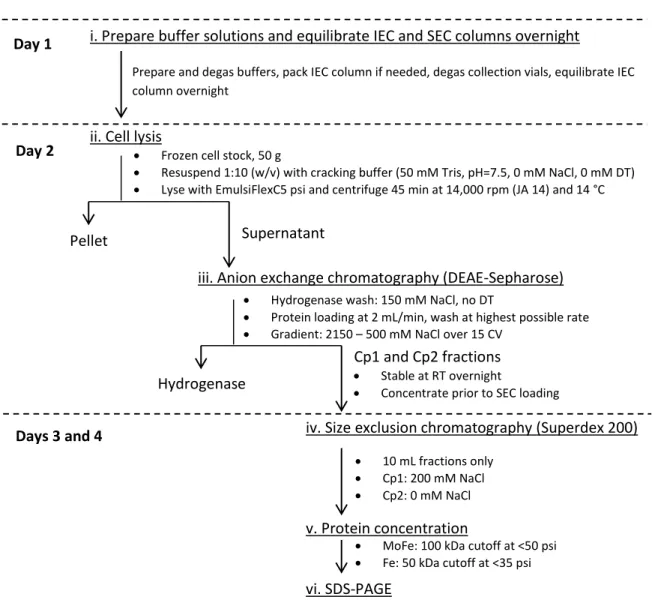
C. Protein purification
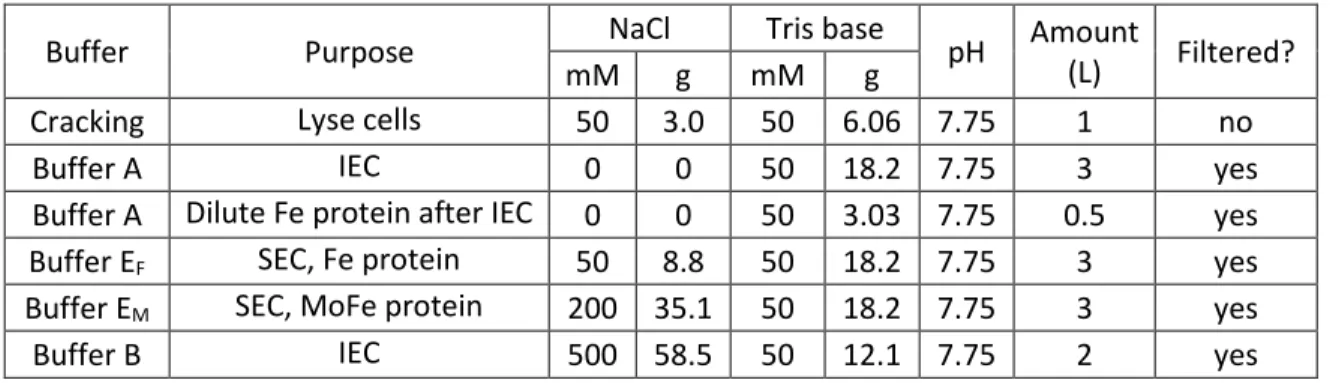
After degassing was completed, the cracking buffer and a small volume of buffer A were transferred to the anaerobic tent. The IEC column was equilibrated overnight using a combination of buffers A and B equal to the cracking buffer salt concentration.
Sample chromatogram from the IEC
Without introducing air bubbles into the system, protein was loaded onto the IEC at 2 ml/min through a long needle using the ÄKTA system (Pharmacia Biotech ÄKTA Explorer Air100). When experimenting with new buffers, protein was loaded with the FPLC pump (which clogs less easily compared to ÄKTA) in case protein or lipids precipitated during loading.
Sample SEC chromatogram
D. Acetylene reduction activity assays
The area and percent area of the methane/impurity, ethylene, and acetylene peaks were detected with a flame ionization detector (FID) and recorded. To calculate the specific activity of the protein as a function of component ratio or dilution, ethylene formation for each vial is calculated by v = (P t where P is the original reading of the ethylene peak area and t is the total volume (ml) of liquid in the bottle (1.3 ml).
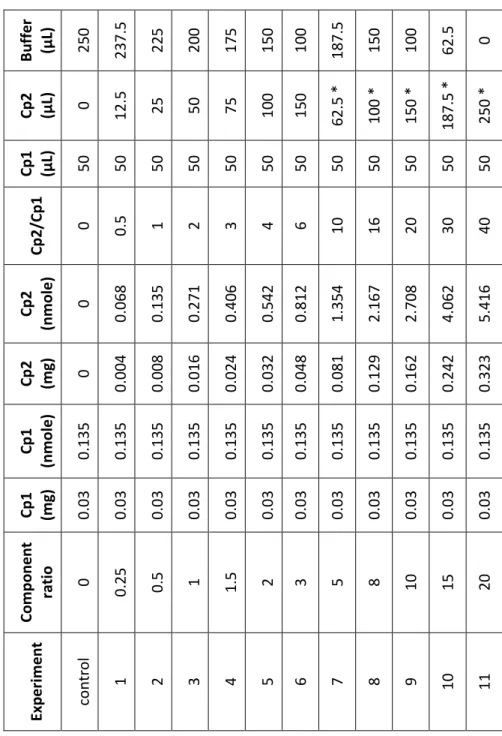
Sample calibration curve for acetylene reduction activity assays
The maximum ethylene formation rate is evaluated by Michaelis-Menton fitting of the resulting titration curve (titrant amount vs. v). The maximum speed divided by the amount of titrated protein in the vial is the final specific activity expressed in nanomoles of ethylene per minute per milligram of protein.
Average specific activity of Cp1 titration assays
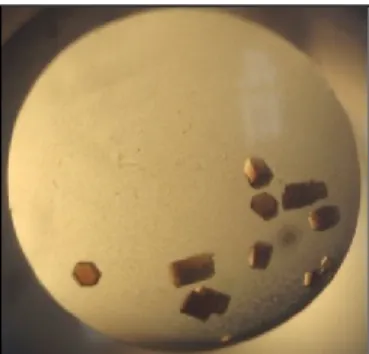
E. Crystallization
The plates were checked for crystals using low power on a microscope in the anaerobic tent to prevent heat or radiation damage to the crystals. In sitting drop vapor diffusion crystallization, each well is sealed and the water in the crystallization drop evaporates.
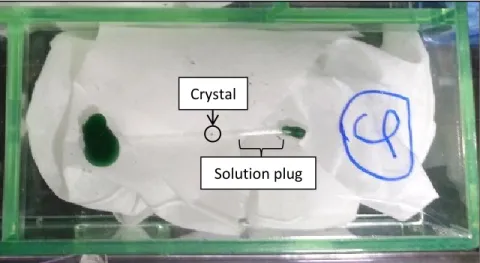
F. X-ray crystallography and structure solution
Once the crystal was in the capillary, it was placed approximately in the middle of the capillary with a pipette. Once the crystal and solution plug were in place, the small opening of the capillary was sealed with wax.
A. Abstract
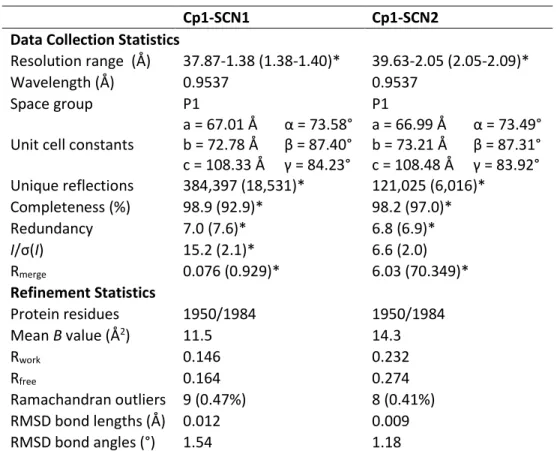
Nitrogenase MoFe Protein from Clostridium pasteurianum at 1.08 Å Resolution: Comparison with Azotobacter vinelandii MoFe Protein. This chapter summarizes my contributions to the publication of the same title written by Prof.
B. Introduction
B. Results
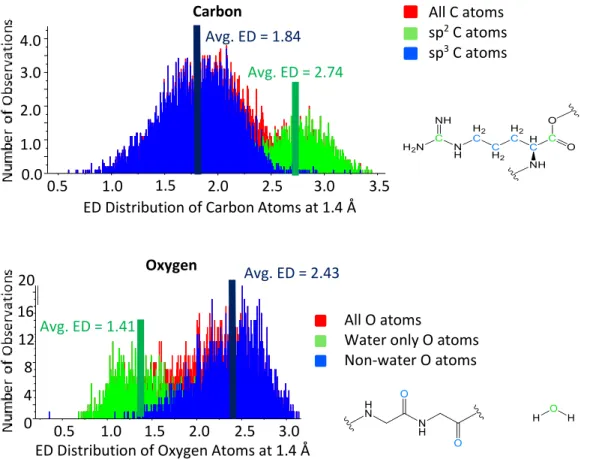
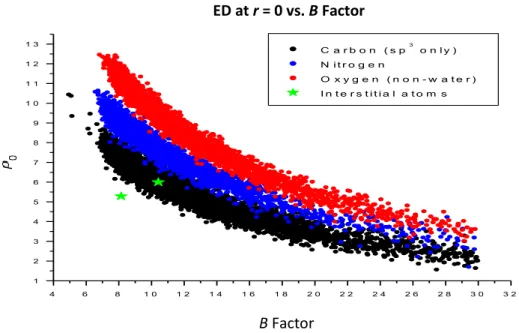
The electron density of the interstitial atom best fits the average carbon in the protein structure (Figure III-7). The electron density of the interstitial atoms increases quite significantly at an integration radius of 1.4 Å compared to other carbon atoms in the protein structure. The electron density of the interstitial atom correlates best with sp3 carbon atoms compared to sp2 carbon atoms.
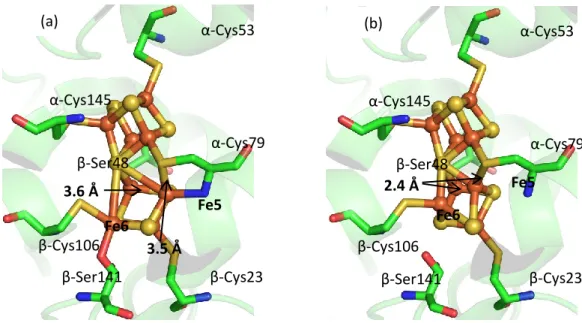
F. The P-cluster
In the (dithionite-reduced) Cp1 structure presented here, the distance between Cp1 β-Ser45 and S2A is 2.9 Å. When the P cluster is in the reduced state, Fe5 and Fe6 open to form more hydrogen bonds between Fe6 and β-Ser188 in Av1 and β-Ser141 in Cp1. Interestingly, there are no nearby residues that can interact with Fe6 in the case of the Ser188Ala substitutions in Av1.
G. Conclusions
- Acknowledgments
Because of the small size of each cube compared to the size of an atom, each cube is assumed to have uniform electron density. The program calculated the electron density of each atom at a given radius from the atomic center by averaging the electron density of each box contained in the given radius. The electron density was calculated for each atom from the atomic center (0.0 Å) to 1.4 Å at 0.2 Å intervals.
J. Supporting information
The work was supported by NIH grant GM45162 to D.C.R., and the National Science and Engineering Research Council of Canada and Caltech Center for Environmental Microbial Interactions fellowships to L.M.Z. We thank the staff at beamline 12–2, Stanford Synchrotron Radiation Lightsource (SSRL) for their assistance. We acknowledge the Gordon and Betty Moore Foundation, the Beckman Institute, and the Sanofi–Aventis Bioengineering Research Program at Caltech for their generous support of the Caltech Molecular Observatory.
A. Abstract
B. Introduction
The standard model for biological nitrogen fixation
C. Results and discussion
From the Xe binding site to the FeMo cofactor, the paths (blue tiles) are the same. PRL resides on one arm of the central channel that bends toward the cofactors (Figure IV-4). Branching off this pathway, substrates can go either to the FeMo cofactor (forest green surface, path BI) or to the P group (green surface, path CI). b) A close-up of the BI and CI pathways leading to the FeMo cofactor and the P cluster, respectively.
D. Conclusion
All pathways access the Fe2,3,6,7 and/or Fe3,4,5,7 sites of the FeMo cofactor; however, this does not necessarily mean that these faces are the primary targets for substrate binding, since substrates can move around the FeMo cofactor. Overall, our studies find that various small molecules can access the interior of the MoFe protein via multiple pathways (see the movie in the Supporting Information). This is based on the experimental identification of non-aqueous small molecule binding sites within Av1 and Cp1, two of the most structurally divergent bacterial MoFe proteins known.
E. Experimental
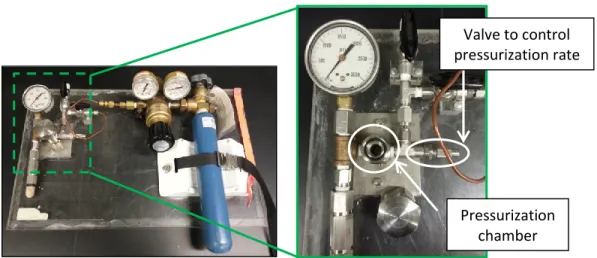
2-3 drops of the mineral oil Fomblin Y (cryoprotectant, Sigma-Aldrich) were added to the top of the crystallization drop. The crystal was slowly lifted through the cryo-protective layer of the droplet and then very quickly moved into the pressure chamber of the printing apparatus. This process must be done carefully to ensure that all the oxygen is squeezed out of the device without increasing the pressure too quickly, causing the crystal to crack or be lost from the loop.
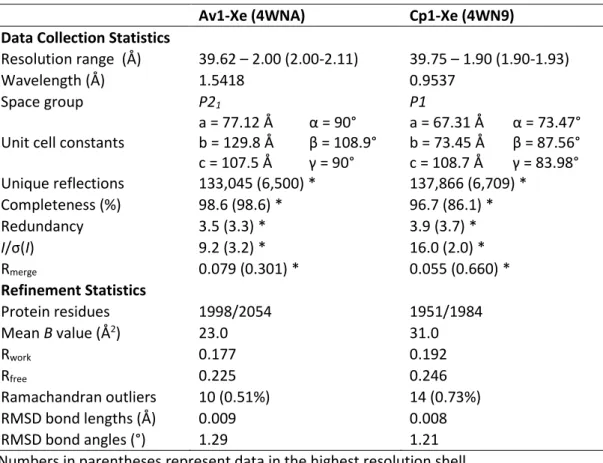
F. Accession codes
For each small molecule, two pathways were selected: one from the protein surface to the binding site of the small molecule and the other from the binding site to a cofactor. For any given starting point, many trajectories exist; However, the most likely paths are those with the shortest length and greatest width, and are prioritized by CAVER.
G. Acknowledgments
H. Abbreviations
- Supporting information i. Movie
Residue feeding the DI pathway/interstitial water channel in Cp1 and Av1 DI pathway in Av1 DI pathway in Cp1. Residues that feed Dans' NH3 exit pathway in Av1 and Cp1102 NH3 exit pathway in Av1 NH3 exit pathway in Cp1. Residues occupying Smith's molecular dynamics orbital in Cp1 and Av1101 MD orbital in Av1 MD orbital in Cp1.
A. Abstract
This provides further support for the use of the interstitial water channel as a pathway for substrates and products.78.
B. Introduction
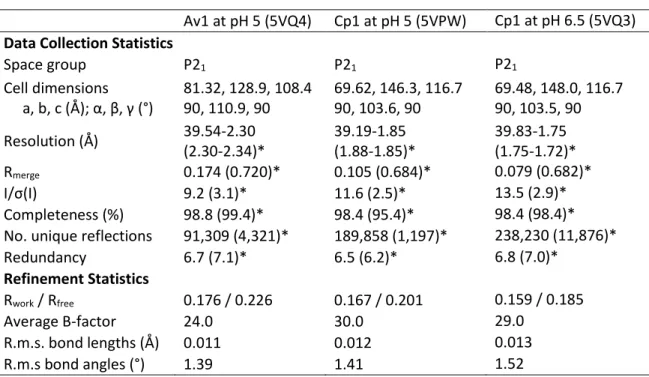
However, the density of the sulfur at this site decreased in the reactivated Av1 structure, suggesting that the sulfur binding site could be a sulfur reservoir. Inspection of 2Fo-Fc and anomalous Fourier maps showed no blobs that could be modeled by a sulfur species anywhere in the protein except in the cofactors or in methionine or cysteine residues. No Se binding sites were observed at physiological pH, confirming the lack of sulfur binding sites observed in the Cp1-SCN co-crystals.
D. Conclusions
The α subunits are colored green and magenta, and the β subunits are colored cyan and yellow. Furthermore, no overlap was observed with the binding sites of other small molecules, such as sulphur, imidazole, ethane-diol and the Cp1 proline ligand78. This provides further support for the use of this channel by polar substrates and products moving between the protein surface and the active site.
E. Experimental
As with the high-energy data sets, the two data sets were offset by 5 mm horizontally and vertically. Although the X-ray wavelength of the low-energy data sets is well above the K-edge of sulfur (2.4720 keV), the signal is still strong enough to observe anomalous scattering of the sulfur atoms using sulfur from known proteins and inorganic atoms as controls. Progress towards determining the location of hydrogen atoms in the MoFe protein using neutron diffraction.
A. Abstract
B. Introduction
The use of neutron diffraction is becoming increasingly popular due to continuous technological advances. This knowledge will (1) provide information on the overall dynamics of the enzyme by showing proton exchangeability at amino acid residues possibly involved in proton transport, and (2) dictate the required crystal size and degree of deuteration for adequate neutron diffraction. Looking ahead, this will inform neutron diffraction experiments in the Cp1 excited state, helping to understand the hydride intermediates that occur on metal clusters.
C. Instrumentation
At the time of screening, both IMAGINE and MaNDi operated at room temperature conditions, but only MaNDi could operate at cryogenic temperatures. Since neutrons cause no radiation damage, neutron data collections at room temperature are feasible given sufficient crystal stability. Crystals began to exhibit poor diffraction quality after about six weeks; thus, a room temperature neutron data set will probably need to be made from two or more merged data sets.
E. Conclusions and next steps
F. Acknowledgments
A. Abstract
B. Introduction
Biological nitrogen fixation
C. Results and Discussion
At this new position, a water molecule bridges the Av1 α-His274 side chain and S5A of the FeMo cofactor (Figure VII-2c). The α-His274 coordinates with S5A of the FeMo cofactor via a hydrogen bond bond with a water molecule. Line broadening is also observed in the low pH spectra, reminiscent of the EPR spectra of Cp1 FeMo cofactor isolated in N-methylformamide.
D. Conclusion
We wish to emphasize that this name is a general designation for a resting state protonated form; we cannot determine the number of protons added to the FeMo cofactor at low pH. In both Cp1 and Av1, however, structural data suggest that resting-state protonation may occur at one of the two band sulfurs not replaced by CO or Se, which may facilitate cofactor rearrangements during turnover.
E. Experimental
The crystals are soaked for at least five minutes in the low pH solution before being frozen with liquid nitrogen in nylon loops. Because the crystal wells contain Tris at pH 8 as part of the crystallization recipe, the actual pH to which the crystals sink after adding the low pH buffer was higher than the pH i. To prepare the EPR samples, the protein stock was concentrated 50% and then diluted with the low pH EPR solution.
F. Acknowledgement
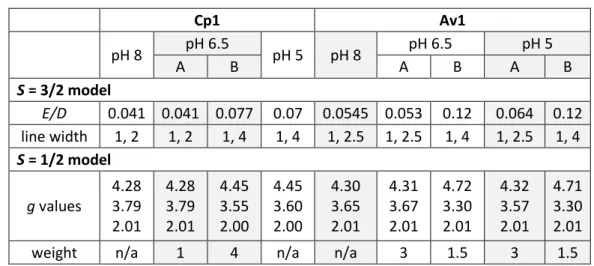
From the S = 3/2 model, the E/D ratio was determined; from the S = 1/2 model, the effective values of g were determined. For spectra exhibiting two spin states, simulations were calculated by combining two spin systems with their E/D ratios and g values.
G. Supporting Information
The electronic changes at the FeMo cofactor observed by EPR at low pH are reversible in Cp1 and Av1. Power sweep of Cp1 and Av1 at physiological and low pH (a) Cp1 power sweep at pH 8. The EPR spectra of polycrystalline and solution protein at low pH match well for both Av1 and Cp1, indicating that the low pH structural changes observed by X-ray diffraction is the cause of changes observed in the EPR spectra at low pH.
CONCLUDING PERSPECTIVES
Nonenzymatic synthesis of the P cluster in the MoFe nitrogenase protein: evidence for the involvement of all iron [Fe4S4]0 intermediates. Comparison of carbon monoxide, nitric oxide and nitrite as nitrogenase inhibitors from Clostridium pasteurianum. Conformations arising during turnover of the MoFe nitrogenase protein of Azotobacter vinelandii and their relationship to physiological function.