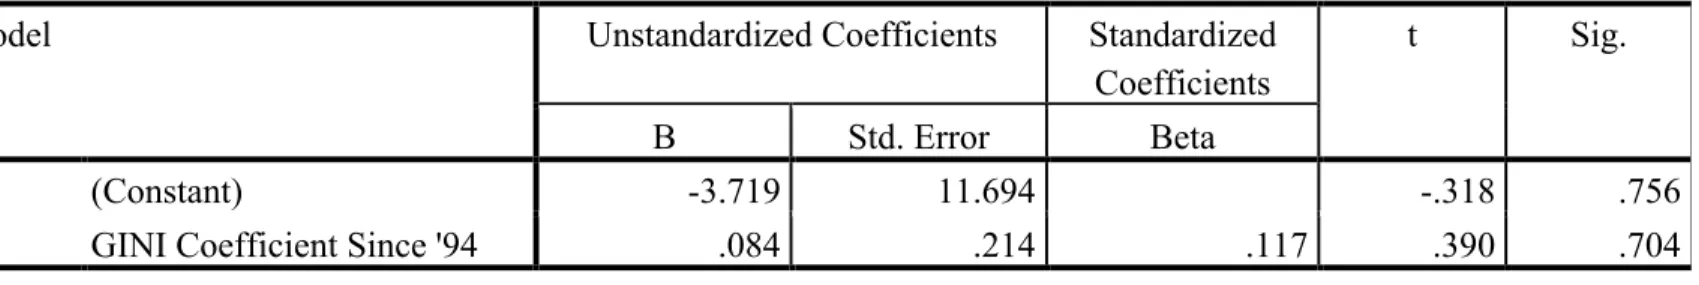
Finally, I run a regression to evaluate the relationship between the GINI coefficient (a popular measure of income inequality) and the frequency of peaceful demonstrations since the end of the dictatorship. On the surface, Chile appears to be one of the most economically successful countries in the region, along with its neighbors Argentina and Uruguay. In this dissertation I will try to demonstrate that the protest culture in Chile is symptomatic of the underlying inequality in the country.
The income inequality is a result of the failed economic policies of the Chilean government earlier in the century. The wealthiest families in Chile almost completely controlled the financial sector, and foreign interests controlled most of the capital in the country. The economic prospects of the working class have not improved much since the Pinochet dictatorship; “the successive democratic regimes.
In the last round of the survey, trust in customers remained largely the same. Many scholars argue that there is "persistent inequality" in Chile that stems from Pinochet's zone market reforms (Torche 316). However, much of the inequality in Chile is concentrated in the education sector, mobility is not impossible but difficult for Chilean citizens.
Thus, the vast majority of capital in the country is still concentrated in the hands of the few, and no further market reforms can reduce this inequality (Torche 431). During the dictatorship, protests were directly related to the regime's repression and violence. Referring back to the problem of economic inequality and income disparity, this inequality does not in itself cause protests.
In the case of the education protests, many students compare themselves to super-rich Chileans to realize that they are in fact deprived. In 1989, Lagos ran for office in a relatively wealthy part of the country - the Santiago West district. Many of the protests currently taking place in Chile are succeeding in part because the protesters are standing on the shoulders of protest giants.
Even today, madrasas march as a living reminder of the atrocities committed in the country, that they must never be repeated. I believe that studying these two topics will capture much of the conflict in the country and allow me to make educated generalizations about the origins of protests in modern Chile. Students in Chile have been protesting almost as long as the Mapuche - in 1960, a scholar outlined the chronic unhappiness of Chilean students over the past 50 years.
Although the specific goals of the students have changed due to the country's different political climate, student unrest is not a new phenomenon in Chile because the underlying issues have not changed much.
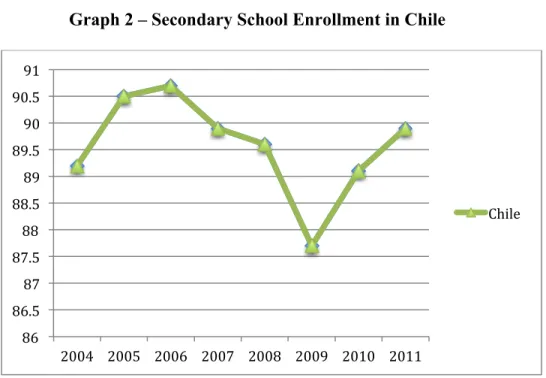
The second chart shows the rate of secondary school enrollment in both Chiles from 2004 to 2011, showing that between 10-15% of the secondary school aged population is not enrolled in school. This is a significant drop from the previous chart, which showed that most children were enrolled in primary school. Although Chile struggles to keep children in school between the primary and secondary stages, at least students seem to have access to education if they want it.
The protesters are harmed by the quality and access to secondary and tertiary schools. What is interesting about this chart is that Chile has seen a huge increase in tertiary enrollment over the past ten years.
Tertiary School Enrollment
Thus, the problem should be less about registration and more about overall satisfaction with the system. In a survey conducted by the organization Latinobarometro in 2011, 34% of Chileans surveyed claimed that university education had deteriorated over the past ten years. 1.2% of respondents believed that only the family should pay for university education (Latinobarometro: quien cree usted debe pagar la educación unversitaria?).
This explains the difference between the increase in university enrollments over the past ten years and the development of university enrollments. I will then monitor Chile's GINI coefficient over the past ten years to detect any fluctuations in inequality. Finally, I will run a regression to evaluate the relationship between the frequency of protests and the level of inequality in the region.
37% of respondents said they had signed the petition or would sign it in the future, and 17% of respondents said they had recently signed the petition. About 14% of respondents stated that they would participate in a boycott or that they had participated in a boycott in the past. Most importantly for this paper, 36% of respondents said they had joined a peaceful demonstration in the past or would join a peaceful demonstration in the future (World Values Survey: Fourth Wave).
I will compare this data on anti-government demonstrations with World Bank data on Chile's GINI index over the past twenty years. I have talked extensively about the GINI index in the course of my article, but to review, the GINI index not only measures the level of income inequality in the country, but can also be used as a measure of relative deprivation. Unfortunately, the World Bank has incomplete data on the Chilean GINI coefficient, but it reports the GINI coefficient for almost every GINI coefficient.
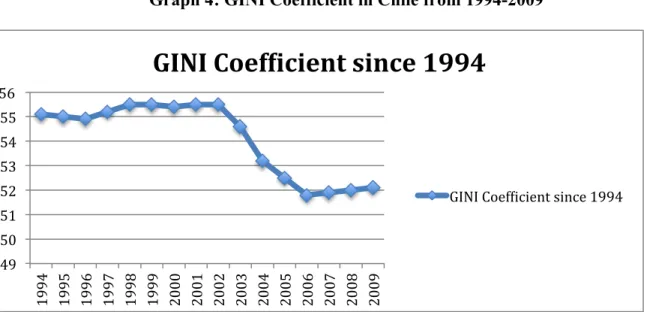
Where a value for a certain could not be found, I averaged the GINI coefficient for the year before and the year after to arrive at a GINI that can reasonably predict the level of inequality in the country that year . In the early 90s, in the period immediately following the dictatorship, Chile's GINI coefficient was around 55 to 56, showing a significant level of inequality. In the early 2000s, the GINI fell by about 5 percentage points, showing that income inequality is slowly and steadily decreasing in Chile.
GINI Coef8icient since 1994
As the graph above shows, the GINI coefficient in Chile is currently high, but it is not as high as in the early 90s. It also shows that the level of relative deprivation in Chile is slowly decreasing in Chile. I believe this can be attributed to the lack of variation in the "anti-government demonstrations" variables.
Chile's GINI coefficient only fell over a period of about 4 years, and the number of anti-government demonstrations tended to fluctuate between 0 and 1. It is nearly impossible to count every formal and informal march and demonstration held in the country. Despite the lack of extensive protest data, I ran another regression with university enrollment as the X variable instead of the GINI coefficient to see if access to education, a variable with more variation, was a more accurate predictor than the GINI coefficient. .
Although my results were not as conclusive as I would hope, I was still able to draw several conclusions about the state of education in Chile and the level of inequality in the country. The survey data I consulted also showed that enough people have protested in the past and would be willing to protest in the future to show that Chileans believe protests are a legitimate way to express their concerns. I also learned why the state of the education system has caused conflict in Chile over the past decade.
Chileans also recognize that education is necessary for social mobility and obtaining a good job, but are unwilling to pay the high tuition fees associated with university tuition and believe the state should take responsibility. Chileans also believe that the education system does not benefit all sectors of society equally. It is useful to track how income is dispersed across the country and is particularly useful in Chile because it shows how the neoliberal model has affected the country.
But inequality in Chile is also evident in its social and political sectors. Indigenous groups in Chile still do not enjoy the same opportunities as the rest of Chile. Many respondents in both the World Values Survey and the Latinobarometro surveys report that they have little confidence in