CIBER uses two spectrometers to measure the absolute luminosity spectrum of the near-infrared extragalactic background. One, a high-resolution Fabry-Perot spectrometer, is tuned to the CaII 854.5 nm line of the solar spectrum and is designed to measure the absolute brightness of the Zodiacal Light directly, which is the source of the largest uncertainty in the infrared near. background spectrum.
Chapter 1
- The first stars
- Current measurements constraining reionization
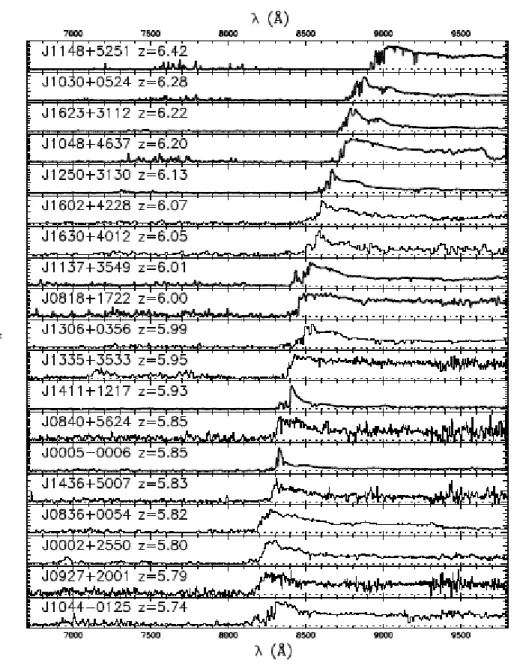
- i High redshift quasars and gamma‐ray bursts
- ii Cosmic Microwave Background polarization anisotropies
- iii Upper limits from TeV blazars
- iv 21 cm tomography
- v The near‐Infrared background absolute brightness
- vi Fluctuations in the near‐Infrared background
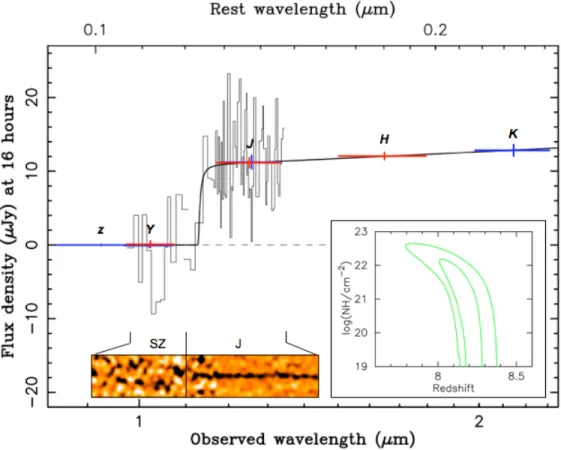
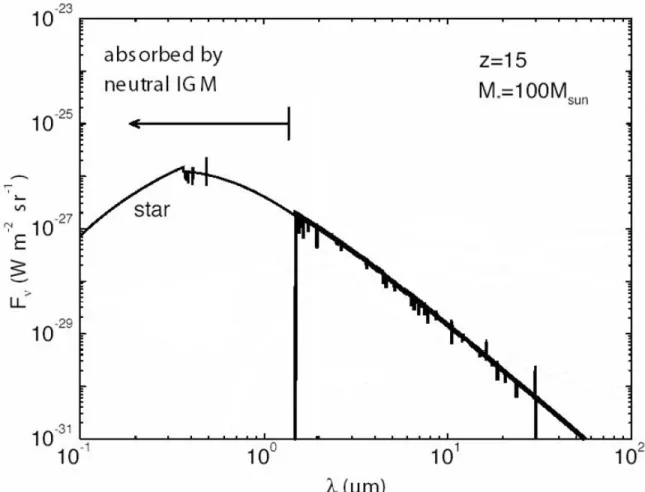
This cutoff would be an observable feature in the spectrum of the near-infrared background (NIRB) today. A natural region of the extragalactic background spectrum to look for a signal from reionization is in the near-infrared.
Chapter 2
- Introduction to CIBER
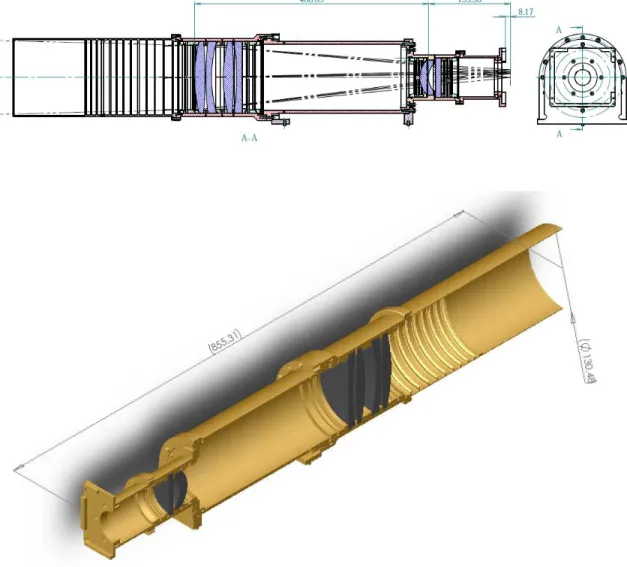
- Optical design
- i The dual wide‐field Imagers
- ii The Low Resolution Spectrometer
- iii The Narrow‐Band Spectrometer
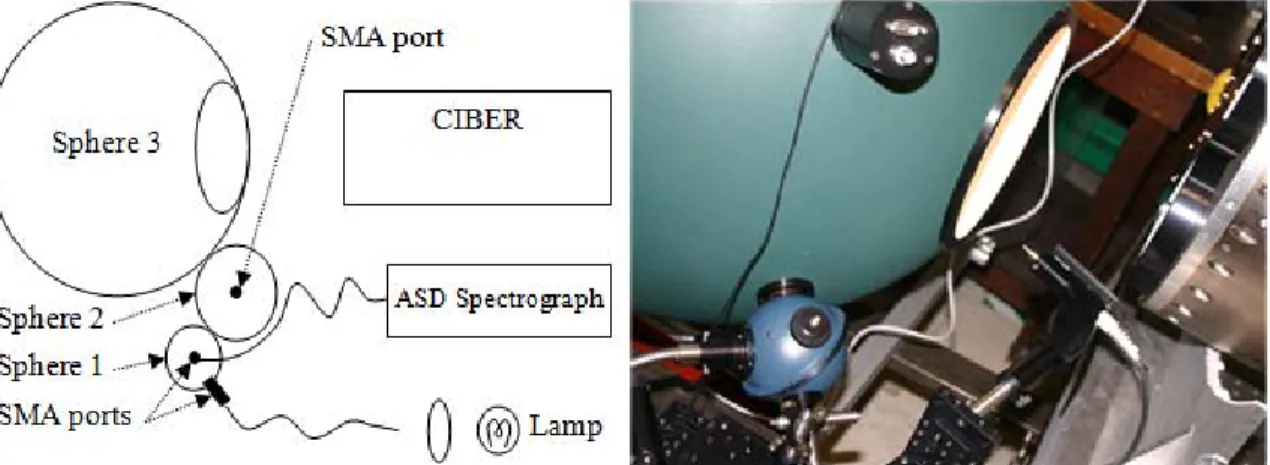
- iv Lab testing configuration
- v Calibration lamps
- The CIBER cryostat
- i Payload shutter door
- ii Liquid Nitrogen tank
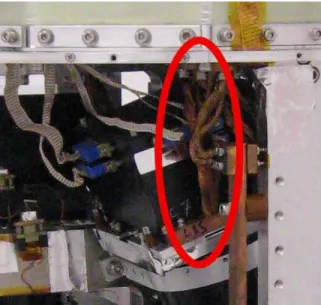
The wavelength profile and other characteristics of the LEDs used as the calibration lamps are shown below in Figure 2.2.10. Cabling for the shutter door runs along the inside of the skin from the forward bulkhead.
2.3.iii Charcoal getter
The radiation shield is firmly bolted to the liquid nitrogen tank at the top for good thermal contact, while it is stowed away with the Vespel at the bottom. The primary insulation is provided by a three-layer coating of multi-layer insulation made of aluminized Mylar, wrapped around a container of liquid nitrogen and a radiation shield.
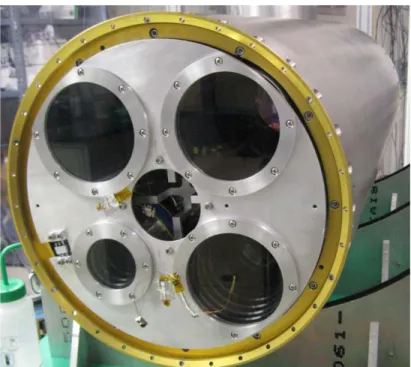
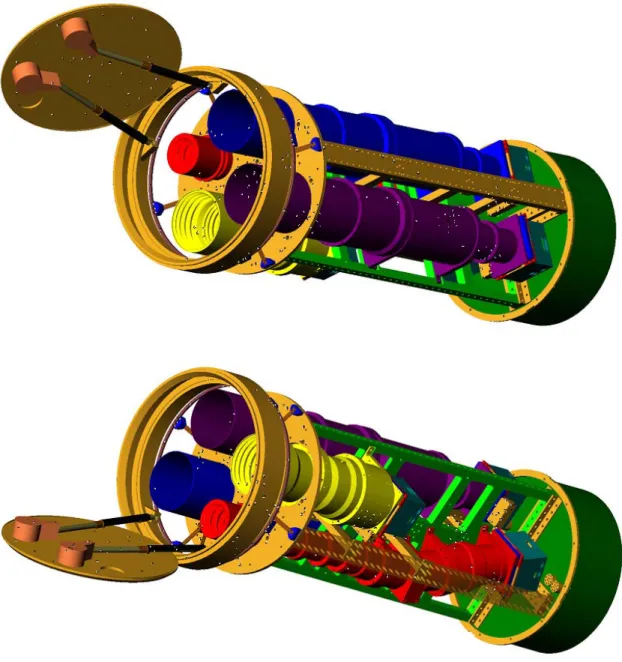
The two Imagers are mounted parallel to each other on one side of the optics bench, and the two spectrometers are mounted on the other side, also parallel except for the part of the LRS that follows the prism (Figure 2.3.11). The LRS is shown in red, the NBS in yellow, the H-band Imager in purple and the I-band Imager in blue.
Readout electronics
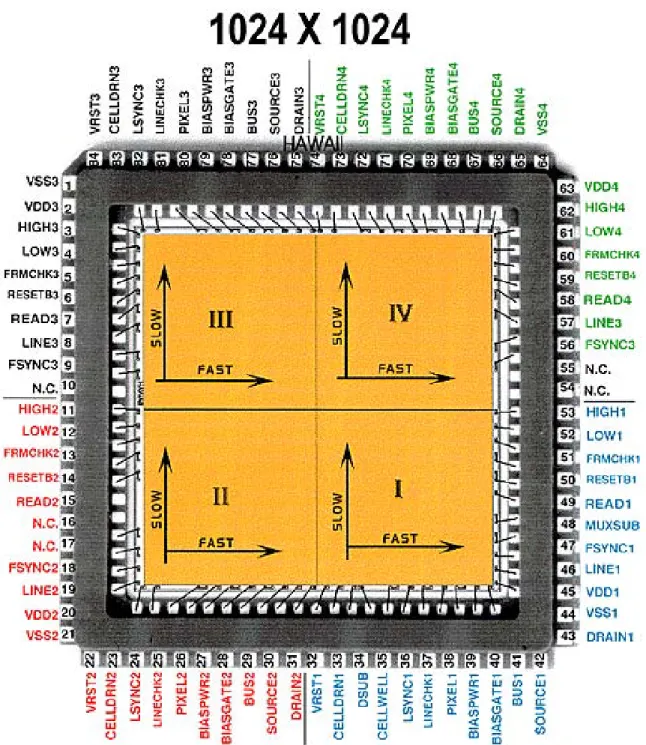
Each quadrant is read out as a double shift register driven by the clock, so that each pixel along a single line (fast, driven by FSYNC) is read out before the next line is read out (slow, driven by LSYNC). The HAWAII arrays are read out in 1.7 second frames, which translates to 154 kHz sampling of each quadrant.
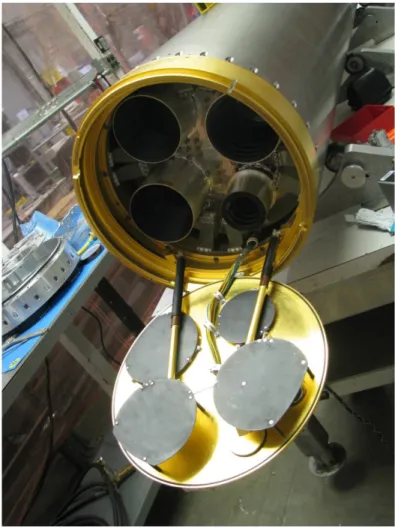
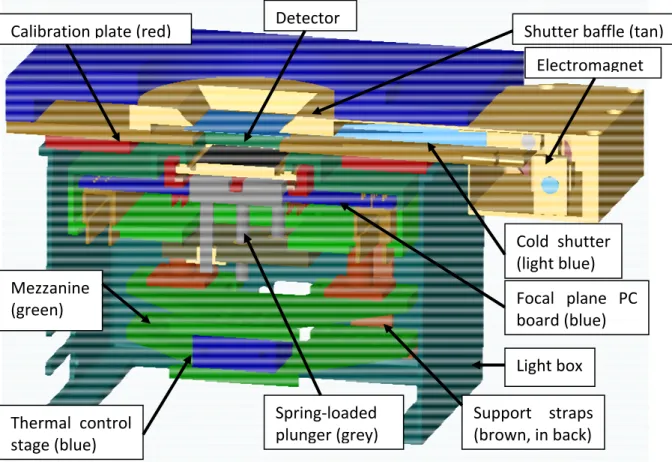
The CIBER focal plane assembly
The outer light box is cut from a single solid block of aluminum, with panel mount connections on the short cryogenic cables that run between the detector box and the wall. No other contact between the light box and the focal plane box other than those thin manganin cables is allowed, so there is no thermal short circuit to bypass the thermal control stage. At the front, the cryogenic shutter assembly now fits above the top cover of the detector box, with the small gap protected by the outer light box.
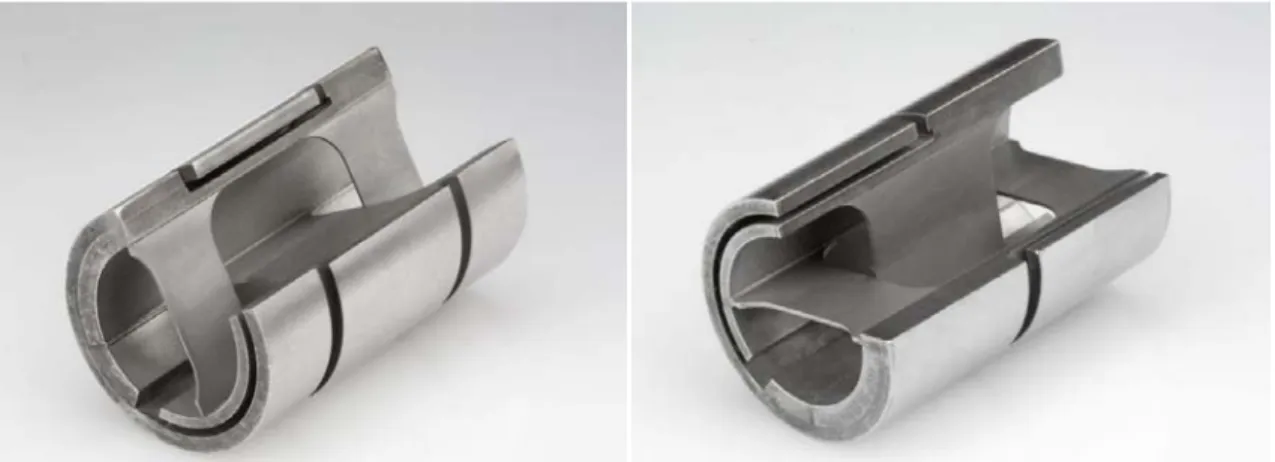
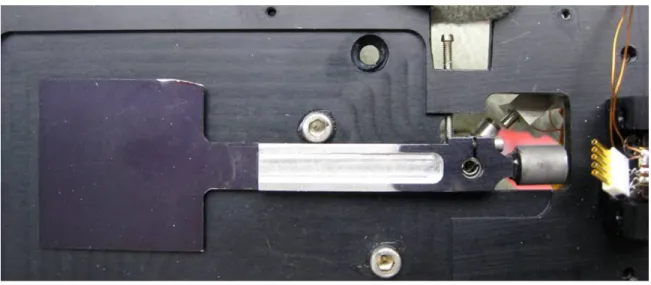
The shutter unit consists of a tight-fitting box with an opening cut at the top and bottom, which is dimensioned for the detectors and the speed of the optics at the detector box. Within the framework of the box, a thinly folded and black anodized aluminum leaf opens and closes, activated by two electromagnets. When open, the blade is stored safely out of sight to the side of the case, and when closed, the blade blocks the opening completely.
The CIBER focal plane uses a two-stage thermal control scheme, with two precision thermometry readouts on the center stage, along with a heater. One of these thermometers is used for temperature control, while the second is used to monitor stability and to monitor errors in the first thermometer for the control algorithm. The second stage provides a thermal time constant 2 = C2/G2 to filter noise caused by the control thermometry, as shown in the recorded temperatures of the stages during flight in Figure 2.5.8.
CIBER cold shutters
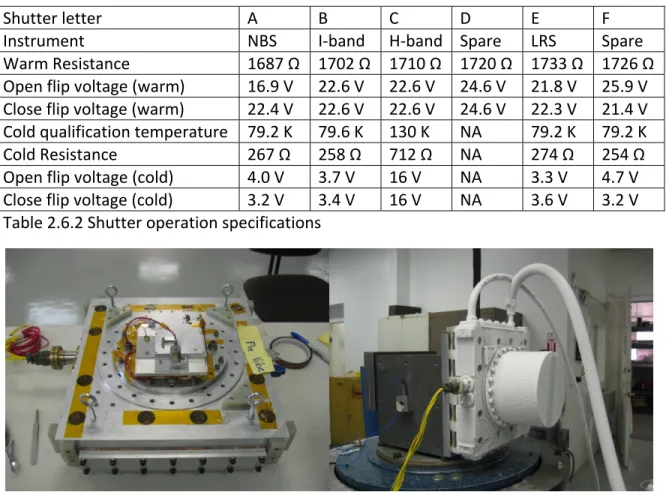
Note that the unactuated magnetic force between the pole piece and the permanent magnet must be stronger than the torsional bending spring force in order for the grating to have a bi-stable state. The initial design of the shutters was based on the space-qualified design used for the ESA Infrared Space Observatory and the ISAS Infrared Telescope in space satellite experiments. A modified version of the shutters was used in the NITE rocket experiment, which is described in detail in Bock et al.
After the Wallops test, the H-band display shutter flex spindle was replaced and none of the other shutter assemblies were modified. Testing after the vibration test at WSMR indicated that three of the four hatches had failed. There are several problems with the original design, which together eventually led to the failure of the shutter assemblies.
After the complete louver prototype was built, a second series of vibration tests were performed before the flight hardware was assembled. To match the durability of the larger bending roll, it was decided to strengthen the blade to prevent it from breaking so easily, although it could easily survive flight qualification levels. The cap finally failed after 42 seconds at +12dB above full random on the thrust shaft only, when the blade broke again at the end of the folded shaft.
The cold oscillation device consists of a solid metal plate on top of a winding liquid nitrogen tube through which the liquid flows continuously and slowly. An aluminum bell is placed on the component to be tested and is pumped down to a low-grade vacuum to prevent frost build-up inside. The assembly is separated from the vibrating head fixture by a two inch thick insulator to prevent damage to the fixture.
CIBER flight overview
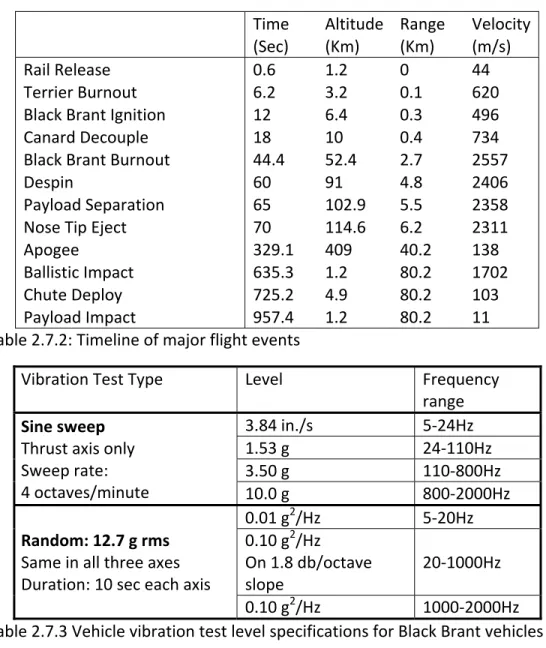
The vibration tests consist of random vibrations in the thrust and then in both transverse axes for 10 seconds each (Table 2.7.3). The vibration test specifications subject the payload to conditions that are slightly harsher than expected during launch, but not that bad. The sun must be more than 5 degrees below the edge of the Earth at apogee 4. The first restriction is intended to ensure that CIBER has directly comparable zodiacal light coverage to DIRBE.
The projected trajectory on the ground is shown in Figure 2.7.5, and despite high winds, the actual trajectory did not deviate significantly from the projection. From the air it appeared that the cargo had landed on the hard plasterboard north of the sand dunes. The cargo was divided into two halves and flown back to the Vehicle Assembly Building (Figure 2.7.9), where it was again purged with gaseous nitrogen.
Chapter 3
- Imager calibration with NIST
- i Measurement configuration
- ii Spectrum correction
- Focus and PSF
- i Lab PSF measurement
- ii In‐flight PSF measurement
- Flat field correction
- Dark current and thermal stability
- Noise correlations
- Rings in the Imager data
- i Classification
- ii Mitigation
- Diffuse contamination
- i Thermal emission
- ii Earthshine
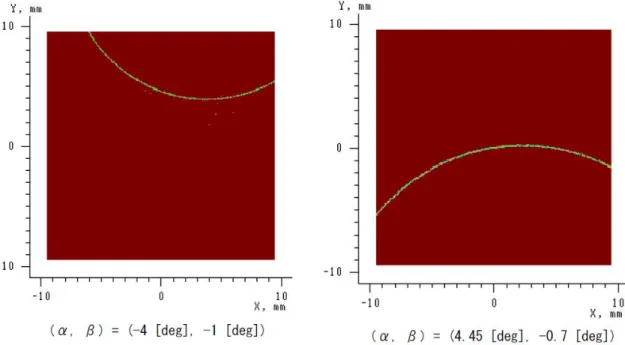
For the data from the first flight, photon noise and systematic error from the flat field due to contamination of the data dominate (§3.7). Apart from correlations between quadrants, there appear to be correlations on small scales in the read direction of the array. The results of the fit are summarized in Table 3.6.1, and the simulated rings in each field for both imagers are shown in Figure 3.6.9.
The flat field estimate rests on the assumption that each field is spatially uncorrelated and that fluctuations in sky brightness are relatively small. This means that directly applying the flat field measured in the laboratory to flight data artificially increases the gunshot noise.
Chapter 4
Overview
Ring and ghost elimination
Once the beam is off the side of the array, the attenuators are removed and the increments continue until 6 degrees off-axis, where the first class of rings disappears. No evidence of the first class of rings was seen when this experiment was repeated after the first modifications were made. On the other hand, since they are much fainter than the first class rings, their degree of contamination of the flight images is much less.
Thermal emission mitigation
Another change was to move each of the instruments inward to increase their distance from the skin. Together with the new Laser Black flap coating, this alone should reduce thermal pollution to an acceptable level for the I‐band Imager. Thus, they are driven by the opening and closing of the cargo hatch door itself.
Earthshine mitigation
Chapter 5
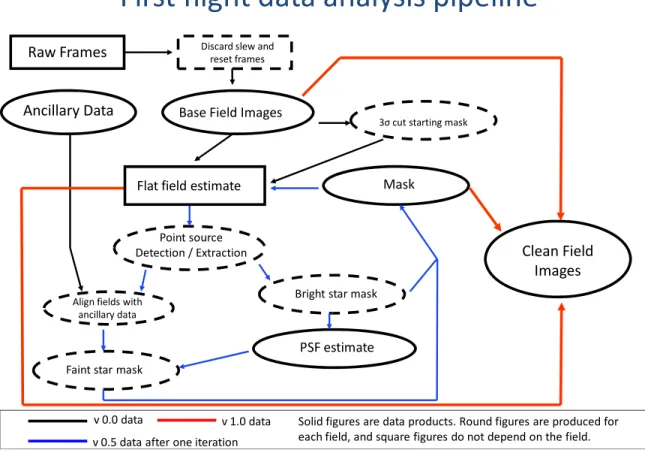
- Data reduction procedure
- Power spectrum estimation
- Constraints on near‐Infrared background fluctuations
- Conclusions
The power spectrum of the difference between Bootes B and Bootes A is shown for I-band in Figure 5.3.1 and H-band in Figure 5.3.2 together with estimates of several types of contamination. The power spectrum of residual rings is calculated from the difference between the ring simulations for the fields with the finite masks applied. The power spectrum for residual stars is calculated in the same way from the difference between the PSF-.
A.1 Derivation
A.2 Implementation in IDL
The angles in the triangles will be the same in both images if all the sources match, regardless of the relative alignment, rotation and scale between the catalog and the image. Thus, once all the possible triangles have been formed in both sets of sources, sources can be matched by finding for each source in the image the source in the catalog with the maximum number of triangles with the same angles. The ratio of the perimeter of each corresponding triangle provides an estimate of the relative scale between the image and catalog, and the difference between the angle from the reference direction provides an estimate of the relative rotation between them.
B.1 Derivation
Once a set of matching sources is identified in the image and catalog, the triangle transformation can be performed again on only those sources. This time additional information is kept: the perimeter of the triangle and the average angle made by the two arms of the triangle from a reference direction. The corresponding source is considered the center, while the two other sources used to construct the triangle form the ends of the arms.
Pixelization of coordinates
This will work for any relative rotation and scale between the image and the catalog, but will not work if they are mirrored. Finally, the x and y offsets in the pixel coordinates can be found simply by fitting the matched source coordinates into a linear equation, after the catalog coordinates are transformed by the rotation and scale just determined.
The triangle transform
The final values of X and Y in Equation 2 must then be scaled and shifted to roughly match the image, although this is not strictly necessary. Then, for each triplet combination, the length of each arm and the base of the triangle are simply given by the Pythagorean theorem, written here for clarity. Finally, if the reference direction is assumed to be along the X-axis from the point (Xc,Yc), the average angle of the two arms is 5) Note that the branch discontinuity of the tangent function must be taken into account: if the average X‐value of the arms is negative, let | | , and if the mean Y value is negative, let |2 | (after taking negative X values into account).
B.2 Implementation in IDL
Reducing the computational cost
The lower limit is determined by the required angular accuracy, since differences in pixelization can cause errors of a few degrees for sources located close to each other. The upper bound mainly serves to reduce the number of sources involved in the central source transformation, although care must be taken to make it large enough compared to the inner radius so that sources can be matched if the panel scales are very different. Finally, when the sources are matched, those sources with the highest number of matches can be selected and used exclusively in the second iteration of the transformation without further restrictions.
Matching sources
The final number of sources involved in the transformation can be quite small at this point (less than 32 is recommended), since even a small number of sources will generate a very large number of corner triangles. If the bin size is and the number of bins is n=180/, then the individual elements of can be converted into a single angle index. Sources with the highest matching confidence are those with the highest number of matching triangles.
Calculating the alignment parameters
If there are Nimage sources in the image and Ncatalog sources in the catalog, this will result in a Nimage X Ncatalog array with elements (k,l) corresponding to the number of matching triangles in common between source k of the image and source l of the catalog. For greater accuracy, the coordinates of the catalog can be transformed using equations 7, 8, 11 and 12 and the whole procedure performed again on the transformed image. 34;First sources in infrared light: stars, supernovae and miniquasars" Monthly Notices of the Royal Astronomical Society 351 L71-L77, 2004.