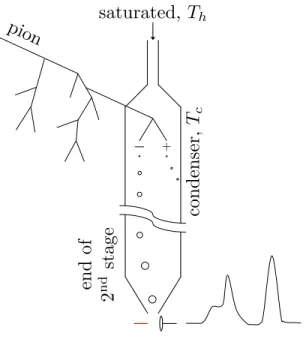
Generally, the incoming aerosol is first heated while exposed to the saturated vapor from the working fluid. Charged constituents of the sample migrate axially in the presence of an electric field at different velocities.
Abstract
Nomenclature
Greek Letters
Introduction
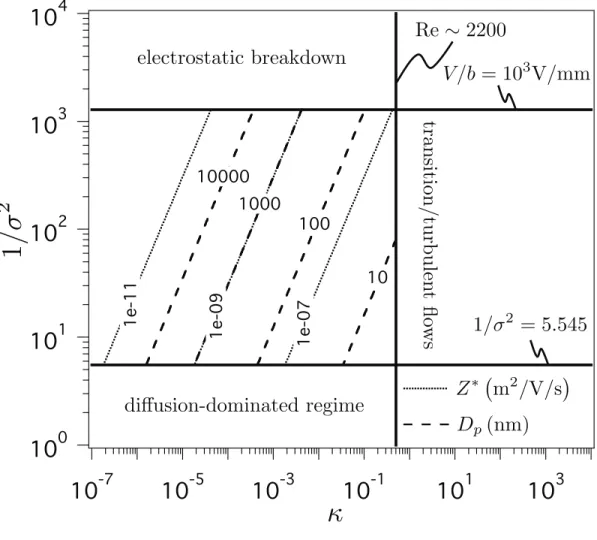
However, the range of mobilities that can be probed in a given instrument at fixed flow rates while maintaining high resolving power becomes extremely small due to the convergence of the diffusive regime with the electrostatic breakdown limit. More dramatic improvements have been predicted for a DMA that includes a component of the electric field parallel to the direction of the sheath flow [15].
Generalizing DMA performance with insights from a minimal model . 9
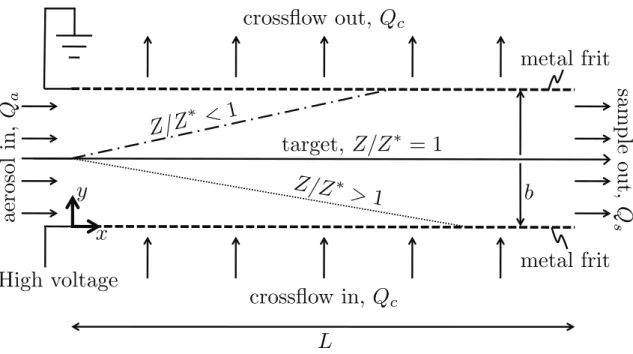
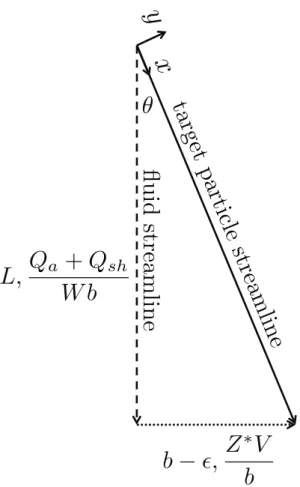
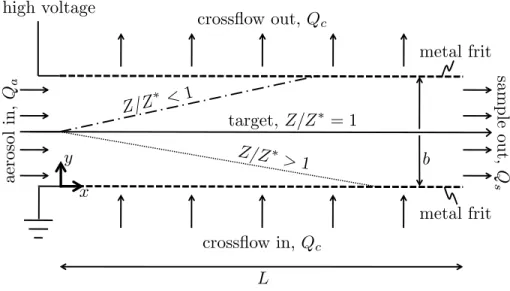
The angle of the target particle streamlines relative to the angle of the fluid streamlines, θ, is not shown because the high aspect ratio assumption implies that we are in the small angle limit. Note that the stipulation that only high aspect ratio units are considered was used to justify the assumption that transport due to the electric field is negligibly small in the direction of the target particle streamlines ˆx.
Comparing DMAs to OMACs and IGMAs
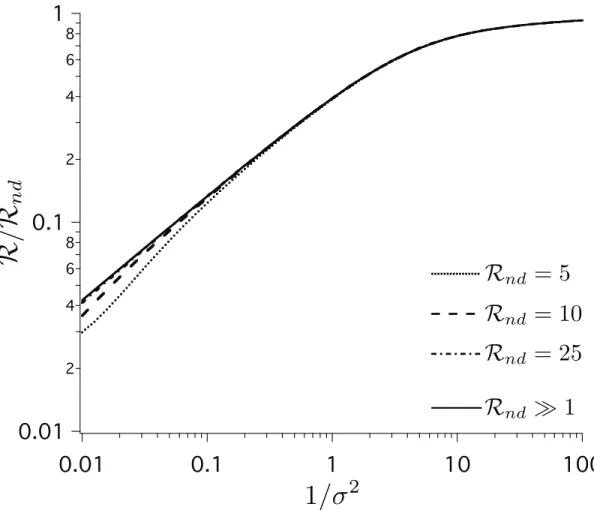
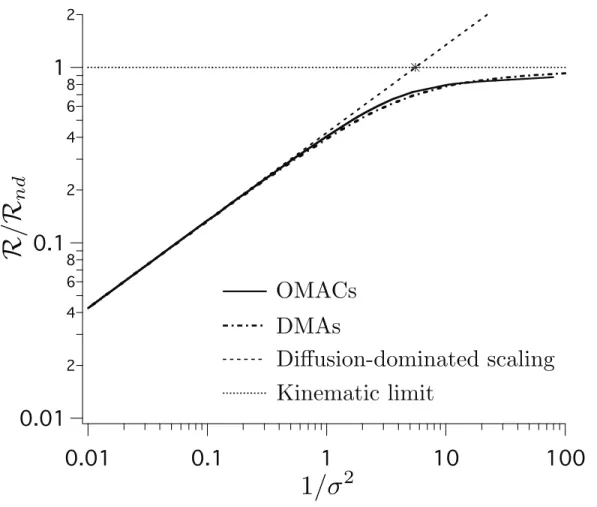
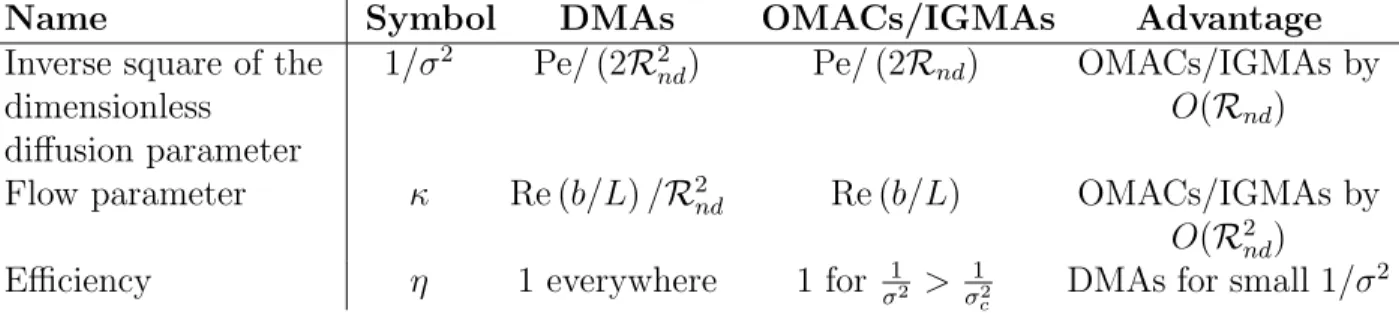
For DMAs, the target particle streamlines occupy only /b∼ R−1nd of the channel, so GzDM A/R2nd ∼1/σ2. Alternatively, if the kinematic resolution and maximum voltage are set, an OMAC or IGMA will have a dynamic range Rnd times that of the equivalent DMA.
Conclusions
The maximum achievable value of Re before the currents become unstable may be different for OMACs and IGMAs, depending on the details of the respective designs. While DMA will likely continue to play a critical role in aerosol measurements, particularly in terms of measurement speed, as fast response detectors become available, OMAC and IGMA have distinct advantages that should enable them to expand the ways in which mobility methods can be used in wider studies of the effect of aerosols on the climate and human health.
Figures
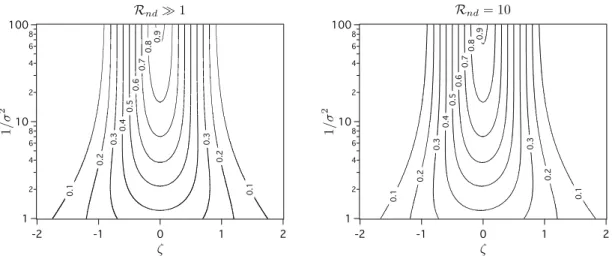
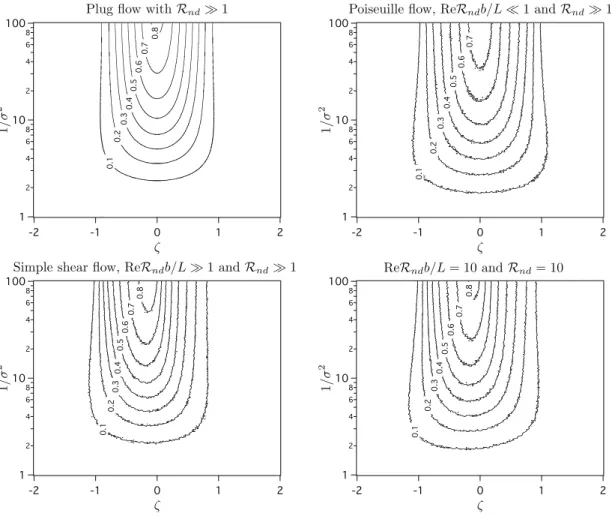
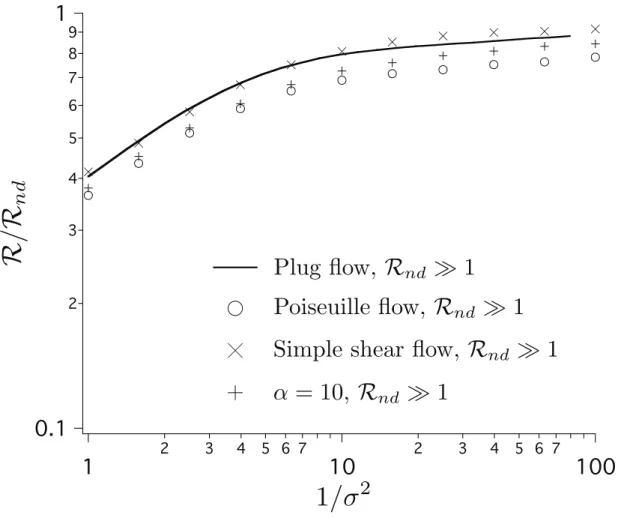
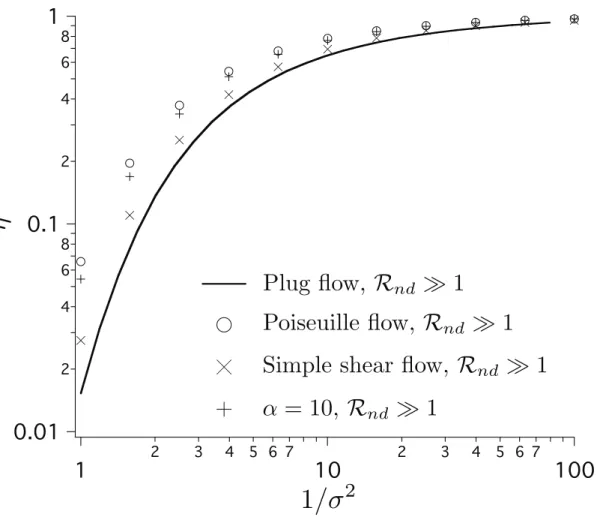
A planar OMAC with three particle streamlines originating at the center of the aerosol inlet to illustrate its behavior. Degradation of the resolving power for DMAs and OMACs as predicted by minimal plug flow models with Rnd 1.
Table
We present data from a planar opposed migration aerosol classifier (OMAC) that demonstrates classification of aerosol over a dynamic range of mobilities spanning three orders of magnitude.
Introduction
The lessons learned from the validation of the planar OMAC have motivated the design of a radial geometry version, which is currently under development in the Flagan Laboratory at Caltech. The excellent performance of the IGMA is due to favorable scalings of the governing dimensionless parameters compared to classical DMAs [29].
Theory
The migration P´eclet number Pe is the ratio of the characteristic time for diffusion to the time for the field to move the particle the gap distance in the absence of cross-flow. In contrast, the porous walls of the OMAC act as a particle sink along the entire sorting channel.
Experimental
The transfer efficiency can be defined as the ratio between the integral over the diffusive transfer function and that over the non-diffusive one, i.e. The side of the frit facing away from the spacer was partially covered with ParafilmR to improve the quality of the O-seal seals between the frits and the case.
Results and Discussion
SwagelokR tube fittings are used to connect the device to the balance of the fluid network, and O-rings are used to create seals. However, there is a notable exception between the frits and the dielectric spacer, where no O-rings are placed.
Conclusions
Figures
Target particles pass directly from the aerosol inlet to the sample outlet, with high and low mobility contaminants rejected by the sides. While three representative particle streamlines originating at the center of the aerosol inlet are shown, it should be noted that particles are introduced uniformly across the entire cross-section of the inlet.
Introduction
In a comparison of several of the O(1 lpm) classifiers with O(5) resolution, which have moderate flux and resolution relative to other instruments, the O(1) aspect ratio nano radial differential mobility analyzer ( nano -RDMA; [13]) was shown. The details of the CLOUD room and an overview of the results of the Autumn 2010 campaign are presented elsewhere [40].
Observations at CLOUD
The intensity of the pion beam, which is proportional to the number of ion pairs generated in the chamber, is measured by a plastic scintillator hodoscope. The pion spills from the PS, which are essential for simulating the higher altitude conditions and motivated the location of the CLOUD project at CERN, led to unexpected instrumentation challenges for measuring the 1−10 nm size distribution.
Discussion
In classification, however, spikes in the number of CPCs due to pion beam spillage can have a very detrimental effect, especially in the 1–10 nm size range, where transport losses are greatest (and therefore signal strength is weakest). 3.3, the use of detectors such as UMN-CPC, which by design discards 3–17% of the input signal in the laminar first stage, is suboptimal if the goal is to classify an unknown size distribution at even relatively low resolution. , as the signal can be of the same order of magnitude or even smaller than that of the CPC count.
Conclusions
For land and sea level studies, laboratory validation of the instruments would generally be sufficient to ensure that ion pair production within the detector due to galactic cosmic ray (GCR) decay is not a problem. For the classifier, this means removing any dielectric from the aerosol flow path, a culprit for most nano-CN losses due to adverse field and parasitic surface charge accumulation that can then act to deflect the nano-CN in deposit. on a wall.
Figures
It is likely that ion pairs generated upstream of the first stage condenser share a fate similar to that of the positive ion shown here, since as gas ions or clusters they have large diffusion coefficients and rapidly deposit on tube walls. While care should be taken to minimize transport losses from the chamber to the instrument, it should be taken into account that the vast majority of losses in the system occur when the nano-CN from the first (DEG) phase laminar CPC transport and scabbard streams are discarded.
Introduction
This instrument takes advantage of the fact that the diffusion coefficient of the working fluid (water) is greater than the thermal diffusivity of the gas. This was achieved by using a low volatility, high surface tension working fluid to activate sub-2 nm particles without inducing homogeneous nucleation of the vapor.
Evaluation of candidate working fluids for 180 K
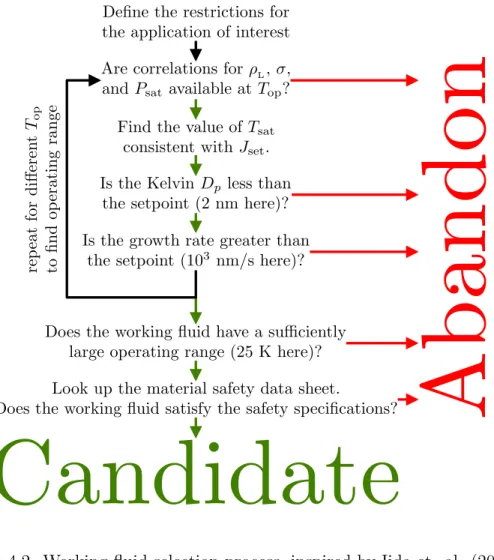
The corresponding physical data for 4899 candidate working fluids from [46] were used to screen the candidate working fluids, according to the algorithm that is sketched in Fig. Thus, the set of candidate working fluids can be further restricted by considering only those that have a maximum operating temperature of 205 K or higher.
Transport considerations in laminar-flow CPC designs
Plug flow analysis
One such metric is the value of the centerline saturation ratio at the output of the control volume. 5%, (4.11) validating the approximations of the completely transport-neglecting model for the isothermal choice of the CPC working fluid.
Poiseuille flow analysis
For the optimum steam operating conditions of /R = 0.21 and Gz = 58, less than 0.5% of the aerosol would be lost to diffusion on the walls even if none of them were activated. With the optimum values of /R = 0.1 and Gz = 35 determined for Poiseuille flow, it is worth considering some typical values of the relevant dimensions and operating conditions of an isothermal UCPC to ensure that they appear reasonable.
Discussion
The real need for the next generation of detectors are fast-response devices that count all the particles that enter them and maximize the signal-to-noise ratio. Regardless of the details of detector design, experimental validation of working fluid performance is essential.
Conclusions
For the isothermal UCPC case, the maximum achievable signal-to-noise value was proportional to the cross-sectional area of the capillary relative to the area of the supersaturated jacket gas flow tube, subject to a minimum allowable centerline saturation ratio at the outlet of 80% inlet supersaturation. These dimensionless group values are shown to be consistent with a device of physical size and work flow that are within reason.
Figures
Minimum and range of operating temperature for working fluids theoretically capable of activating particles with a Kelvin Dp <2 nm, with emphasis on those suitable for 180 K. Centerline outlet saturation ratio S[0, L] vs. inlet for an isothermal laminar-flow CPC as a function of the Graetz number Gz and the dimensionless extent of the aerosol capillary/R for a minimal plug flow model.
Table
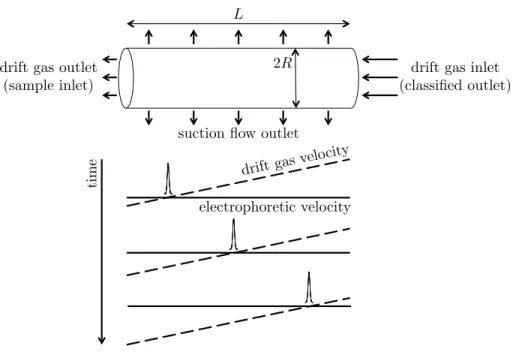
A longitudinal gradient in gas velocity is counteracted by electrophoretic displacement, leading to the creation of regions of stable stagnation for ions of different mobilities. While many ion mobility spectrometers suffer from resolution degradation due to limited sample bolus size, the gradient focusing method we present here overcomes this limitation by focusing ions as they traverse the sorting region.
Introduction
Most ion mobility spectrometers operate in the time domain where a small sample bolus is introduced at one end of the classifier channel. These differences prevent direct mapping of many of the most successful aqueous gradient focusing methods to the gas phase.
Description
With the tips self-sharpening in response to any perturbation in the classification region, instrument performance will be sensitive to input and output dispersion. Axial dispersion, although highly undesirable at the exit, can be tolerated to some extent with sample insertion due to downstream focusing in the classification region.
Figures
The propellant velocity profile for a representative set of operating conditions for a velocity gradient focusing IMS instrument, found from solving the Navier-Stokes equations using a finite element scheme in COMSOL. The boundary conditions used here were a uniform velocity of 1 m/s at the propellant inlet (classified outlet), a suction velocity atr =R of 0.05 m/s, an isobaric boundary condition at the propellant outlet (sample inlet ), and a symmetry condition at the midline.
Abstract
Introduction
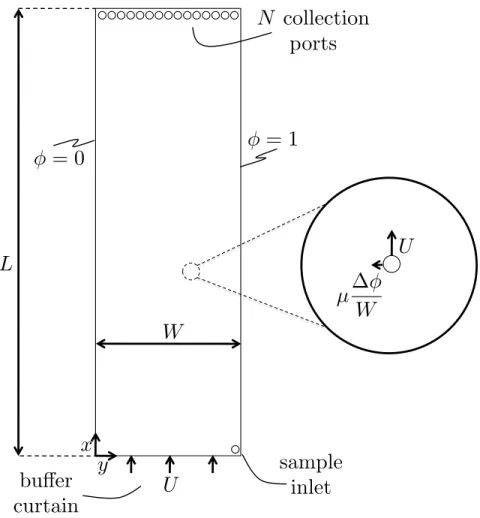
In the aerosol characterization community, a key objective is to achieve high resolution continuous separations from intrinsically diluted samples. The OMAC inspires a scalable method freed from the mindset of maximizing fractions by purifying a single fraction with high resolution and high throughput in the dilute limit.
Theory and simulation
In the kinematic limit, particles with mobility in the range −R−1nd <1−µ/µ∗ < R−1nd are admitted, which can be adjusted to an arbitrarily small window for Rnd 1. The theoretical efficiency was determined by solving the equation. 6.2) using separation of variables and integration to find the average concentration at the outlet. The effect of Poiseuille flow in the thin dimension can be quite dramatic, especially if the potential drop is across the width.
Discussion
In the ballistic limit, the fraction with the highest resolution has an electrophoretic velocity that very closely compensates for the opposing flow velocity over most of the channel height. The resolving power is proportional to the square root of the plate number, a metric commonly used in chromatography.
Conclusions
CODE's promise in thin-gap mode for scalable separation of microparticles (bacteria, cells, etc.) with high resolution is indeed one of the most exciting prospects for CODE. The separation of small particles with the thin-gap mode leads to challenges arising from the heat removal, which is several orders of magnitude greater than that for the width mode.
Figures
Giapis, “Radial differential mobility analyzer for one nanometer particle classification”, Aerosol Science and Technology, vol. Flagan, “An Asymptotic Analysis of Different Electric Mobility Classifications,” Aerosol Science and Technology, vol.