December 2023
COFFEE REPORT
AND OUTLOOK
I Executive Summary
• World coffee production increased by 0.1% to 168.2 million bags in coffee year 2022/23.
The stagnant growth rate belies the tremendous changes at the regional level, with the coffee world neatly split between the expanding Americas and the shrinking rest of the world.
• Asia & Oceania and Africa’s 4.7% and 7.2% decreases in production to 49.84 million bags and 17.9 million bags, respectively, can be attributed to adverse weather conditions negatively affecting key producers in the regions, particularly Vietnam, Côte d'Ivoire and Uganda. The magnitude of the fall in outputs of the two regions was entirely mitigated by the Americas, especially by South America’s 4.8% increase, which in turn was driven mainly by the biennial production-affected 8.4% increase in Brazil. The combined output of the Americas was 100.5 million bags.
• The Americas versus the rest of the world split was also reflected in the production split between the Arabicas and Robustas, with the former’s output increasing by 1.8% to 94.0 million bags as compared with the 2.0% decrease of the latter to 74.2 million bags.
• Looking ahead, the output for coffee year 2023/24 is expected to increase by 5.8% to 178.0 million bags, with the Arabicas’ output rising to 102.2 million bags and the Robustas’ increasing to 75.8 million bags.
• The biennial production effect will play a large role in the outlook, especially for Brazil and the Arabicas, as the impact of the July 2021 frost continues to be resolved. Coffee year 2023/24 is anticipated to be an exceptional off-biennial year, feeling more like a good on-biennial following an average on-biennial year. Adverse weather conditions, first noted in 2022 and continuing into 2023, will have a negative impact on the outlook for coffee year 2023/24. The anticipated El Niño phenomenon is set to dampen the outlook in Asia, especially for origins like Indonesia. Meanwhile, Vietnam is expected to benefit from the drier/hotter weather as irrigation mitigates the reduced precipitation.
• The world coffee industry is continuing to resolve through the issues brought about by the COVID-19 pandemic, with the consumption trend following an established patten in response to an external shock. The expectation for coffee year 2022/23 was for a smaller positive growth rate; however, world coffee consumption actually recorded a decrease of 2.0% to 173.1 million bags.
• Consumption in coffee year 2022/23 did not faithfully follow the established pattern due to the impact of the high cost of living, falling disposable incomes and a long stocks drawdown. Despite coffee being relatively inelastic, the challenging global economic environment would have had a negative impact on its consumption. The world inflation rate was at its highest in 2021 at 9.4%, while the average benchmark interest rate averaged 4.9% at the end of September 2023 in the European Union, UK and USA, the highest level since an average of 5.8% in 2000. At the same time, there was a large drawdown of stocks with combined stocks reported by the European Coffee Federation and those held at the Intercontinental Exchange’s warehouses in the USA fell by 4.8 million bags from 14.5 million to 9.8 million. This drawdown would have reduced the
need for purchases on the international market, seemingly reflected as lower and anomalous global consumption rates for coffee year 2022/23.
• The world coffee consumption outlook for coffee year 2023/24 is broadly framed by the assumption that the global economy will continue to grow at above 3.0%, and that the industry will respond to the large drawdown of stocks, which will be positively reflected in apparent consumption. As a result, world coffee consumption is expected to grow by 2.2% to 177.0 million bags, with non-producing countries making the biggest contribution to the overall increase. Coffee consumption in this group of countries should expand by 2.1%.
• As a result, the world coffee market is expected to run a surplus of 1.0 million bags in coffee year 2023/24.
Table I: Summary of the World Coffee Market
Graph I: Summary of the World Coffee Market – Million 60-Kg Bags 2018/19 2019/20 2020/21 2021/22 2022/23 2023/24 Production 169.8 168.4 170.8 168.0 168.2 178.0 Consumption 171.2 168.6 169.9 176.6 173.1 177.0
Balance -1.3 -0.2 0.9 -8.6 -4.9 1.0
Production 5.9% -0.9% 1.4% -1.7% 0.1% 5.8%
Consumption 3.3% -1.5% 0.8% 4.0% -2.0% 2.2%
Million 60-Kg Bags
Growth Rates, Year-on-Year
-10.0 -8.0 -6.0 -4.0 -2.0 0.0 2.0
160 162 164 166 168 170 172 174 176 178 180
2018/19 2019/20 2020/21 2021/22 2022/23 2023/24
Balalnce, Million 60-kg Bags
Production & Conmsumption, Million 60-kg Bags
ICO - Summary
Balance Production Consumption
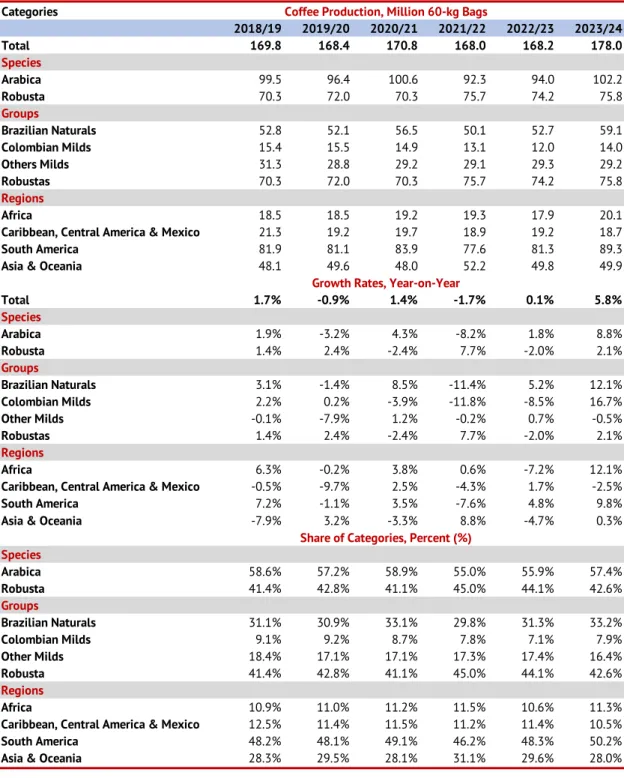
Table II: Summary of World Coffee Production
Categories
2018/19 2019/20 2020/21 2021/22 2022/23 2023/24
Total 169.8 168.4 170.8 168.0 168.2 178.0
Species
Arabica 99.5 96.4 100.6 92.3 94.0 102.2
Robusta 70.3 72.0 70.3 75.7 74.2 75.8
Groups
Brazilian Naturals 52.8 52.1 56.5 50.1 52.7 59.1
Colombian Milds 15.4 15.5 14.9 13.1 12.0 14.0
Others Milds 31.3 28.8 29.2 29.1 29.3 29.2
Robustas 70.3 72.0 70.3 75.7 74.2 75.8
Regions
Africa 18.5 18.5 19.2 19.3 17.9 20.1
Caribbean, Central America & Mexico 21.3 19.2 19.7 18.9 19.2 18.7
South America 81.9 81.1 83.9 77.6 81.3 89.3
Asia & Oceania 48.1 49.6 48.0 52.2 49.8 49.9
Total 1.7% -0.9% 1.4% -1.7% 0.1% 5.8%
Species
Arabica 1.9% -3.2% 4.3% -8.2% 1.8% 8.8%
Robusta 1.4% 2.4% -2.4% 7.7% -2.0% 2.1%
Groups
Brazilian Naturals 3.1% -1.4% 8.5% -11.4% 5.2% 12.1%
Colombian Milds 2.2% 0.2% -3.9% -11.8% -8.5% 16.7%
Other Milds -0.1% -7.9% 1.2% -0.2% 0.7% -0.5%
Robustas 1.4% 2.4% -2.4% 7.7% -2.0% 2.1%
Regions
Africa 6.3% -0.2% 3.8% 0.6% -7.2% 12.1%
Caribbean, Central America & Mexico -0.5% -9.7% 2.5% -4.3% 1.7% -2.5%
South America 7.2% -1.1% 3.5% -7.6% 4.8% 9.8%
Asia & Oceania -7.9% 3.2% -3.3% 8.8% -4.7% 0.3%
Species
Arabica 58.6% 57.2% 58.9% 55.0% 55.9% 57.4%
Robusta 41.4% 42.8% 41.1% 45.0% 44.1% 42.6%
Groups
Brazilian Naturals 31.1% 30.9% 33.1% 29.8% 31.3% 33.2%
Colombian Milds 9.1% 9.2% 8.7% 7.8% 7.1% 7.9%
Other Milds 18.4% 17.1% 17.1% 17.3% 17.4% 16.4%
Robusta 41.4% 42.8% 41.1% 45.0% 44.1% 42.6%
Regions
Africa 10.9% 11.0% 11.2% 11.5% 10.6% 11.3%
Caribbean, Central America & Mexico 12.5% 11.4% 11.5% 11.2% 11.4% 10.5%
South America 48.2% 48.1% 49.1% 46.2% 48.3% 50.2%
Asia & Oceania 28.3% 29.5% 28.1% 31.1% 29.6% 28.0%
Share of Categories, Percent (%) Coffee Production, Million 60-kg Bags
Growth Rates, Year-on-Year
Table III: Summary of World Coffee Consumption
2018 2019 2020 2021 2022 2023
Total 171.2 168.6 169.9 176.6 173.1 177.0
Producers 52.5 52.2 53.1 54.4 55.1 56.5
Non-Producers 118.6 116.4 116.8 122.2 118.1 120.5
Regions
Africa 11.9 12.1 13.0 12.9 12.2 12.5
Caribbean, Central America & Mexico 5.8 5.8 5.9 6.0 6.0 6.1
South America 26.3 26.0 26.4 27.0 27.5 28.0
North America 31.8 30.6 30.2 31.3 29.8 30.9
Asia & Pacific 39.9 40.1 42.2 44.2 44.5 45.7
Europe 55.5 54.0 52.2 55.2 53.1 53.7
2018 2019 2020 2021 2022 2023
Total 3.3% -1.5% 0.8% 4.0% -2.0% 2.2%
Producers 1.6% -0.6% 1.8% 2.4% 1.2% 2.6%
Non-Producers 4.0% -1.9% 0.3% 4.7% -3.4% 2.1%
Regions
Africa 1.7% 1.9% 7.4% -1.2% -5.4% 2.6%
Caribbean, Central America & Mexico 2.4% 0.4% 1.2% 1.5% 0.3% 2.3%
South America 1.2% -1.3% 1.5% 2.5% 2.0% 1.6%
North America 6.2% -3.8% -1.2% 3.6% -5.0% 3.8%
Asia & Pacific 2.5% 0.5% 5.2% 4.9% 0.6% 2.7%
Europe 3.6% -2.7% -3.2% 5.7% -3.7% 1.1%
2018 2019 2020 2021 2022 2023
Producers 30.7% 31.0% 31.3% 30.8% 31.8% 31.9%
Non-Producers 69.3% 69.0% 68.7% 69.2% 68.2% 68.1%
Regions
Africa 7.0% 7.2% 7.7% 7.3% 7.0% 7.1%
Caribbean, Central America & Mexico 3.4% 3.5% 3.5% 3.4% 3.5% 3.5%
South America 15.4% 15.4% 15.5% 15.3% 15.9% 15.8%
North America 18.6% 18.1% 17.8% 17.7% 17.2% 17.5%
Asia & Pacific 23.3% 23.8% 24.8% 25.0% 25.7% 25.8%
Europe 32.4% 32.0% 30.7% 31.2% 30.7% 30.4%
Growth Rates, Year-on-Year
Share of Categories, Percent (%) Coffee Consumption, Million 60-Kg Bags
1 World Economic Outlook1
• Coffee year 2022/23 witnessed further recovery from the COVID-19 pandemic, despite the increasing pressure that high inflation and interest rates applied on the end consumer. Indeed, at the time of writing, central banks continue to maintain a tough stance on inflation and are avoiding easing monetary policies prematurely. However, in the longer term, as price stability remains a priority and inflation accelerations start to slow down, cutting the policy rate will emerge as an acceptable school of thought. The International Monetary Fund’s (IMF) World Economic Outlook witnessed a 0.5 percentage point slowdown from 2022 to 2023, with the Eurozone particularly badly hit, losing 2.6 percentage points versus the previous year. A negative GDP percentage change reflects a country’s reduced ability to produce more goods and services, indicating that an economy is slowing down.
Graph 1: World Economic Growth Rates
1.1 Inflation and interest rates
• For 2021, world inflation reached 8.7%, the highest level since 1996 when the inflation rate hit 9.4%. Although the price level did fall in 2022, it dropped only to 6.9%, the second highest level for 27 years. The response of central banks across the world to the high inflation was to carry out a sustained policy of monetary tightening, increasing the nominal interest rates from zero at the end of 2021 to an average 4.9% by the end of September 2023 in the European Union, UK and USA. This is the highest average reached since 5.8% in 2000. Thus, consumers came under twin pressures: high costs and falling disposable income. In December 2021, the average annual mortgage payment for a terraced house in the UK was £7,992 while the average salary for 2021 was £31,356. The following year, mortgage payments rose to £12,756 and salaries to £32,864. As a result, the average disposable income of a household in the UK shrank by 13.9% from increased mortgage payments alone.
1All economic data refer to and are derived from data taken from the October 2023 issue of the World Economic Outlook of the International Monetary Fund.
-4.0 -2.0 0.0 2.0 4.0 6.0 8.0
2015 2016 2017 2018 2019 2020 2021 2022 2023 2024
Percent Change, %
Graph 2: Inflation Rates – World and Economies, Percent Change
Graph 3: Interest Rates – United States, United Kingdom and European Union
1.2 Economic Outlook- Regions 1.2.1 Economics – Africa
• Growth in Africa slowed from 4 to 3.3% in 2023; however, a sentiment of cautious optimism prevails across the continent. Indeed, governments in an array of African nations are tackling long-standing macroeconomic imbalances. This can be witnessed by narrowing fiscal deficits, helping to stabilise public debt. This implies that, despite potentially slower international demand, increasing repayment costs and double-digit inflation eroding household incomes in over one third of countries, coffee consumption in Africa will continue to grow.
1.2.2 Economics – Europe
• European GDP growth rates remained stable and provided a more positive outlook than the previous year. Consumer confidence in coffee consumption is back up, as a return to the office becomes commonplace. Indeed, as the cost-of-living crisis continues to affect
0.0 2.0 4.0 6.0 8.0 10.0 12.0
2015 2016 2017 2018 2019 2020 2021 2022 2023 2024
YoY % change, per annum
Source: IMF
World Advanced economies Emerging market and developing economies
0.0 1.0 2.0 3.0 4.0 5.0 6.0
%, per annum
Sources: IMF, ECB, BoE
United States United Kingdom European Union
a wide portion of the population, retail coffee companies are adopting new strategies to entice customers into their stores. The advent of new monthly subscription-based pricing models, offering the end consumer the ability to drink more coffee for a fixed price, may contribute to a growth in consumption. Coupled with declining energy prices, a strong labour market with record-low unemployment rates, and a slight decrease in interest rates, European citizens are facing a shift in societal habits, but nonetheless continuing to consume coffee. The slowdown in the provision of borrowed money from banks in the economy suggests that the intended effects of recent monetary policy are trickling out in the European economy.
1.2.3 Economics - Caribbean, Central America & Mexico
• The total GDP for the Caribbean, Central America and Mexico amounts to 2.52 trillion USD in 2023, up from 2.11 trillion the year before. This 19% increase for the region provides a solid basis for a positive economic outlook. Inflation in Mexico, the largest economy in the group, reached 5.5% in 2023, slightly above the average of its peer nations. Climate-related shocks and outward migration continue to pose a threat to economic stability over the short to medium term. The impacts of the El Niño phenomenon may impede economic activity through flash floods or extended periods of drought. As fiscal policy focuses on increased resilience against future shocks, whilst ensuring economic sustainability by reducing public debt and strengthening public finances, the Caribbean, Central America and Mexico’s priorities of reinforcing social cohesion and protections whilst tackling insecurity remain essential in ensuring prosperous growth.
1.2.4 Economic – North America
• North America’s economic output remains strong with 2.1% real GDP growth from 2022 to 2023 as the economy witnesses only a 4.1% rate of inflation. On the other hand, Canada, an important consumer of coffee per capita, saw its GDP rise by 3.4%, noticeably more than the US, whilst maintaining the inflation rate at a low 3.6%. Within the wider economic context for the year 2023, the US and Canada have posted strong growth results, thereby maintaining a positive growth outlook regarding coffee consumption.
With 72% of adults reporting that they drink coffee (National Coffee Association (NCA), 2023), the outlook of the largest coffee consuming country by volume remains positive.
One of the world’s leading monetary institutions, the US Federal Reserve has been raising baseline interest rates, directly affecting the availability of cheap, easily accessible credit.
One of the direct implications of this policy agenda is that by slowing down the economy, inflation and consumer spending may diminish. However, coffee remains an inelastic product, so effects on consumption may be limited.
1.2.5 Economics – South America
• South America has successfully steered monetary policy to drop inflation down from 7.8%
to 5% in 2023 (excluding Argentina and Venezuela). However, reducing inflation has hampered economic growth. This comes in addition to a weakening international environment, where demand for key exports and services reduced, and a slowdown in growth from the main trading partners. However, there are limits to national economic policies as external factors such as commodity price volatility, intensification of
geopolitical tensions and turbulence in global financial markets may hamper a country’s strategic macro-economic planning.
1.2.6 Economics – Asia & Oceania
• The Asia & Oceania region is expected to grow 4.6% in 2023, highlighting its ability to decouple itself from western economic situations to some extent. As coffee consumption per capita remains in its infancy across most of the continent, there remains strong potential to reach the consumption levels seen in traditional developed importing economies. Meanwhile, headline inflation has declined from post pandemic highs and global commodity prices have receded, alleviating financial pressures on the end consumer. Nonetheless, although Asia remains ahead of other continents in terms of disinflation, a risk remains from unfavourable exchange rate variations. In this sense, whilst an episode of depreciation within the basket of Asian currencies took place in 2023, it is still limited compared to periods of US dollar strengthening. Threats to inflation also include higher oil prices as industry input costs could rise, in turn affecting the end consumer. The medium-term effects of a restrictive monetary policy will help steer inflation back on target. Additionally, as government policies intended to reduce deficits and the accumulation of debt address the underlying vulnerabilities in the financial sector, it appears that Asia & Oceania will be the drivers of tomorrow’s consumption.
2 Coffee Production
2.1 Executive Summary -Production
• World coffee production increased by 0.1% to 168.2 million bags in coffee year 2022/23.
The stagnant growth rate belies the tremendous changes at the regional level, with the coffee world neatly split between the expanding Americas and the shrinking rest of the world.
• Asia & Oceania and Africa’s 4.7% and 7.2% decreases to 49.8 million bags and 17.9 million bags, respectively, can be attributed to adverse weather conditions which negatively affected key producers in the regions, particularly Vietnam, Côte d'Ivoire and Uganda.
• The magnitude of the fall in outputs of the two regions was entirely mitigated by the Americas, especially by South America’s 4.8% increase, which in turn was driven mainly by the biennial production-affected 8.4% increase in Brazil. The combined output of the Americas was 100.5 million bags.
• The Americas versus the rest of the world split was also reflected in the production split between the Arabicas and Robustas, with the former’s output increasing by 1.8% to 94.0 million bags as compared with the 2.0% decrease of the latter to 74.2 million bags.
• Looking ahead, the output for coffee year 2023/24 is expected to increase by 5.8% to 178.0 million bags, with the Arabicas’ output rising to 102.2 million bags and the Robustas’ increasing to 75.8 million bags.
• The biennial production effect will play a large role in the outlook, especially for Brazil and the Arabicas, as the impact of the July 2021 frost continues to be resolved. Coffee year 2023/24 is anticipated to be an exceptional off-biennial year, feeling more like a good on-biennial following an average on-biennial year.
• Adverse weather conditions, first noted in coffee year 2022/23 and continuing into coffee year 2023/24, will have a negative impact on the outlook for coffee year 2023/24. The anticipated El Niño phenomenon is set to dampen the outlook in Asia, especially Indonesia. Meanwhile, Vietnam is expected to benefit from the drier/hotter weather as irrigation mitigates the reduced precipitation.
Table 4: Summary of World Coffee Production, Growth Rates and Shares
Categories
2018/19 2019/20 2020/21 2021/22 2022/23 2023/24
Total 169.8 168.4 170.8 168.0 168.2 178.0
Species
Arabica 99.5 96.4 100.6 92.3 94.0 102.2
Robusta 70.3 72.0 70.3 75.7 74.2 75.8
Groups
Brazilian Naturals 52.8 52.1 56.5 50.1 52.7 59.1
Colombian Milds 15.4 15.5 14.9 13.1 12.0 14.0
Others Milds 31.3 28.8 29.2 29.1 29.3 29.2
Robustas 70.3 72.0 70.3 75.7 74.2 75.8
Regions
Africa 18.5 18.5 19.2 19.3 17.9 20.1
Caribbean, Central America & Mexico 21.3 19.2 19.7 18.9 19.2 18.7
South America 81.9 81.1 83.9 77.6 81.3 89.3
Asia & Oceania 48.1 49.6 48.0 52.2 49.8 49.9
Total 1.7% -0.9% 1.4% -1.7% 0.1% 5.8%
Species
Arabica 1.9% -3.2% 4.3% -8.2% 1.8% 8.8%
Robusta 1.4% 2.4% -2.4% 7.7% -2.0% 2.1%
Groups
Brazilian Naturals 3.1% -1.4% 8.5% -11.4% 5.2% 12.1%
Colombian Milds 2.2% 0.2% -3.9% -11.8% -8.5% 16.7%
Other Milds -0.1% -7.9% 1.2% -0.2% 0.7% -0.5%
Robustas 1.4% 2.4% -2.4% 7.7% -2.0% 2.1%
Regions
Africa 6.3% -0.2% 3.8% 0.6% -7.2% 12.1%
Caribbean, Central America & Mexico -0.5% -9.7% 2.5% -4.3% 1.7% -2.5%
South America 7.2% -1.1% 3.5% -7.6% 4.8% 9.8%
Asia & Oceania -7.9% 3.2% -3.3% 8.8% -4.7% 0.3%
Species
Arabica 58.6% 57.2% 58.9% 55.0% 55.9% 57.4%
Robusta 41.4% 42.8% 41.1% 45.0% 44.1% 42.6%
Groups
Brazilian Naturals 31.1% 30.9% 33.1% 29.8% 31.3% 33.2%
Colombian Milds 9.1% 9.2% 8.7% 7.8% 7.1% 7.9%
Other Milds 18.4% 17.1% 17.1% 17.3% 17.4% 16.4%
Robusta 41.4% 42.8% 41.1% 45.0% 44.1% 42.6%
Regions
Africa 10.9% 11.0% 11.2% 11.5% 10.6% 11.3%
Caribbean, Central America & Mexico 12.5% 11.4% 11.5% 11.2% 11.4% 10.5%
South America 48.2% 48.1% 49.1% 46.2% 48.3% 50.2%
Asia & Oceania 28.3% 29.5% 28.1% 31.1% 29.6% 28.0%
Share of Categories, Percent (%) Coffee Production, Million 60-kg Bags
Growth Rates, Year-on-Year
2.2 Report of Coffee Year 2022/23 - Production 2.2.1 Total Production – World and Regions
World coffee production increased by 0.1% to 168.2 million bags in coffee year 2022/23, up from 168.0 million bags in the previous coffee year. The increase in world production was mainly as a result of:
• Asia & Oceania and Africa’s 4.7% and 7.2% decreases to 49.8 million bags and 17.9 million bags, respectively, due to adverse weather conditions negatively affecting key producers in the regions, particularly Vietnam, Côte d'Ivoire and Uganda.
• The magnitude of the fall in outputs of the two regions being almost entirely mitigated by the Americas, especially by South America’s 4.8% increase, which in turn was driven mainly by the biennial production-affected 8.4% increase in Brazil. The combined output of the Americas was 100.5 million bags.
• The Americas versus the rest of the world split also being reflected in the production split between the Arabicas and Robustas, with the former’s output increasing by 1.8% to 94.0 million bags as compared with the 2.0% decrease of the latter to 74.2 million bags.
Graph 4: Production of Coffee – Regions, Million 60-kg Bags & Growth Rates
2.2.2 Total Production - Regional Shares and Species
The impacts of the Americas versus the rest of the world and the related Arabica and Robusta dynamics were clearly visible:
• South America’s share of the world coffee production increased to 48.3% in coffee year 2022/23 from 46.2% in coffee year 2021/22, while the Caribbean/Central America
& Mexico’s share rose by 0.2 percentage points to 11.4%.
• Asia & Oceania’s share fell by 1.5 percentage points to 29.6%, while Africa’s share dropped to 10.6%.
• The world market share of Arabica coffee increased by 1.3 percentage points to 55.9%.
19.3 18.9
77.6
52.2
17.9 19.2
81.3
49.8
0 10 20 30 40 50 60 70 80 90
Africa Caribbean, Central
America & Mexico South America Asia & Oceania
Million 60-kg Bags
2021/22 2022/23
-7.2%
-4.7%
4.8%
1.7%
Graph 5: Production of Coffee – Regions, Percent Shares
Graph 6: Production of Arabica/Robusta – Regions, Million 60-kg Bag, Percent Shares
2.3 Total Production – Regions and Countries 2.3.1 Total Production – Africa
Africa’s coffee production decreased by 7.2% in coffee year 2022/23 to 17.9 million bags, from 19.3 million bags in the previous coffee year, with the market share of the world’s output falling slightly to 10.6% from 11.5%.
• Uganda suffered a 6.8% fall in coffee year 2022/23 to 5.6 million bags from 6.0 million bags in coffee year 2021/22. This is the second consecutive year of falling production, decreasing for the same reason it did in coffee year 2021/22: continuation of drought.
First reported as early February 2022, this drought affected most coffee-growing regions,
11.5%
11.2%
46.2%
31.1%
10.6%
11.4%
48.3%
29.6%
Asia &
Oceania
South America Africa
Caribbean, Central America &
Mexico Inner Ring - 2021/22
Outer Ring - 2022/23
10.9
18.7
57.4
6.9
94.0 92.3
7.0
0.4
23.9
42.9
74.2 75.7
0%
10%
20%
30%
40%
50%
60%
70%
80%
90%
100%
Africa Central America &
Mexico
South America Asia & Oceania World
2022/23 World 2021/22
'000 60-kg Bags
Arabica Robusta
leading to a lower and shorter harvest in central and eastern parts of Uganda, hence lower output. At the beginning of coffee year 2022/23, the coffee authority of Uganda was optimistic about an increased harvest for the following season. The origin has previously stated its goal of reaching 20 million bags by 2030 and hard work has been carried out to rejuvenate old trees through stumping, replanting high-yielding varieties and increasing the use of organic fertilisers. However, all these efforts were undone by nature for at least one year.
• At the time of the 2022/23 harvest, coffee farmers in Ethiopia were enthusiastic about potential volume, citing good weather throughout many of the coffee-growing areas.
However, the volume of rain was deemed to have been unsatisfactory in May and June during coffee year 2022/23. Moreover, Ethiopia carried out extensive rejuvenation in the four years to 2020, covering 400,000 hectares and with trees first bearing fruit in coffee year 2021/22. As a result, the country’s production continues to rise, having reached a new record level of 7.73 million bags in coffee year 2022/23, a 1.0% increase versus an output of 7.65 million bags in coffee year 2021/22.
• Côte d'Ivoire suffered the largest fall in Africa, with production decreasing by 64.7% to 0.6 million bags from 1.8 million bags in coffee year 2021/22. The substantial drop in production is the coffee trees’ reaction to the prior year’s very large harvest, which was up 69.0%, and due to the impact of drought in the country.
Graph 7: Coffee Production of Africa, ‘000 60-kg Bags
Graph 8: Coffee Production of Africa, Growth Rates, Coffee Year 2022/23 Vs Coffee Year 202122
1,0000 2,000 3,000 4,000 5,000 6,000 7,000 8,000 9,000
'000 60-kg Bags
2021/22 2022/23
1.0%
-6.8%
4.1%
-4.4%
1.0%
9.3%
0.0%
17.6%
13.2%
-5.7%
3.2%
-25.0%
-20.0%
-15.0%
-10.0%10.0%15.0%20.0%-5.0%0.0%5.0%
Percent Change, %
2.3.2 Total Production - Caribbean, Central America & Mexico
The Caribbean, Central America and Mexico’s coffee production increased by 1.7% in coffee year 2022/23 to 19.2 million bags, from 18.9 million bags in coffee year 2021/22:
• Honduras is the largest producer in the region and saw its production increase by 14.7%
to 5.7 million bags from 5.0 million bags in coffee year 2021/22. The jump in production came in the face of labour shortages, high fertiliser costs, heavy rain and reports of a resurgence of coffee leaf rust disease. In regard to labour shortages, according to the Honduran Coffee Exporters’ Association (ADECAFEH), at least 350,000 pickers are required to harvest coffee across the nation, with approximately 50,000 workers coming in from neighbouring countries. Much of the increase in coffee year 2022/23 is due to the biennial production effect, it appears, following the 19.2% decrease in output in coffee year 2021/22.
• Guatemala’s coffee production declined again in coffee year 2022/23, decreasing by 7.4%
following a 9.0% fall in coffee year 2021/22. The reduction in output came despite an increase in the area under coffee, reported as having expanded significantly to 302,000 hectares in 2019 from 275,576 hectares in 20182, with all other sources of information suggesting that this hectarage was maintained into coffee year 2022/23. Production is falling due to many of the same issues faced by the origin’s Central American neighbours, namely high labour costs, availability of labour and erratic weather.
• Nicaragua’s coffee output decreased by 0.7% in coffee year 2022/23 to 2.9 million bags, following a 7.6% jump in coffee year 2021/22, despite coffee year 2022/23 being an off- year. The country’s economic situation has also improved tremendously, with GDP increasing by 10.3% and 4.0% in 2021 and 2022, respectively, following an average 3.0%
fall in the three preceding years. This, in turn, would have improved good agricultural practices, mitigating some of the biennial production effect. However, the main reason for the shallow downturn is the first-time inclusion of Robusta production, which is assessed to have been 120,000 bags.
Graph 9: Coffee Production of Caribbean, Central America & Mexico, ‘000 60-kg Bags
2 Estadísticas Agropecuarias 2020 and 2021, Instituto Nacional de Estadística
0 1,000 2,000 3,000 4,000 5,000 6,000 7,000
'000 60-kg Bags
2021/22 2022/23
Graph 10: Coffee Production of Caribbean, Central America & Mexico, Growth Rates, Coffee Year 2022/23 Vs Coffee Year 2021/22
2.3.3 Total Production - South America
South America’s coffee production increased by 4.8% in coffee year 2022/23 to 81.3 million bags from 77.6 million bags in the previous year. The upturn is almost entirely due to Brazil:
• Brazil’s coffee industry was in its “on-year” of the biennial production cycle in coffee year 2022/23, with output increasing by 8.4% to 65.49 million bags, setting a new record and beating the previous highest production of 65.47 million bags seen in 2020.
However, for an “on-year”, this was a muted rate of expansion because Brazil’s coffee industry is still suffering from the impact of the July 2021 frost. At the time, the Brazilian government’s National Supply Company (CONAB), under the Ministry of Agriculture, Livestock and Food Supply, stated that 70% of all Brazilian coffee had already been harvested for coffee year 2021/22, and thus the impact of the frost was not felt until the following year: coffee year 2022/23.
• Colombia was beset with persistent unfavourable weather conditions throughout coffee year 2022/23, leading to a 9.1% decrease in output to 10.7 million bags. This was the third consecutive year of negative growth for Colombia, with the output level down to its lowest since 2012.
• Peru’s coffee production fell by 7.1% to 3.9 million bags in coffee year 2022/23 on the back of extremely heavy rains.
Graph 11: Coffee Production of South America, ‘000 60-kg Bags
14.7%
-5.5% -7.4%
-0.2%
13.0%
-12.5%
2.9% 3.7%
0.1% 5.0% 3.0%
0.0%
-15.0%
-10.0%
-5.0%
0.0%
5.0%
10.0%
15.0%
20.0%
Percent Change, %
0 10000 20000 30000 40000 50000 60000 70000
Brazil Colombia Peru Venezuela Ecuador Bolivia Paraguay Guyana
'000 60-kg Bags
2021/22 2022/23
Graph 12: Coffee Production of South America, Growth Rates, Coffee Year 2022/23 Vs Coffee Year 2021/22
2.3.4 Total Production - Asia & Oceania
Asia & Oceania’s coffee production decreased by 4.7% in coffee year 2022/23 to 49.8 million bags from 52.2 million bags the previous year:
• Vietnam is the second largest coffee producer in the world and the largest producer in Asia & Oceania. It produced 29.2 million bags in coffee year 2022/23, a 9.8% or 3.7 million bag decrease. The downturn comes after a bumper year in coffee year 2021/22 when the origin produced the second largest output on record, behind the 33.4 million produced in 2017. Prolonged rains in the major coffee-producing provinces of Dak Lak, Gia Lai and Kon Tum, lack of fertiliser usage and a shift towards more profitable crops such as durian and pepper were the main reasons for the fall in production.
• Indonesia is the second largest origin in Asia & Oceania behind Vietnam, and in coffee year 2022/23 it saw its production increase by 2.4% to 12.0 million bags. In the early part of coffee year 2022/23, the La Niña weather phenomenon was thought to have had a significant negative impact on output, with heavy rain reported during and after the flowering period. The increase in production in coffee year 2022/23 is due to the fact that the area under coffee expanded by net 71,000 hectares in 2018–22.
• Excess monsoon rains in Karnataka, the largest coffee-producing region in India, led the country’s Coffee Board to reduce its coffee output assessment by 10.5% to 5.9 million bags for coffee year 2022/23 from their earlier estimate of 6.6 million. However, 5.9 million bags represents a 2.9% expansion versus the output in coffee year 2021/22.
• Laos is an up-and-coming origin, having increased its coffee production three-folds in 2000–18, a period during which it overtook the Philippines, Thailand and Yemen to become the fifth largest coffee producer Asia & Oceania. In the previous issue of the CRO, the production trend was reported as being downward. This assessment was made based on the country’s export volume. However, its export data were subject to an upward revision for 2018–22, which consequently also meant an upwards revision of the production data. The latest assessment suggests that Laos’ coffee production was 0.8 million bags in coffee year 2022/23, up from 0.7 million bags in coffee year 2021/22.
8.4%
-9.1% -7.1%
0.0%
-1.8% -0.9%
0.0% 0.0%
-12.0%
-10.0%10.0%-8.0%-6.0%-4.0%-2.0%0.0%2.0%4.0%6.0%8.0%
Brazil Colombia Peru Venezuela Ecuador Bolivia Paraguay Guyana
Percent Change, %
Graph 13: Coffee Production of Asia & Oceania, ‘000 60-kg Bags
Graph 14: Coffee Production of Asia & Oceania, Growth Rates, Coffee Year 2022/23 Vs coffee year 2021/22
2.4 Arabica Coffee Production – Regions and Countries 2.4.1 Arabica Coffee Production – Regions
Arabica production increased by 1.8% in coffee year 2022/23, rising to 94.0 million bags from 92.3 million bags.
• South America, the largest regional producer of Arabica coffee, increased its output 2.6%
to 57.4 million bags. It is also the main region responsible for the 2.0% growth of Arabica coffee.
• The Arabicas’ share of the total coffee production increased in coffee year 2022/23 to 55.9% from 55.0%. Despite this year-on-year recovery, Arabica coffee production is still under a downward trend.
0 5000 10000 15000 20000 25000 30000 35000
'000 60-kg Bags
2021/22 2022/23
-9.8%
2.4% 2.9%
23.4%
12.9%
0.2% 5.3%
-7.2% -1.9%
3.6%
20.0%
-15.0%
-10.0%10.0%15.0%20.0%25.0%30.0%-5.0%0.0%5.0%
Percent Change, %
Graph 15: Production of Arabica – Regions, Million 60-kg Bags
Graph 16: Production of Arabica – Regions, Percent Shares
2.4.2 Arabica Coffee Production – Countries At the individual country level:
• Brazil’s Arabica production was in its “on-year” in coffee year 2022/23, and as a result saw its output jump by 7.3% to 41.8 million bags from 38.9 million bags the previous year. However, for an “on-year” this was a muted rate of expansion because Brazil’s coffee industry is still suffering from the impact of the July 2021 frost. At the time, the Brazilian government’s National Supply Company (CONAB), under the Ministry of Agriculture, Livestock and Food Supply, stated that 70% of all Brazilian coffee had already been harvested for coffee year 2021/22, and thus the impact of the frost was not felt until the following year: coffee year 2022/23.
10.8 18.5
55.9
10.9 18.7 7.0
57.4
0 6.9 10 20 30 40 50 60 70
Africa Caribbean, Central
America & Mexico South America Asia & Oceania
Millionn60-kg Bags
2021/22 2022/23
1.0% -1.4%
2.6%
1.2%
11.7%
20.1%
60.6%
7.6%
11.6%
19.9%
61.0%
7.4%
Asia &
Oceania
South America
Africa
Caribbean, Central America &
Mexico Inner Ring - 2021/22
Outer Ring - 2022/23
• Costa Rica and Honduras are two other origins making significant contributions to the overall growth of the Arabica output, with their production up by 13.0% and 14.7% in coffee year 2022/23. Much of the increase of both origins is due to the biennial production effect, as reflected in the 19.2% decrease in output in coffee year 2021/22 for Honduras and two consecutive years of negative growth for Costa Rica. In coffee year 2021/22, Costa Rica’s Arabica production fell below 1.4 million for the first time since 1985 when the country produced only 1.3 million bags; the recovery in coffee year 2022/23 does little to disguise the entrenched downward trend of the origin’s production, in place since the mid-1990s.
• Kenya is the third largest Arabica producer in Africa, and its output decreased by 4.6% to 0.73 million bags in coffee year 2022/23 from 0.76 million bags. This is the second consecutive year of negative growth for the origin, driven in part by drought for the past 24 months as well as coffee berry disease in the Central Highlands. .
• Vietnam is currently reaping the reward of a policy implemented ten years ago to increase the origin’s Arabica production, with aims to raise its production to 96,000 tonnes (1.6 million bags) by 2020 through the expansion of the northern and central Arabica area to 40,000 hectares over 2012–2020. In coffee year 2022/23, the Arabica production, however, fell 9.8% to 1.5 million bags from 1.6 million bags in coffee year 2021/22.
Prolonged rains in the major coffee-producing provinces of Dak Lak, Gia Lai and Kon Tum, lack of fertiliser usage and a shift towards more profitable crops such as durian and pepper were the main reasons for the fall in production.
• India’s Arabica production was up 5.3% in coffee year 2022/23 at 1.7 million bags, based on the 1.7% growth in area harvested.
Graph 17: Production of Arabica – Countries, ‘000 60-kg Bags
5,0000 10,000 15,000 20,000 25,000 30,000 35,000 40,000 45,000
'000 60-kg Bags
2021/22 2022/23
Graph 18 Production of Arabica – Countries, Growth Rates, Coffee Years 2022/23 Vs Coffee Year 2021/22
2.5 Robusta Coffee Production – Regions and Countries 2.5.1 Robusta Coffee Production – Regions
In coffee year 2022/23, 74.2 million bags of Robusta were produced globally, a 2.0% fall. The overall result was due to a strange conflation of traditional Robusta-producing regions suffering from negative growth, while traditionally Arabica-producing regions saw their Robusta output increase:
• Asia & Oceania saw its production fall by 5.2% to 42.9 million bags, while output fell by 17.4% to 7.0 million bags in Africa in coffee year 2022/23.
• South America, on the other hand, the world’s largest Arabica-producing region, experienced 10.4% growth in its output of Robusta to 23.9 million bags, while the Caribbean, Central America & Mexico saw their production rise by 33.0% to 0.4 million bags.
• As a result, the Americas’ share of the total Robusta production increased to 32.7% in coffee year 2022/23 from 28.5% in coffee year 2021/22, while Asia & Oceania’s share fell to 57.9% from 60.5% in the same period.
Graph 19: Production of Robusta – Regions, Million 60-kg Bags
7.3%
-9.1%
1.0%
14.7%
-5.5% -7.1% -7.4% -4.4%
-12.2%
5.3%
13.0%
-9.8%
2.2% 3.4%
-15.0%
-10.0%
-5.0%0.0%
5.0%
10.0%
15.0%
20.0%
Percent Change, %
8.5 0.3
21.7
45.2
7.0 0.4
23.9
42.9
0 5 10 15 20 25 30 35 40 45 50
Africa Caribbean, Central
America & Mexico South America Asia & Oceania
Millionn60-kg Bags
2021/22 2022/23
-17.4%
-5.2%
10.4%
33.0%
Graph 20: Production of Robusta – Regions, Percent Shares
2.5.2 Total Robusta Production – Countries At the individual country level:
• Vietnam, the largest Robusta producer in the world, produced 27.8 million bags in coffee year 2022/23, a 9.8% decrease. Prolonged rains in the major producing provinces of Dak Lak, Gia Lai and Kon Tum, lack of fertiliser usage and a shift towards more profitable crops such as durian and pepper were the main reasons for the fall in production.
• Indonesia’s output increased by 6.0% in coffee year 2022/23 to 9.9 million bags, which came despite reports of heavy rain driven by the La Niña weather phenomenon during and after the flowering period, which is usually thought to have a significant negative impact on production. This increase is due to the expansion of the coffee area.
• Brazil’s Robusta production increased by 10.6% in coffee year 2022/23 to 23.7 million bags on the back of good weather conditions and increased area harvested.
According to the Brazilian Institute of Geography and Statistics, the Robusta area harvested in coffee year 2022/23 increased by 4.2% to 408,719 hectares, an expansion of 16,648 hectares.
• India, Asia & Oceania’s second largest Robusta producer, increased production by 2.0%
to 4.2 million bags in coffee year 2022/23.
11.2%
0.4%
28.6%
59.7%
9.4%
0.6%
32.3%
57.8%
Asia &
Oceania South America
Africa Caribbean, Central America &
Mexico Inner Ring - 2021/22
Outer Ring - 2022/23
Graph 21: Production of Arabica – Countries, '000 60-kg Bags
Graph 22: Production of Arabica Ranking – Countries, Growth Rates, Coffee Years 2022/23 Vs Coffee Year 2021/22
5,0000 10,000 15,000 20,000 25,000 30,000 35,000
'000 60-kg Bags
2021/22 2022/23
-9.8%
10.6% 6.0%
-8.6%
2.0%
-64.7%
14.0%
3.0% 0.0% 5.3% 1.0%
-1.6% -5.5% -6.2% -5.7%
26.5%
-80.0%
-60.0%
-40.0%
-20.0%
0.0%
20.0%
40.0%
Percent Change, %
2.6 Total Coffee Production – Groups
• Production of the Brazilian Naturals increased on the back of biennial production in Brazil.
• Colombia’s persistent unfavourable weather conditions led to another year of decline for the Colombian Milds in coffee year 2022/23.
Graph 23: Production of Groups – Million 60-kg Bags
Graph 24: Production by Groups – Percent Share (%)
50.1
13.1
29.1
75.7 52.7
12.0
29.3
74.2
0 10 20 30 40 50 60 70 80
Brazilian Naturals Colombian Milds Other Milds Robusta
Millionn60-kg Bags
2021/22 2022/23
5.2%
-2.0%
0.7%
-8.5%
29.8%
7.8%
17.3%
45.0%
31.3%
7.1%
17.4%
44.1%
Robustas
Other Milds
Brazilian Naturals
Colombian Milds Inner Ring - 2021/22
Outer Ring - 2022/23
2.7 Outlook for Coffee Year 2023/24
The outlook for coffee year 2023/24 is framed by a set of broad assumptions:
• Adverse weather conditions, first noted in coffee year 2022/23 and continuing into coffee year 2023/24, will have a negative impact. The anticipated El Niño weather event is set to dampen the outlook in Asia, especially in Indonesia. Meanwhile Vietnam is expected to benefit from the drier/hotter weather as irrigation mitigates the reduced precipitation;
• The biennial production effect will play a large role in the outlook, especially for Brazil and the Arabicas, as the impact of the July 2021 frost continues to be resolved. Coffee year 2023/24 is anticipated to be an exceptional off-biennial year, feeling more like a good on-biennial following an average on-biennial year;
• Area under coffee is continuing to expand within existing agricultural land, the impact of which will be especially pronounced in the outlook for Ethiopia;
• Productivity is increasing due to increased adoption of good agricultural practices, including the usage of nursery-raised and research institute-recommended clones, the impact of which will be especially pronounced in the outlook for Uganda;
• Newly-planted coffee trees will undergo their first harvest in the third year, and will steadily increase yield annually until the respective national average has been reached;
• Status quo on labour and capital availabilities is especially pertinent for the outlooks of Caribbean, Central American & Mexican origins;
• International and local green bean prices are remunerative to elicit a positive response from farmers and seasonal labourers at harvest times and when coffee cherries are picked.
As a result, the outlooks for coffee year 2023/24 are as follows:
• World coffee production to increase by 5.8% to 178.0 million bags.
• The Arabicas’ share of total world output to be 57.4%, (102.2 million bags), with 75.8 million bags forecast for the Robustas.
• South American production to increase by 9.8%, rising to 89.3 million bags.
Inherent Underestimation
There is an inherent underestimation of the world coffee production by the ICO. For 2021, the total area under coffee harvested from origins not included in the ICO’s production data was estimated at 64,413 hectares, totalling 28 origins3. Major origins not included in the production statistics of the ICO are China and Malaysia. Moreover, there are additional origins that are not included in the list of 28 origins, such as Australia, South Africa and South Sudan.
For a number of smaller origins, the lack of capabilities of national coffee organizations, or their absence, presented a challenge in obtaining reliable data. Moreover, for developing origins with porous borders, especially those neighbouring other origins, a varying degree of domestic production was being shipped across borders unofficially. This phenomenon is well documented and an acknowledged issue across all regions of the world.
3 Food and Agriculture Organization Statistics (FAOStat), Crops and livestock products, downloaded December 2022.