Thank you Mum and Dad for all your support over the many, many years I spent at school. Katie, you've helped me with so many things over the years I've lost count.
INTRODUCTION
Thermoelectric Materials and Devices
Here, all the same variables of equation 1 are present, except that those denoted with a "p" or "n" subscript are associated with the p-type and n-type component material properties, respectively2. This relation shows that the device efficiency is proportional to (1+ZTM)1/2, and that the device efficiency approaches the Carnot efficiency ([TH-TC]/TH) as ZTM reaches infinity, which shows the importance of maximizing the device illustrates ZT.
Material Requirements
Electronic Requirements
Since the potential generated is a result of the migration of charge carriers from cold to hot (low energy to high energy), Seebeck coefficient can be simply thought of as the "heat" energy per carrier over temperature or the entropy per carrier6 . Therefore, with a fixed amount of "heat" energy available, an increase in the total number of charge carriers (concentration) will essentially "dilute" the amount of energy per carrier, thereby resulting in lower thermopower.
Thermal Requirements
In oxide semiconductors, since the carrier concentrations are low, the lattice thermal conductivity becomes the dominant contribution to the overall thermal conductivity. Therefore, research on reducing the thermal conductivity of these materials has focused mainly on reducing the lattice contribution through phonon mean free path disruption.
Current Promising Thermoelectric Materials
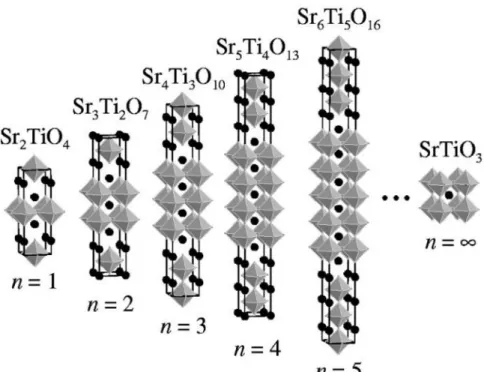
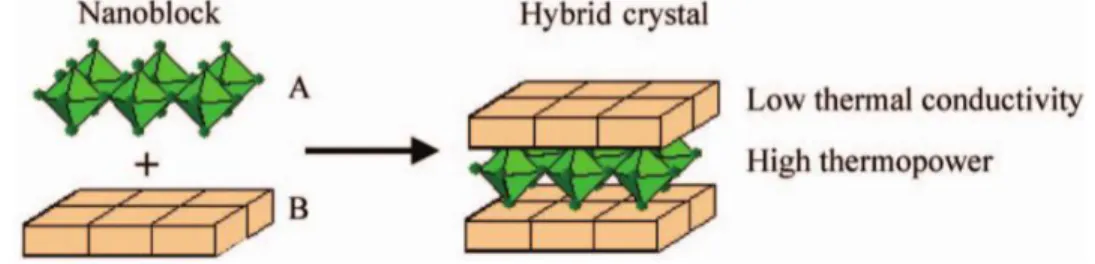
PGEC and Hybrid Crystal Structures
At 300 K, the thermal conductivity of the STO-327 RP sample was approximately half that of the Nb:STO sample. Regardless of the overall thermoelectric performance, these structures demonstrate that the presence of layered structures (hybrid crystals) results in an increase in phonon scattering, thereby significantly reducing the lattice's thermal conductivity.
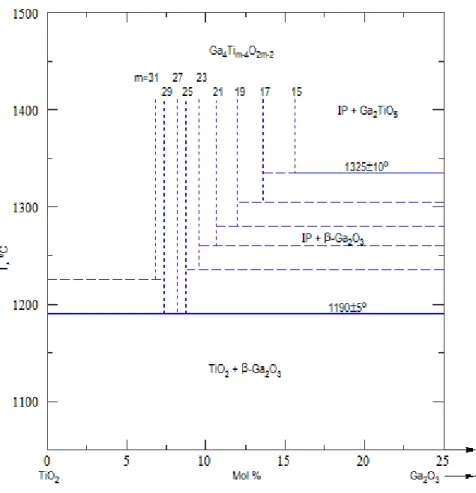
Crystallographic Shear Planes: TiO 2 Magnèli Phases
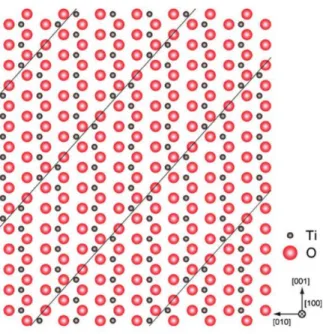
However, translation along this shear vector results in the movement of titanium atoms within the [TiO6] octahedron into interstitial octahedral positions, resulting in a perturbation of the structure along the crystallographic shear planes. A drawing of the crystallographic shear planes within the Ti6O11 Magnèli phase (n=6) is shown in Figure 5, where the distortion between the titanium atoms along the planes is visually apparent. The spacing between periodically spaced shear planes is a function of lattice oxygen deficiency, with the spacing decreasing as oxygen deficiency increases8.
Projection along the x-axis of the Ti6O11 Magnèli phase (n=6), showing the crystallographic shear planes along the (121)rutile planes8.
Beta-Gallia Rutile Intergrowth Structure
Therefore, the BGR structure can be described as having columnar sections of the β-Ga2O3 structure located at the (210) rutile shear boundary, whereby the gallium structures relative to the conventional x y z crystal coordinate system are rotated 180° and slightly expanded. . In addition, the rutile structural blocks at the (210)rutile boundary are translated along the [½¼½] displacement vector. The rotation of the β-Ga2O3 elements is required to match the rutile and gallium oxygen sublattice sites and results in the formation of the large tunnels within the BGR structures with a distance of 10.3 Å from each other and 2.5 Å in diameter31-33.
The boundary between the β-Ga2O3 and the rutile within the BGR structure can be described as a “zigzag” or sawtooth-like shape, where the edge-sharing octahedrons parallel to [001] are connected via corner sharing. to the tetrahedra.
![Figure 6. Schematic drawing of BRG structure, n=25 31 , with the [TiO 6 ] octahedra in blue and the β-gallia elements in yellow](https://thumb-ap.123doks.com/thumbv2/123dok/10491571.0/25.918.184.799.127.362/figure-schematic-drawing-structure-octahedra-gallia-elements-yellow.webp)
Synthesis Methods
Solid-state Synthesis
Additionally, since the intergrowth distance is a function of composition, similar to the other referenced layered systems, where the distance decreases with decreasing titanium-to-gallium ratio (or simply n-value), it is further hypothesized that thermal conductivity will decrease as n-value decreases.
Combustion Syntheiss
The products of the reaction are an oxide powder and a mixture of gases; CO2, NOx and ammonia. The combustion reaction is controlled using what is called the elemental stoichiometric coefficient, which takes into account relative molar amounts of fuel and oxidant precursors, as seen below in equation 7. Where Φ is the elemental stoichiometric coefficient, xO and xF are the mole fractions . of the oxidizer and fuel precursors, respectively, and vO and vF are the redox valences39.
Thermopower Analysis of a Polaron Conductor
EXPERIMENTAL PROCEDURE
Synthesis Methods; Combustion and Solid-State
These sample pellets were ground and homogenized using a mortar and pestle to produce the final product BGR. The sample was crushed in a steel die and ground using an agate mortar and pestle, pressed into a ball, and heat treated again at 1450 °C for 3 days. Finally, the pellet was ground again using a mortar and pestle to achieve the final BRG powder sample.
Spark Plasma Sintering (SPS)
Characterization
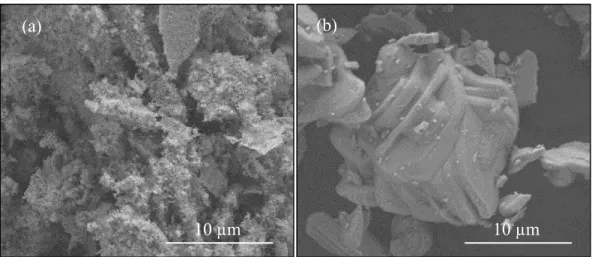
DIFFRAC.EVA 4.0 (Bruker ASX, Inc., Madison, WI, USA) was used to qualitatively identify the phase composition of each sample. A Quanta 200F Environmental Scanning Electron Microscope (FEI, Hillsboro, OR, USA) was used to analyze the powder morphology and sintered microstructures of the samples under study. To provide surfaces suitable for microstructural analysis, the samples were embedded in an epoxy mold and polished using sub-micron media.
Etching of smooth surfaces was accomplished by immersing the samples in boiling sulfuric acid (#A298-212, Fisher Scientific, Hampton, NH, USA) for 3 hours.
Property Measurement
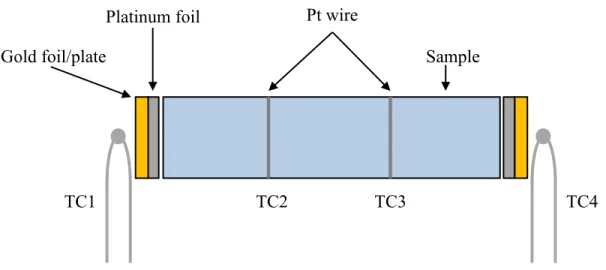
D.C. Conductivity and Thermopower Measurements
Post-sintered, milled powder samples were measured using the same parameters, but in these cases front-loaded sample holders were used. The in-house LabVIEW (National Instruments Corp., Austin, TX, USA) controlled simultaneous DC conductivity/thermal energy measurement system uses a programmable current source (Model 2400 Sourcemeter, Keithley Instruments, USA) and voltage/current meter (Model 2700 Multimeter/ Data Acquisition, Keithley Instruments, USA). The samples were measured using the following profile: from C with heating rate of 5 °C/min and held at each temperature point for 5 minutes before measuring every minute for 5 minutes, resulting in a total of 95 individual data points.
Thermal Condutivity Measurements
RESULTS AND DISCUSSION
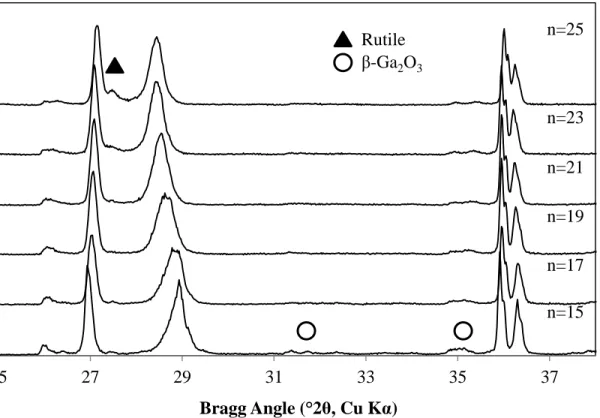
Qualitative Phase Analysis and Phase Stability
Post Heat Treatment/Pre-sintering
This broadening and asymmetry here is believed to be due to the presence of a distribution of BRG phases that is compositionally similar to the target compositions. However, there may be a limit to the degree of phase uniformity that is realistically achievable in the BGR system, as Lloyd et. The slightly lower Δd of the Lloyd et. is attributed to the small amount of rutile present in the CS sample, resulting in a lower n-value intergrowth phase.
However, this is below. the assumption that the minor amount of rutile present in some samples does not contribute significantly to the overall intergrowth composition. composition of BRG samples after heat treatment at 1400 °C, air cooled, both C.S. error bars in data markers).
Post-Sintering
The extent to which both of these differences contributed to the variation in the X-ray diffraction patterns is discussed below. As evidenced by the disappearance of the rutile peaks, sintering by SPS clearly facilitated the continued reaction of rutile with the BGR phase(s) present in the pre-SPS sintered samples. This seems to indicate that there is a partial breakdown in the homogeneity of the BRG phase, which may result in a distribution in BGR phases close to the goal, as hypothesized above belonging to C.S.
In addition, no presence of reduced TiO2 phases, Magnèli phases, is visible in the XRD patterns of the sintered samples.
Electrical Properties
Electrical Conductivity and Thermopower
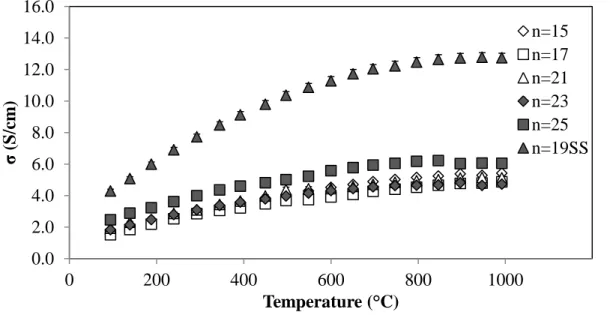
Therefore, it is suggested that the observed changes in properties in this high temperature region can be attributed to surface oxidation and decomposition of the samples. Comparing this with the electrical conductivity results, there is no discernible trend as a function of composition, with the exception of the n=25 sample which shows the highest measured values. In the extrinsic non-degenerate region of a Jonker plot, the slope of the line will have a slope of 86.15 µV/K (kB/e)43.
Since the slopes of the lines from this Jonker analysis are probably equal to 86 µV/K (measurement error and variation given), the differences between the electrical properties of n=19 S.S.
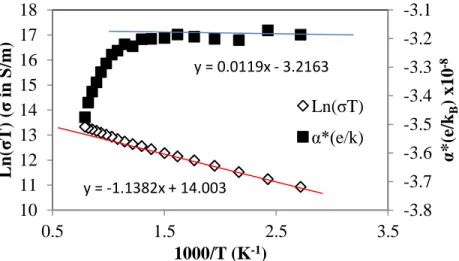
Activation Energy and Hopping Mobility
Samples, where Eσ is the Energy for Conduction Overall, Eα is the Carrier Generation Activation Energy, and Eµ is the Mobility Activation Energy (Eσ-Eα), over a temperature range of 100-500 °C. The electron hopping mobility for n=25 was determined using calculated carrier concentration values along with equation 1 (σ = e·n·µ). A carrier mobility of 0.1 cm2/V·s is generally considered to be the distinction between polaron and band conduction mechanisms, with polaron conduction mobility values below this threshold56.
As seen in Figure 22, all the mobility values calculated for n=25 fall well below this threshold, with a mobility of 0.017 cm2/V·s at 400 °C, which further supports conduction by polar hopping.
Thermal Properties
Thermal Diffusivity
Looking back at the XRD patterns shown in Figure 15, there is notable overlap between the peak areas of the sample compositions tested, indicating the similarities in the sample phase compositions overall.
Calculated Heat Capacity and Thernal Conductivity
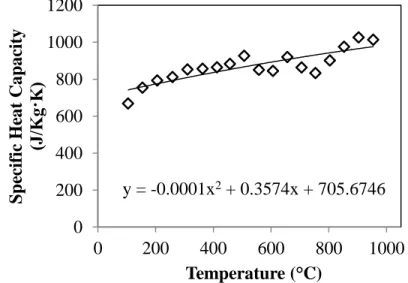
Due to the significant level of scatter in the data, no trend could be inferred between the composition and specific heat capacity of the BGR samples. The XRD phase analysis of the TiO1.90 sample was matched to the indexed Ti6O11 Magnèli phase. Furthermore, the thermal conductivities of both samples at low temperatures are similar to those of the Ti6O11 Magnèli phase sample.
If this hypothesis is correct, then the similarity between the measured thermal conductivities of the BGR samples and the Ti6O11 sample, all much lower than that of stoichiometric TiO2, suggests that the presence of gallium was an important contributing factor to the reduced values.
Generalized Thermoelectric Properties
SUMMARY AND CONCLUSIONS
Spark plasma sintering (SPS) was used to sinter all the samples investigated in this study. Above 400 °C, changes in electrical conductivity and thermopower are inferred to be related to surface oxidation and decomposition of the BGR phase into β-Ga2O3 and rutile TiO2. These nitrogen impurities may also be responsible for the varying amounts of lattice distortions observed in the XRD patterns of the sintered samples, with n=19 S.S.
This is also significantly lower than the measured ZT of the Ti6O11 Magnèli phase sample, 0.10 at 400 °C.
FUTURE WORK
Subrahmanyam, “Effect of fuels on combustion synthesis of TiO2–toward efficient photocatalysts for methylene blue oxidation and Cr(Vi) reduction under natural sunlight,” Chem. Chen, “Synthesis of Mesoporous Nitrogen-Tungsten Doped TiO2 Photocatalysts with High Visible Light Activity,” Appl. Chen, “Significant enhancement of photocatalytic activity of N,W-doped TiO2 nanomaterials for promising environmental applications,” Nanotechnol.
Diebold, "Influence of Nitrogen Doping on Defect Formation and Surface Properties of TiO2 Rutile and Anatase," Phys.