After two years, I left the graduate program at UCLA to pursue a career in finance, which was the focus of my undergraduate studies. The experience with your group was one of the best parts of the final stage of my graduate career.
Introduction
- Background
- Statement of Problem
- Experimental Strategy
- Summary of Results
- References
Prasher DC, Eckenrode VK, Ward WW, Prendergast FG, & Cormier MJ (1992) Primary structure of the Aequorea victoria green-fluorescent protein. Sun Q, Doerr M, Li Z, Smith SC, & Thiel W (2010) QM/MM studies of structural and energetic properties of the far-red fluorescent protein HcRed.
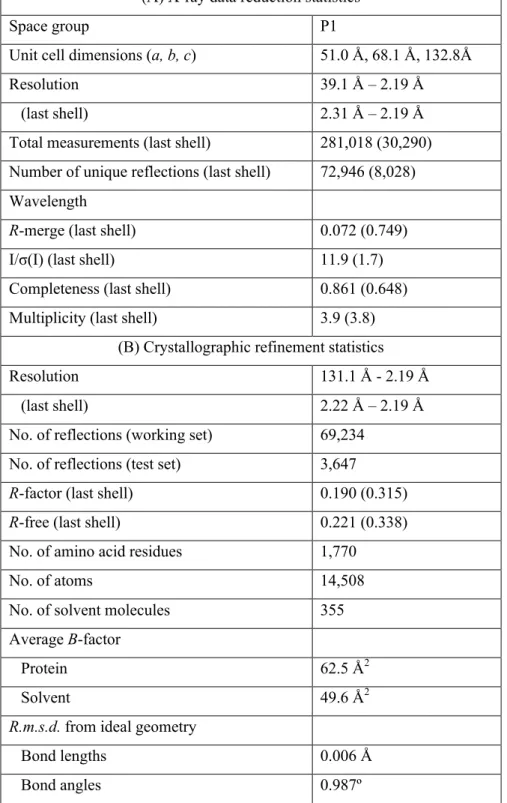
The Structure of a Far-Red Fluorescent Protein, AQ143, Shows Evidence in Support of Reported Red-Shifting Chromophore
Introduction
Fluorescent proteins (FPs) that emit light in the near-infrared (NIR) window (~650-900 nm) are in demand as biological imaging agents. Here we report the 2.19 Å crystal structure of AQ143, which is derived from a more distantly related protein, aeCP597 (~60% sequence identity to eqFP578 and its variants).
Results and Discussion
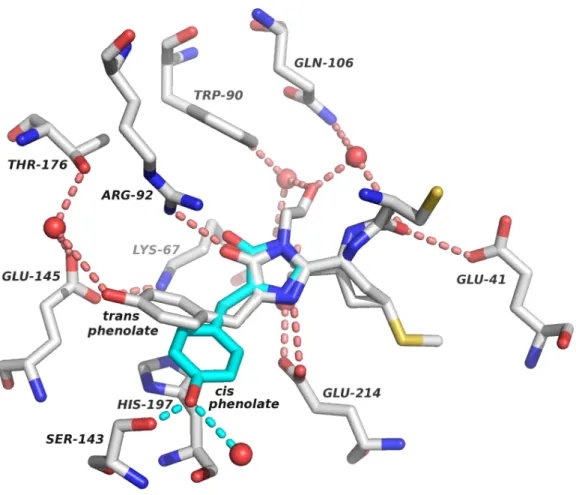
The refined structure indeed shows good electron density for all parts of the chromophore, with the exception of the phenolate side chain, which we modeled in the trans configuration. Interestingly, neither the trans nor the modeled cis conformations of the chromophore are coplanar with the imidazoline ring.
Conclusion
Materials and Methods Protein expression and purification
We modeled the cis-chromophore after refining the structure because there was poor density for this conformation. However, there was a residual density in the region we expected to be the cis-chromophore.
Acknowledgments
First, the chromophore was added without the phenolate side chain, as little density appeared for this group. We introduced the alternative conformation into COOT, fitted it to the residual density, and ran the model through several rounds of PHENIX refinement, resulting in the modeled positions shown in Figures 1 and 2 in turquoise.
Tables and Figures
The modeled cis conformation is shown in turquoise, along with two putative hydrogen bonds to its hydroxyl group. Two hydrogen bonds to the acylimine oxygen of Glu41 and a coordinated water can be seen in the right side of the figure.

Supplementary Tables and Figures
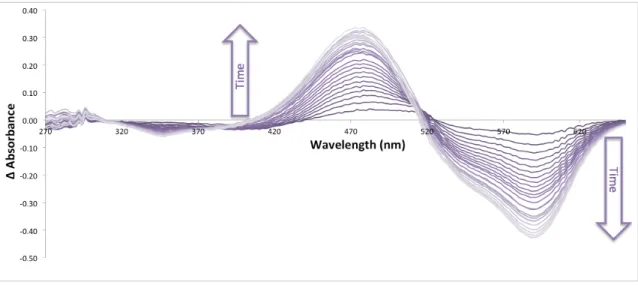
The emission was measured at an excitation wavelength of 465 nm, while the excitation was measured at an emission wavelength of 560 nm. The emission was measured at an excitation wavelength of 550 nm, while the excitation was measured at an emission wavelength of 660 nm.

2010) Red laser-excitable far-red fluorescent protein for flow cytometry and superresolution STED nanoscopy. Proceedings of the National Academy of Sciences of the United States of America Photoconversion in red fluorescent protein from the sea anemone Entacmaea quadricolor: cis-trans isomerization involved. 2000). Proceedings of the National Academy of Sciences of the United States of America, Interactions between chromophore and glutamate 16 lead to far-red emission in a red fluorescent protein.
Computational Design of the β-sheet Surfaces of Red Fluorescent Proteins Allows Control of Protein Oligomerization
Introduction
Computational methods have strongly influenced protein design, but despite successes in core repackaging, computational design of protein surfaces, especially those with high β-sheet content, has lagged [1]. Here we present a CPD-driven library creation process that can efficiently search sequence space for soluble protein surfaces, facilitating protein surface design in situations that are not easily adapted to high-throughput screening methods [7,8]. We demonstrate the successful design of fluorescent protein (FP) β-sheet surfaces, accelerating the monomerization of a core-stabilized RFP.
Results
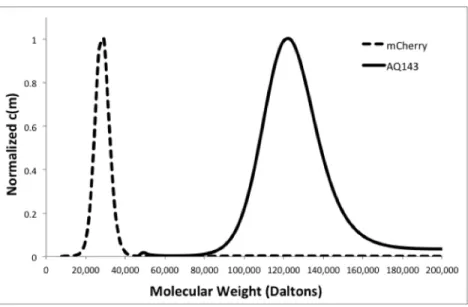
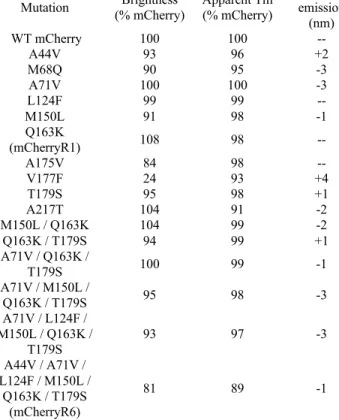
To confirm the results of the homo-FRET assay, selected members of Mlib were verified as monomers by SEC and AUC (Figure 3). First, we reverted each of the 13 positions that were mutated in the core of mCherry (and that were mutated in DsRed to create DsRmCh) to the wild-type residue found in DsRed. However, thermostability data showed that this mutation reduces the apparent Tm of mCherry by 9%, which is more than double the impact of any of the six mutations present in mCherryR6.
Discussion
Previous efforts in RFP engineering have struggled to separate changes in RFP spectroscopic properties from oligomeric control of the protein. We describe the successful computational design of a soluble protein surface with a large β-sheet component that disrupts homo-oligomerization. By designing the RFP surface, we were able to easily measure the performance of the designed versions and contribute to a better understanding of FP engineering.
Materials and Methods Plasmids and Bacterial Strains
Where Φ is the quantum yield, A is the absorbance, F is the total fluorescent emission (area under the curve) and n is the refractive index of the solvents used. To measure the extinction coefficient, 100 µl of the protein solution diluted to A550 between 0.1 and 0.5 was taken and the absorbance between 400 nm and 700 nm was measured in triplicate. The derived thermal melt curve finds the inflection point of the slope, which is the apparent temperature at which fluorescence is irreversibly lost (apparent Tm).
Acknowledgments
100 µl of each purified protein analyzed was passed over a Superdex 75 10/300 size exclusion column with 25 ml bed volume on an AKTA from GE Life Sciences. Sedimentation velocity was performed overnight at 40,000 RPM with full A575 scans collected without any pause between readings. Data were loaded into Sedfit and a c(m) distribution was performed with default assumptions made for PBS buffer viscosity.
Tables and Figures
Structure of DsRed (PDB ID: 1ZGO). A) Positions that were mutated in the protein core during directed evolution of mCherry. Note also that cleavage of residues from position 221 onwards (C-terminal tail) markedly reduces the complexity of the AC interface. The fluorescence emission polarization of the purified proteins was analyzed to determine their oligomeric state.
Supplementary Tables and Figures
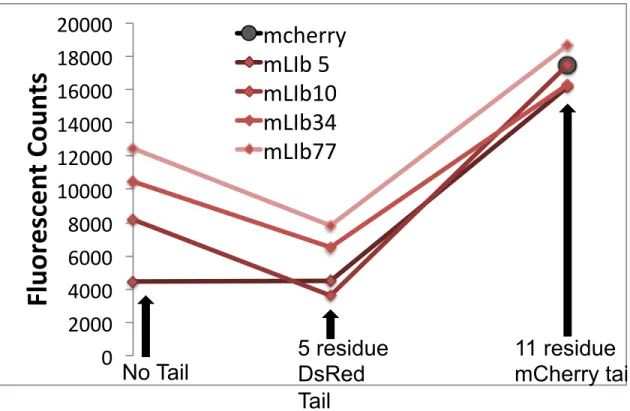
We grafted the 5-residue DsRed tail (HHLFL) or the 11-residue mCherry tail (HSTGGMDELYK) to the four mLib variants and measured their fluorescence in induced bacterial culture.
Kredel S, Oswald F, Nienhaus K, Deuschle K, Röcker C, et al. 2008) mRuby, a bright monomeric red fluorescent protein for labeling subcellular structures. Wiedenmann J, Ivanchenko S, Oswald F, Schmitt F, Röcker C, et al. 2004) EosFP, a fluorescent tag protein with UV-inducible green-to-red fluorescence conversion. Henderson JN, Osborn MF, Koon N, Gepshtein R, Huppert D, et al. 2009) Excited state proton transfer in the red fluorescent protein mKeima.
Abstract
Introduction
RFPs have been useful in this context, and engineered monomeric RFP variants have been most widely adopted due to the advantages a monomer provides. By requiring mutation in the chromophore environment for successful monomerization, it has not been possible to exert any significant degree of control over the spectroscopic properties of the resulting monomer. Here we present the structures of a red-shifted, core-optimized dimer; we are close to obtaining a structure of the final monomers.
Results
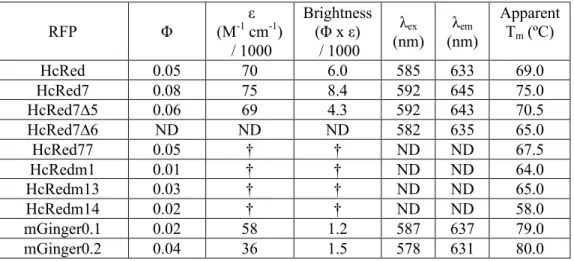
With no apparent rational design strategy for improving the fluorescence of tail-deleted variants,. All of the brightness lost on tail deletion from HcRed7 was recovered in HcRed77, without any hypsochromic shift in the λem of HcRed7Δ6, although HcRed77 remained hypsochromically shifted by HcRed7. HcRedm13 has seven mutations, three of which are in the outer β-strands, with the rest in loops at both ends of the protein.
Discussion
On the other hand, position 67 is a key catalytic residue that acts as a base and abstracts a proton from the bridging carbon of the phenolate side chain during cyclization (28, 29). Of the ten residues that make up the distorted β-strands, eight are mutated in mGingers. Three more mutated positions (Cys155, Tyr174, and Ser176) are on the outside of the β-barrel near the edge of the AC interface.
Conclusion
The clearest conclusion from these mutational data is that a larger portion of the AC interface will benefit from explicit design during future monomerization efforts, and special focus should be given to the β-barrel defect between β-strands 7 and 10.
Materials and Methods Plasmids and Bacterial Strains
The variants to be scrambled together were PCR-amplified run on gel electrophoresis, visualized with Gel Red, excised from the gel and then purified by a standard spin-column gel purification kit (Qiagen). Proteins were then polished by running over a Superdex 75 10/300 column on an AKTA fast protein liquid chromatography (FPLC) instrument and in the process buffer exchanged into PBS. The chromophore was initially left out of the refinement and added at a later stage when distinct density became apparent for it.
Acknowledgments
Tables and Figures
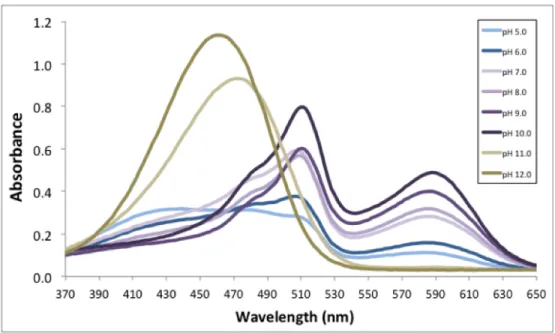
The crystal structure of HcRed (PDB: 1YZW) shows a double occupancy of the phenolate group of the chromophore. We measured the stability of the different HcRed variants with an increasing temperature melt in a qPCR machine. There is a deformity in the structure of the β-barrel that takes the shape of a large gap between β-strands 7 and 10.
Supplementary Tables and Figures
STRAND'1STRAND'2STRAND'3CENTRAL'HELIXSECONDARY'STRUCTURE hcCP%MAGLLKESMRIKMYMEGTVNGHYFKCEGEGDGNPFTGTQSMRIHVTEGAPLPFAFDILAPCCEYGSRTFVHHTAE HcRed7MVSGLLKESMRIKMYMEGTVNGHYFKCEGEGDGNPFAGTQSMRIHVTEGAPLPFAFDILAPCCEYGSKTFVHHTAE total%mutations5xxxNNNNNNNNNNNNNNNNNNNNNNNNNNNNNNNNNxNNNNNNNNNNNNNNNNNNNNNNNNNNNNNNxNNNNNNNN mGinger0.1MGSGLLKENMHIKMYMEGTVNGHYFKCKGEGDGNPFAGTQSMRVHVTEGAPLPFAFDILAPCCEYGSKTFVRYPAD total%mutations13xxxNNNNNxNxNNNNNNNNNNNNNNNNxNNNNNNNNxNNNNNNxNNNNNNNNNNNNNNNNNNNNNNNxNNNxxxNx mGinger0.2MGSGLLKENMHIRMYMEGTVNGHYFKCKGVGDGNPFAGTQSMRVHVTEGAPLPFAFDILAPCCEYGSKTFVRYPAD total%mutations15xxxNNNNNxNxNxNNNNNNNNNNNNNNxNxNNNNNNxNNNNNNxNNNNNNNNNNNNNNNNNNNNNNNxNNNxxxNx. MININHELIXSTRAND'4STRAND'5STRAND'6STRAND'7SECONDARY'STRUCTURE hcCPIPDFFKQSFPEGFTWERTTTYEDGGILTAHQDTSLEGNCLIYKVKVLGTNFPADGPVMKNKSGGWEPCTEVVYPE HcRed7IPDFFKQSFPEGFTWERTTTYEDGGILTAHQDTSLEGNCLIYKVKVHGTNFPADGPVMKNKSGGWEPSTEVVYPE total%mutations2NNNNNNNNNNNNNNNNNNNNNNNNNNNNNNNNNNNNNNNNNNNNNNxNNNNNNNNNNNNNNNNNNNNxNNNNNNN mGinger0.1IPDFFKQSFPEGFTWERTTTYEDGGILTAHQDTSLEGNCLIYKVKVHGTNFPADGPVMKKETCGWEPSTESVYPE total%mutations7NNNNNNNNNNNNNNNNNNNNNNNNNNNNNNNNNNNNNNNNNNNNNNxNNNNNNNNNNNNxxxxNNNNxNNxNNNN mGinger0.2IPDFFKQSFPEGFTWERTTTYEDGGILTAHQDTSLEGNCLIYKVEVHGTNFPADGPVMKKETCGWEPSTESVYPE total%mutations8NNNNNNNNNNNNNNNNNNNNNNNNNNNNNNNNNNNNNNNNNNNNxNxNNNNNNNNNNNNxxxxNNNNxNNxNNNN. STRAND'8STRAND'9STRAND'10STRAND'11SEKONDÊRE'STRUKTUUR hcCPNGVLCGRNVMALKVGDRRLICHLYTSYRSKKAVRALTMPGFHFTDIRLQMPRKKKDEYFELYEASVARYSDLPEKA HcRed7NGVLCGRNVMALKVGDRHLICHRLLTDYTSYRSYFEKKKKKKFEVEL %mutations4NNNNNNNNNNNNNNNNNNxNNNNxNNNNNNNNNNNNNNNNNNNNNNxNNNNxNNNNNNNNNNNNNNNNNNNNNNNNNN mGinger0.1NGVLRGRNHMALKVGDSHLHCHHSTTYRSKKAERALIMPPRHSTDYCLQITSHKDDEYFELYETSVARYSDNNNNNNNNNNNNNNNNNNNNNXNNNNNNNNXNNNNNNNNNNXNNNNNNNNNNXNNNNNNNNNNXNNNNNNNNNNXNNNNNNNNNNNNNXNNNNNNNNNNNNNNNNNNNNNNNNNNNNNNNNNNNNNNNNNNNNNNNN NNxxNxNNxxNNxxxxNxNNNNNNNNxNNNNNNNNxxxxx mGinger0.2NGVLRGRNHMALKVGDSHLHCHHSTTYRSKKAERALIMPPRHSTDYCLQITSRKDDEYFELHETSVARYSDNNNNN totaal%mutasies28NNNNxNNNxNNNNNNNxxNxNNxxNNNNNNNNxNNNNNNNNNNNNNNNNNXNNNNNNNNNNNNNNNNNNXNNNNNNNNNNNNNNNNN xxxx.
Supplemental Methods
Wannier TM & Mayo SL (2014) The structure of a far-red fluorescent protein, AQ143, shows evidence supporting reported red-shift chromophore interactions. Chica RA, Moore MM, Allen BD and Mayo SL (2010) Generation of longer emission wavelength red fluorescent proteins using computationally designed libraries. 2010) Far-red fluorescent protein excitable with red lasers for flow cytometry and super-resolution STED nanoscopy. Investigating the diffusion of molecular oxygen in the red fluorescent protein mCherry using explicit oxygen molecular dynamics simulations.
Accurate Characterization of Some Common Anthozoa Class Red Fluorescent Proteins
- Abstract
- Introduction
- Results and Discussion
- Conclusion
- Materials and Methods
- Tables and Figures
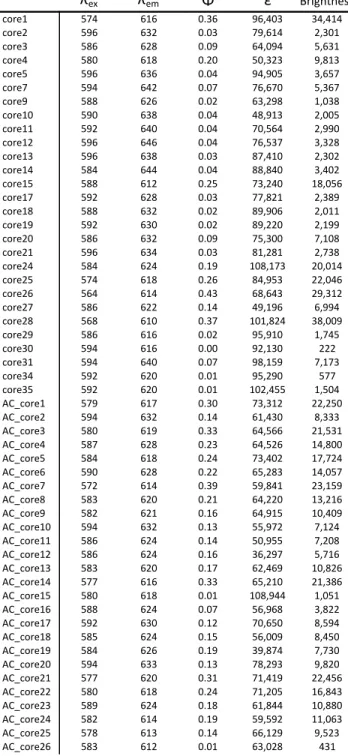
We measure quantum yield, extinction coefficient, λem, thermal stability and oligomerity in some of the most commonly used and a group of recently reported reddened FPs. However, the manner in which the oligomericity of the designed variants was measured is inconsistent between these studies. Quantum yield (Φ) is one of the most important RFP properties, as it is a measure of the efficiency of the chromophore in emitting fluorescent light.