Their warm support and advice made me feel at home, even in a foreign country on the other side of the Earth. Seth Olsen, Ross Salawitch, Jean-Francois Blavier, Jack Margolis, and Norten Allen (at Harvard) gave me valuable guidance in my graduate career, especially in my many years of battling computer problems. The friendships of Tingwei Mu (Chemistry), Justin Bois (Chemical Engineering), Kai Shen (Neuroscience), and Huiyu Li (Geochemistry) have also greatly helped me in my life outside of research.
I also really enjoyed my time in the Wennberg and Randerson group, with Rebecca Washenfelder, Gretchen-Keppel Alex, Alan Kwan, Julie Fry, John Crounse, Karena McKinney, Coleen Roehl, Yael Yavin, David McCabe, Kathleen Spencer, Lisa Welp, Nicole Smith Downey, Nir Krakauer, Jamie Lindfors, Seth Olsen, Julianna Fessenden and Heping Liu. I demonstrate that high-precision measurements of the vertical-average dry-mixed volume ratio of atmospheric carbon dioxide (CO2) can be obtained from ground-based solar spectra.
List of Tables
Introduction
- Global warming and the carbon budget
- Current measurements of atmosphere related carbon fluxes
- Spaceborne and ground-based X CO 2 observations
- Outline of the Dissertation
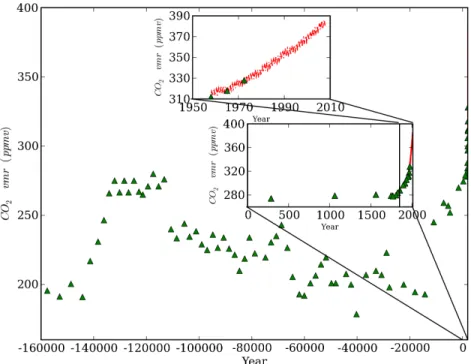
The effect of land use changes, especially deforestation, has contributed to another 1/3 of the cumulative anthropogenic carbon emission after 1750 [Schlesinger, 1984; McGuire et al., 2001]. In recent decades, only about half of the anthropogenic carbon remains in the atmosphere [Keeling et al., 1995], as shown in Figure 1.2. The other half, or about 3 PgC/year, is absorbed by the terrestrial biosphere and seawater [Keeling et al., 1996].
A global observational network (FLUXNET) with over 300 sampling sites covering different types of biomes on five continents has been in operation continuously since 2001 [ Baldocchi et al. b) Carbon exchanges between the ocean and the atmosphere can be derived from wind speed and surface water carbon dioxide partial pressure (pCO2) [Takahashi et al., 2002]. Future missions of this type include the Orbit Carbon Observatory (OCO) of the Jet Propulsion Laboratory [Crisp et al., 2004] and the Greenhouse Gases Observing Satellite (GOSAT) of the Japan Aerospace Exploration Agency [Masahiro and Takashi, 2005].
Abstract
- Introduction
- Measurements
- Data analysis
- Results
- Conclusions
These measurements, additionally, can be important for limiting aspects of the CO2 behavior that will not be measurable from space in the foreseeable future (eg daily variations). It is clear that the accuracy of the CO2/O2 ratio is improved over that of the CO2 column. To understand the daily variation and to estimate the accuracy of the retrieval, it has 231 column results.
We speculate that the different behavior of the continuum signal in the CO2 and O2 spectral regions as a function of air mass contributes to this anomalous diurnal behavior in CO2/O2. We believe that residual errors are dominated by deficiencies in the spectroscopic line lists, and by air mass ambiguities exacerbated by the long scan duration of the Kitt Peak spectrometer.

Ground-based photon path measurements from solar absorption spectra of the O 2
- Introduction
- Measurements
- Data analysis
- Results and discussion
- Conclusion
For the A-band, the large optical depths mean that most lines are saturated from centers up to ~10 Lorentzian widths, even at the smallest airmass (slant-to-vertical column ratio). The curvature of the continuum is less than 0.2% relative to the residuals, which is small compared to the uncertainty in gas absorption. Compared to (a), the continuum was normalized and the offset of the zero level was subtracted. c) spectral fit residual (measured minus calculated).
The two-step strategy has reduced the spread of retrievals from high air mass spectra, but slightly increased the spread of the low air mass results. In HITRAN2000, the widths of high rotational quantum number absorption lines (herein denoted J) were extrapolated from previous measurements of the lower J lines. Line mixing is prominent only for the high-J lines in the R branch band head (v ~ 13165cm−1, shown in Figure 3.1), although Linda Brown [private communication] has speculated that it probably extends throughout the entire A band.
However, the non-absorbing regions on either side of the A-band are used because they are necessary to derive the spectral continuum. The obtained photon path scale factors (PPSF: ratios between the obtained and geometrically derived ray paths) using the Voigt function from the O16O16 lines of the A-band FTUVS spectrum are plotted against the air masses at which they were imaged in Figure 3.3(a). The SBHW fit (orange line in panel (b)) to the above rotational quantum number (N') is.
Evaluation of achievable accuracy from current spectral retrieval technique is based on the scattering of the "flat region" in Figure 3.4(b), analyzed using super-Lorentz function of η= 1.977. Although the super-Lorentz line shape is imperfect for describing A-band lines, the better representation of the far wings may indicate the existence of collision-induced absorption (CIA), which was previously speculated [Mlawer et al., 1998]. The major obstacle to further progress in this endeavor is that we cannot correctly represent the line shape of the absorption in the A band.

Using column CO 2 mixing ratio to constrain North Hemispheric Net Ecosystem
- Introduction
- Measurements and Models
- Methods
- Results and Discussion
- Summary and implications
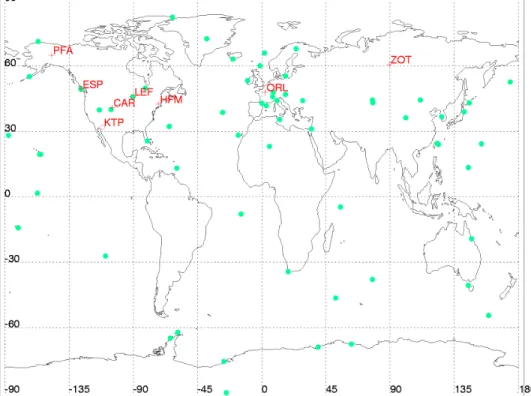
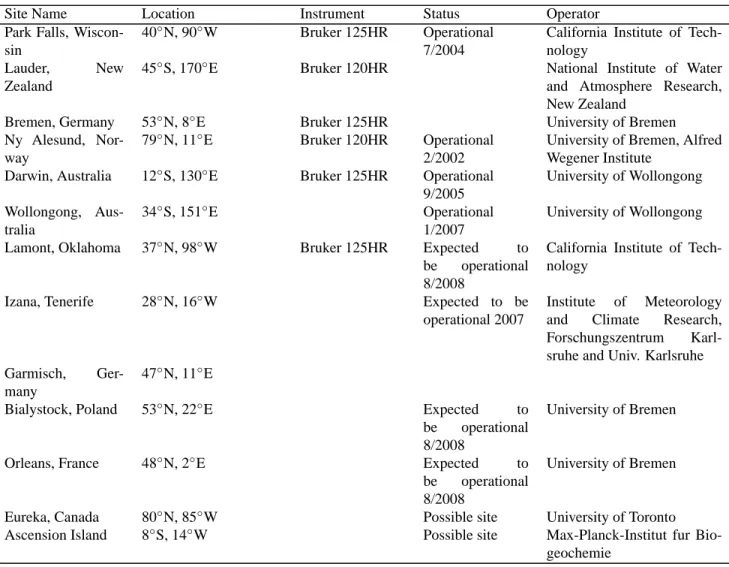
However, correctly simulating the exchange between the planetary boundary layer (PBL) and the free troposphere is still an area of active research for the atmospheric dynamics community. In this study, we use newly available observations of the column and vertical profile dry air CO2 molar mixing ratios over eight sites (Table 4.3) to estimate the seasonally varying carbon flux (NEE) in the Northern Hemisphere. Because these observations are of column abundance, they come close to directly representing a measure of atmospheric CO2 mass.
Because these vertically integrated observations sample a significant portion of the Northern Hemisphere land mass, they provide a measure of CO2 mass variations that is not very sensitive to errors in the transport fields. This is supported by the relatively small variation in the model simulations of the columns illustrated for Park Falls in Figure 1 and for the other locations in the accompanying supplementary material. The results of such an analysis are shown in Figure 4.5: the relationship between retrieved CASA scale factors and height for are quite different from site to site.
We find that direct comparison between the simulations and observations for these sites was hampered by large discrepancies in the shape of the CO2 seasonal cycle at some sites (eg, ZOT in Figure 4.6 on page 55), and a new diagnostic method is needed. The A values of 12 model means are given at each of the six flight sampling locations (marked with different colors). Comparison of the column-averaged CO2 dry volume mixing ratio measurements and the TransCom models shows that the CASA model underestimates the Northern Hemisphere growing season net flux by ca. 28%.
2004] suggest that this correlation is consistent with errors in the parameterization of the seasonal mixing efficiency between the planetary boundary layer and the free troposphere, which varies in time with the direction and strength of the surface carbon exchange [Denning et al., 1995]. Our findings suggest that as an ensemble, the TransCom models may have too little vertical mixing and may thus overestimate the size of the Northern Hemisphere land sink. These observations should provide an improved measure of the gradient in CO2 mass between the hemispheres.
The future of global carbon budget observation system
- Total Carbon Column Observing Network (TCCON)
- CO 2 observing satellites
- Differential Absorption Lidar (DIAL)
- Unmanned Aerial Vehicle (UAV)
- Passenger aircraft
- Perspectives
The first space-based observations were made by the Japanese Interferometric Greenhouse Gas Monitor (IMG) [Kobayashi et al., 1999a,b] aboard the Advanced Earth Observing Satellite (ADEOS), which was launched in August 1996, although it lasted only eight months. Later studies demonstrated the feasibility of observing carbon dioxide from space by reanalyzing infrared soundings from launched satellites, including HIRS-21 on the NOAA Polar Meteorological Satellite [Chédin et al., 2003a,b] and AIRS2 on the NASA Aqua platform [Crevoisier et al. ., 2004; Chevallier et al., 2005;. 2007 ] used near‐IR spectra from the Scanning Absorption Imaging Spectrometer for Atmospheric Cartography (SCIAMACHY) on ENVISAT [ Burrows et al ., 1995 ; Bovensmann et al., 1999].
The Orbiting Carbon Observatory (OCO) [ Crisp et al ., 2004 ] is a mission led by the Jet Propulsion Laboratory and sponsored by NASA's Earth System Science Pathfinder (ESSP) program. Studies of the observation of other atmospheric trace gases including CO2 started soon after [Reid et al., 1978;. Airborne DIAL systems emerged in the late 1970s to early 1980s with developments at the Jet Propulsion Laboratory [Shumate et al., 1981].
An experimental space mission (lidar technology experiment in space, or LITE) was also launched by the space shuttle Discovery in September 1994 [Browell et al., 1998]. New laser source with high energy and stability (e.g. fiber laser used by [Abshire et al., 2006]) could significantly improve the situation and provide another independent method for measuring CO2 from soil and space. Tans [2007a]) have provided important information about the temporal and spatial variation of atmospheric CO2, especially for modeling the "corrective effect" of vertical mixing [Denning et al., 1999].
Several recent studies [Sherwood, 2005; Fladeland et al., 2005; Watai et al., 2006] have demonstrated the feasibility of constructing a low-cost, low-maintenance UAV system specifically for atmospheric CO2 sampling. Atmospheric CO2 measurements were included in the initial effort of the JAL project [Matsueda and Inoue, 1996; Matsueda et al., 2002], which has since been expanded from one to seven aircraft covering a large area of (Figure 5.4) the Pacific and Eurasia. Another effort on passenger aircraft CO2 measurements is included in the European CARIBIC (Civil Aircraft for the Regular Investigation of the Atmosphere Based on an Instrument Container) project [Brenninkmeijer et al., 1999; Zimmermann et al., 2002; Brenninkmeijer et al.
Bibliography
1999), CARIBIC – Civil Aircraft for Global Measurement of Trace Gases and Aerosols in the Tropopause Region, Journal of Atmospheric and Oceanic Technology Civil aircraft for the regular investigation of the atmosphere based on an instrumented container: the new CARIBIC system, Atmospheric Chemistry and physics. Francey (1995), A Synthesis Inversion of the Concentration andδ13C of Atmospheric CO2, Tellus Series B - Chemical and Physical Meteorology, 47, 35–52. Rothman (1998), Improved spectral parameters for the three most common isotopomers of the oxygen molecule, Journal of Quantitative Spectroscopy.
Loth (2006), Two-micrometer heterodyne differential absorption lidar measurements of the atmospheric CO2 mixing ratio in the boundary layer, Applied Optics. IPCC (1995), Climate Change 1994: Radiative Forcing of Climate Change and An Evaluation of the IPCC IS92 Emission Scenarios. 1989), Atmospheric Carbon Dioxide and Forests, Philosophical Transactions of the Royal Society of London Series B-Biological Sciences. Clothiaux (2001), Joint statistics of photon path length and cloud optical depth: Case studies, Journal of Geophysical Research-Atmospheres.
Murcray (1998), Collision-induced atmospheric absorption observed in the near-infrared oxygen bands, Journal of Geophysical Research-Atmospheres. Peil (1995), Total column density of tropospheric and stratospheric trace gases in the undisturbed arctic summer atmosphere, Journal of Atmospheric Chemistry. Rinsland (1995), Infrared measurements of the vertical distribution of ozone over Kitt Peak, Journal of Geophysical Research-Atmospheres.
Wilkerson (1987), High-resolution spectroscopy of the oxygen A-band, Journal of Molecular Spectroscopy Increasing atmospheric CO2 and its implications for agricultural productivity .1. Williams (2001), Collision-induced absorption of solar radiation in the atmosphere by molecular oxygen at 1.27 µm: field observations and model calculations, Journal of Geophysical Research-Atmospheres. Inoue (2006), A lightweight observation system for atmospheric carbon dioxide concentration using a small unmanned aerial vehicle, Journal of Atmospheric and Oceanic Technology.