3
Controlling for Quality
Objectives
1. Define the control process, and discuss the elements of reporting.
2. Develop an appreciation for business, process, and product perfor- mance reporting.
3. Introduce and describe the various reporting structures.
terminOlOgy
Defect: A departure of a quality characteristic from its intended level or state that occurs with a severity sufficient to cause an associated product or service not to satisfy intended normal, or foreseeable, usage requirements.
Management: A process or form of work that involves the guidance or direc- tion of a group of people toward organizational goals or objectives.
Management (quality) control: A process for setting goals, monitoring performance, and correcting for deviations.
Nonconformity: A departure of a quality characteristic from its intended level or state that occurs with a severity sufficient to cause an associ- ated product or service not to meet a specification requirement.
Objective: A statement (used interchangeably with goal) designed to give an organization and its members direction and purpose.
Policies: Broad, general guidelines for action which relate to goal attainment.
Procedures: A series of related steps or tasks expressed in chronological order to achieve a specific purpose.
Process approach to management: An approach to the study of manage- ment that focuses on the management functions of planning, con- trolling, organizing, staffing, and motivating.
Rules or requirements: Guidelines that require specific and definite actions be taken with respect to a given situation or task.
Systems approach to management: A philosophy, popularized by Frederick Taylor, concerning the relationship between people and work that seeks to increase productivity and simultaneously make work easier by scientifically studying work methods and establishing standards rather than depending on tradition and custom.
intrOductiOn
Defining the organizational purpose is critical with regard to control.
Management must identify the customer, where the customer is, how the customer buys, and how the customer can be reached. Next, management must determine what the customer buys.
In addition to defining the present business, management must also identify what future business will be and what it should be.
long-range Objectives
Long-range objectives generally extend beyond the fiscal year of the orga- nization. Long-range objectives must support and not be in conflict with the stated organizational purpose. However, long-range objectives may be quite different from the organizational purpose and still support it.
short-range Objectives
Short-range objectives should be derived from in-depth evaluation of long- range objectives. Such an evaluation should result in a listing of priorities of the long-range objectives. Once the priorities have been established, short- range objectives can be set to help achieve the long-range objectives.
a cascade approach
One approach to setting objectives is to have the objectives “cascade” down through the organizational hierarchy. The objective-setting process begins at the top with a clear, concise statement of the central purpose of the organization. Long-range organizational goals are formulated from this statement. The long-range goals lead to the establishment of more short- range performance objectives for the organization. Derivative objectives are then developed for each major division or department. Objectives are then established for the various subunits in each major division or depart- ment. The process continues on down through the organization.
The following items represent potential areas for establishing objectives in most organizations:
1. Profitability 2. Markets 3. Productivity 4. Product
5. Financial resources 6. Physical facilities
7. Research and innovation 8. Organization
9. Human resources 10. Customer service
concerns of control
In order to maintain stability, the manager must be sure that the organiza- tion is operating within its established boundaries of constraint. The next concern is objective realization, which requires continual monitoring to ensure that adequate progress is being made toward the accomplishment of established objectives.
At top management levels, a problem occurs whenever the organization’s objectives are not being met. At middle and lower levels of management, a problem occurs whenever the objectives for which the manager is respon- sible are not being met. All forms of management control are designed to provide the manager with information regarding progress. Once the man- ager has this information, it can be used for several purposes:
1. To prevent crises 2. To standardize output
3. To appraise employee performance 4. To update plans
5. To protect an organization’s assets written reports
There are two basic types of written reports, analytical and informational.
Analytical reports interpret the facts they present. Informational reports only present the facts.
Preparing reports
Preparing a report is a four- or five-step process depending on whether it is informational or analytical.
1. Planning the attack 2. Collecting the facts 3. Organizing the facts
4. Interpreting the facts (analytical only) 5. Writing the report
correcting for deviations
All too often, managers set standards and monitor results but do not fol- low up with appropriate corrective actions. The first two steps are of little value if corrective action is not taken. The steps for effective corrective actions are as follows:
1. Identify the problem.
2. Perform an investigation to determine the cause of the problem.
3. State the cause of the problem.
4. Determine a solution for the cause and implement it.
5. Prove the solution removed the cause.
importance of value
Persons conducting a business do so with the expectation of increasing value. To accomplish this, they use their outputs to produce goods and
services that are demanded in the marketplace. They sell their products and services and, in return, use outputs to produce more goods and ser- vices. To be successful, they must sell their goods or services to their cus- tomers for an amount greater than the cost of producing them. To do this, they must ensure the value of the outputs produced. The relationship of the value to the owner’s outputs may be expressed by the following equation:
Value = Outputs – Nonconformance
Most businesspeople find that they are unable to conduct their business satisfactorily using only financial measures.
basic cOncePts
An organization should have a set of objectives. Management of an orga- nization will require information for determining how well these objec- tives have been achieved.
This focuses on two factors:
1. Whether the goals have been met (effectiveness)
2. Whether they were able to provide products and services with mini- mal nonconformities (efficiency)
In general, the purpose in measuring value is to help management control the activities of the firm.
OrganizatiOnal resPOnsibility
Each individual with decision-making authority in an organization has responsibility for some aspect of achieving his or her company’s objec- tives. It is essential to recognize this through the development of the per- formance-logging system. That is, the focus of the value-logging system is on responsibility centers. A responsibility center is an activity or collec- tion of activities controlled by a single individual. In the quality-planning
process, objectives are proposed for each responsibility center. The respon- sibility center then becomes the focal point for control.
The type of responsibility the person in charge can exert classifies responsibility centers. A center is a primary or product-producing center if the person responsible has authority only for producing or provid- ing products or services to the customer. In some cases, this may mean writing a sales order, issuing a purchasing document to purchase raw materials, or producing a product. Examples of primary centers are as follows:
1. Contract review 2. Design control 3. Purchasing
4. Customer-supplied product
5. Product identification and traceability 6. Process control
7. Handling, packaging, storage, preservation, and delivery 8. Servicing
A support center is a center in which the manager has authority only for providing management information or internal services, with regard to primary centers’ efficiency and effectiveness, within the organization.
In some cases, this may mean writing business performance statements or financial statements, or providing training to employees. Examples of support centers are as follows:
1. Document control 2. Inspection and testing
3. Control of inspection, and measuring and testing equipment 4. Inspection and test status
5. Control of nonconforming product 6. Corrective and preventative action 7. Control of quality records
8. Internal quality audits 9. Training
In measuring value, a distinction is made between the performance of a responsibility center and the performance of its manager. For
decisions concerning whether the organization should continue to provide a product or service, all outputs and nonconformance for a responsibility center are accumulated. This practice allows manage- ment to make such decisions as whether the company should continue the process or not.
In contrast, only a subset of activity outputs and nonconformance is accumulated for measuring managerial performance. Only those noncon- formities over which the manager can exert influence are included in the log for managerial performance. Managerial performance is then mea- sured in part by comparing levels of controllable nonconformance against management’s objectives. In this way, a manager may be judged to have performed efficiently for a given activity.
the rOle OF Quality management
The role of the quality professional has changed dramatically from the days when the quality control manager was simply responsible for the inspection of product. Quality managers are now largely responsible for preparing detailed performance statements; they are asked to help in measuring the effectiveness of operations and suggesting improvements;
and they are involved in identifying and proposing solutions to emerging problems. Quality professionals are primarily responsible for designing the firm’s performance information system and assuring compliance with quality-logging requirements.
In light of the expanding duties involved, the importance of the quality function is usually recognized in a firm’s organizational chart by having the quality executive report directly to the president.
intrOductiOn tO Quality-rePOrting basics
To be useful, performance logging must be assembled and logged objec- tively. Those who must rely on such information have a right to be assured that the data are free from bias and inconsistency, whether deliberate or not. For this reason, performance-logging systems rely on certain
standards or guides that have proved useful over the years in impart- ing valued information. These standards (ISO 9000) are called generally accepted quality principles (GAQP). Because quality is more an art than a science, these principles are not immutable laws like those in the physi- cal sciences. Instead, they are guides to action and may change over time.
Sometimes specific principles must be altered or new principles must be formulated to fit circumstances or changes in business practices.
Because quality principles are based on a combination of theory and practice, there has always been, and probably always will be, some contro- versy about their propriety.
A principle report resulting from the process of accumulating quality information is the business performance or quality report. The business quality report portrays the operating results of primary and support cen- ter activities for a period of time. This log is prepared monthly.
Another basic log is called an activity report or log and is generally required in logging responsibility center activities. This log will be dis- cussed later.
Quality professionals log company transactions, which are the result of an activity in relationship to the amount of nonconformities, to determine performance.
the business Quality rePOrt
The business quality report (also known as a performance report) is a list- ing of the firm’s primary and support responsibility centers’ activities on a given date (see Figure 3.1).
The body of the statement contains four major sections: center activities, number of outputs (assets) generated, amount of nonconformance (nc), and calculated value (percentage).
Outputs (or assets) are the resources of the business that can be expressed as the output of an activity. Outputs can take many forms. Some out- puts may have readily identifiable characteristics. Others may simply represent information used to communicate customer requirements throughout the organization. Examples are sales orders, purchasing
documents, equipment calibration records, and nonconformance logs. Outputs are usually recorded at the acquisition.
Nonconformities are departures of an asset from its intended require- ment, or a state that occurs with a severity sufficient to cause the asset not to satisfy customer requirements.
Value is the result of comparing outputs to nonconformance to determine percent performance for a given activity. Value is calculated as follows:
1− 100
∑ ∑
Nonconformances
Assets ×
Business performance is the collective value of all the activities within a responsibility center. Figure 3.2 shows the different product-produc- ing departments’ scope of performance and where they all intersect.
This intersection is where all activities are in 100 percent coincidence with each other. This means that each function provided exactly what the other function required in order to have a usable output.
This is the optimum performance area of the business. The larger the
Red Bead Company Performance Report January 30, 20XX
Primary Centers Assests Nc Value (%)
RAW MATERIAL INVENTORY 4.6 Purchasing
Vendor Assessment 150 12 92%
Purchasing Data 300 5 98%
WORK IN PROCESS 450 17 96%
4.3 Contract Review 500 3 99%
4.4 Design Control 25 2 92%
Department A 25000 1500 94%
Department B 12000 150 99%
Department C 5000 250 95%
42000 1900 95%
FINISHED GOODS INVENTORY
4.15 Delivery 250 11 96%
Figure 3.1
Business quality report.
intersection, the better the performance. If all these functions com- pletely overlapped, the organization would be 100 percent efficient.
In practice, this is rarely the case; studies have shown that there is an inherent 3–7 percent error rate no matter what you do.
Performance=
(
SU UE O)
Example: From the Red Bead Company report, overall primary perfor- mance is calculated as follows:
Pp=(.99 92 96 95 96×. ×. ×. ×. ) .= 80 (or 80 percent).
underlying cOncePts
Certain fundamental concepts provide a framework for recording and logging performance. These concepts have been developed over time to provide general guidelines for making business quality reports as objec- tive and as useful as possible.
Any business is an individual unit, separate and distinct from other activities. A separate business quality report would be maintained for each separate business. Outputs are recorded and logged on activity reports or logs to provide a “historical record” of events. Performance activities and
Sales
Engineering
Operations Figure 3.2
Performance diagram.
their results appearing in business quality reports are expressed in terms of units generated.
A performance activity is a business activity that requires quality rec- ognition. Therefore, an event that affects any of the elements in the value equation (outputs or nonconformance) must be logged.
activity rePOrting
The ultimate objective of performance logging is to record the correct number of outputs generated by an activity and the amount of non- conformance. However, for practical reasons there is a very important quality-logging function, preceding the recording of outputs and non- conformance. The outputs and nonconformance are first entered in a pre- liminary record called an activity report or log. The process of recording outputs and nonconformance is called journalizing. After the outputs and nonconformance have been journalized, they are totaled and posted to the performance report or log.
Some of the reasons for activity reporting or logging are as follows:
1. It provides a chronological record of all outputs and nonconfor- mance generated by an activity.
2. It fulfills the need for recording in one place all outputs and noncon- formance for a responsibility center.
3. It provides more information, such as a detailed explanation of nonconformance, than can conveniently be recorded on individual records.
The original sources of information concerning most outputs and non- conformance are quality records. Examples are sales orders, purchasing documents, production logs, and various other types of business papers.
Such records are called source documents. Information obtained from source documents helps in determining the number of outputs generated and amount of nonconformance found. The source documents also pro- vide valuable evidence to support the accuracy of the performance log.
The purpose of the activity report or log is to provide a chronological record of all outputs and nonconformance for a given quality activity. It
includes the date in which the outputs and nonconformance were gen- erated, a description of the nonconformance, and the source document from which the information was collected. The flow of information for performance logging is as follows.
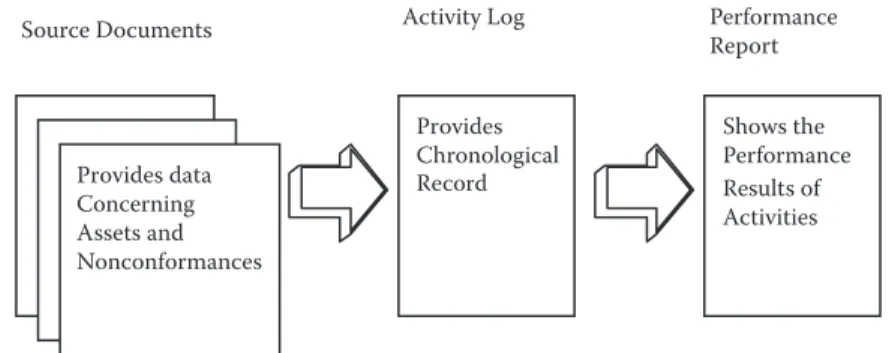
As shown in Figure 3.3, the source documents (quality records) provide the basic information concerning the outputs and nonconformance of each responsibility center activity. The activity report or log represents the first point where data are formally entered in the performance-logging system. Various activity reports or logs may be used, depending on the size of the firm and the nature of their operations.
The simplest form used is a multicolumn form, called an activity report or log (see Figure 3.4). It has columns for the date on which outputs were generated, asset description, total outputs generated, total nonconformance, descrip- tion of nonconformance, and totals for each nonconformance description.
The basic form for the activity report or log is illustrated as follows:
Department block. The name of the department generating the activity report or log is entered into the department block. This is the respon- sibility center for the control of quality.
Activity block. The name of the activity being logged is entered into the activity block, such as subcontractor assessment or production department.
Record used. The name of the source document from which data were taken is entered into the record used block, such as purchase order, sale order, or inspection log.
Source Documents
Provides data Concerning Assets and Nonconformances
Provides
Chronological Shows the
Performance Results of Activities Record
Activity Log Performance
Report
Figure 3.3 Reporting flow.
Date column. The date the asset was generated is entered in the date column. The date is entered on the first row for each asset activity.
Description column. The description column is used to record the asset activity or an explanation of the activity.
Total column. The total number (or sample size taken) of outputs gener- ated by the activity is entered in the total column.
Nc column. The total amount of nonconformance found in the outputs is entered in the Nc column.
Description of nonconformance. Descriptions of the nonconformance are entered in the columns below the title description of nonconformance.
Nonconformance columns. The quantities of the total nonconformance that are attributed to the nonconformance are entered under each nonconformance description.
jOurnalizing PrOcedure
To illustrate the recording of activities in the activity report or log, assume that on May 1, 20xx, John Doe of the Red Bead Company Sales Department took 500 orders from customers. Upon review of these orders, three non- conformities were found. This activity is recorded on the first page of the activity report or log as follows:
activity lOg Page:
Department: Description of Nonconformance
Activity:
Record Used:
Date: Description Total Nc
Figure 3.4
Basic activity report.
The recording of the outputs (sales taken) and nonconformance (includ- ing description of the nonconformance) provides a summary of each day’s activities, which is a valuable reference if there is some future question about the activity.
For example, the Red Bead Company completed the following addi- tional activities during May.
Activity: May 2, 20xx, the Purchasing department wrote 150 purchase orders for raw material purchases and 12 nonconformities were found.
Activity: May 3, 20xx, Department A produced 25,000 units and 1,500 nonconformities were found.
activity rePOrt Page: 1
Department: Sales Description of Nonconformance
Activity: Order Entry
Wrong Price
Wrong Part Number Record Used: Sale Orders
Date: Description Total Nc
5/1/xx Sales Taken 500 3 2 1
activity lOg Page: 1
Department: Production Description of Nonconformance
Activity: Purchasing Wrong
Quantity Ordered
Wrong Part Number Record Used: Purchase Orders
Date: Description Total Nc
5/1/xx Orders Made 150 12 10 2
Activity: May 4, 20xx, Department B made 12,000 units and 150 non- conformities were found.
Activity: May 10, 20xx, Department C produced 5,000 units with 250 nonconformities.
activity lOg Page: 1
Department: Production Description of Nonconformance
Activity: Department B Wrong
Size
<.001”
Out of Tolerance
> .005”
Record Used: Production Work Orders Date: Description Total Nc
5/1/xx P/N 536 12000 150 125 25
activity lOg Page: 1
Department: Production Description of Nonconformance Activity: Department C
Cracked Fading Record Used: Production Work Orders
Date: Description Total Nc
5/1/xx P/N 345 5000 250 175 75
activity lOg Page: 1
Department: Production Description of Nonconformance
Activity: Department A Wrong
Color (Blue)
Out of Tolerance
> .05”
Record Used: Production Work Orders Date: Description Total Nc
5/1/xx P/N 12345 25000 1500 1200 300
Activity: May 12, 20xx, Shipping & Receiving shipped 250 units and 11 shipments were found nonconforming.
In the activities recorded above, there was only one entry. Many business activities require the use of more than one entry. Any entry on the activity report or log requiring more than one entry is added to the next available line until the record is complete. These logs are usually completed by the responsibility center manager and given to the quality organization for posting in the performance log.
POsting
The process by which the outputs and nonconformance are summarized and transferred to activities on the performance log is called posting. It consists of transferring totals for the outputs (total) column and the non- conformance (nc) column on the individual activity reports or logs to the performance log. This is usually performed once a month by the quality organization.
In most businesses, the posting is done either manually or by data- processing methods. The conversion to paperless information systems has become very common among businesses. Posting is illustrated in Figure 3.5.
activity lOg Page: 1
Department: Shipping & Receiving Description of Nonconformance
Activity: Delivery Raw
Mat’l Delay’d
Date Change
Made Record Used: Packing Slips
Date: Description Total Nc
5/1/xx Shipments 250 11 10 1
PrOduct PerFOrmance rePOrting
Inspection records should be maintained that are identifiable to batch, lot, serial number, or work order number. When data are to be taken, define the number of data points and specify the appropriate format for record- ing the data. An activity report or log is maintained providing a chronol- ogy of the inspections performed.
The inspection records should contain the following:
Activity Report
Department: Sales
5/1/×× Sales Taken 500
4.3 Contract Review 4.4 Design Control 4.6 Purchasing
Vendor Assesment Purchasing Data
4.9 Process Control Department A Department B Department C
4.15 Delivery
Primary Performance
25 2
500
150300
450
25000 1500
150250 1900 12000
5000 42000
250 11
12 5 17
3 99%
92%
96%
95%
96%
80%
3 2 1
500
Totals 3 2 1
Wrong
Price Wrong
NumberPart Order Entry
Sale Order Activity:
Record Used:
Date: Description
Red Bead Company Performance Report May 30, 20××
Primary centers Assets Nc Value (%)
Total Nc
Description of Nonconformance
Figure 3.5
Posting to the business quality report.
1. Inspection data and results compared to acceptance criteria. An acceptance decision should be reached for each inspection identi- fying whether or not compliance with acceptance criteria has been achieved. This acceptance or rejection decision should be recorded, dated, signed, and made available for review.
2. Written disposition, waivers, or deviations from authorized organi- zations (e.g., a material review board) for release of nonconforming items and services.
3. Inspection data, including descriptions of any nonconforming items, provided on a timely basis to responsible functions as feedback to be used for trend analysis or process improvement.
analysis
ranked Order analysis
The business quality report and activity reports provide a basis for estab- lishing frequency distributions. The nonconformities become class boun- ties, and the numbers of nonconformities are the cumulative frequency of occurrence. The nonconforming class can then be arranged with the highest-occurring nonconformity at the top on down to the lowest, as shown in Table 3.1.
From Table 3.1, it should be obvious that cracked is the most frequently occurring nonconformity. Hence, this should be the first problem to be corrected.
table 3.1
Ranked Order Analysis Rank Description of
Nonconformity Tally f %
1 Cracked IIIII 5 .33
2 Loosened IIII 4 .27
3 Leaking III 3 .20
4 Sticking II 2 .13
5 Fractured I 1 .07
Summary 15 1.00
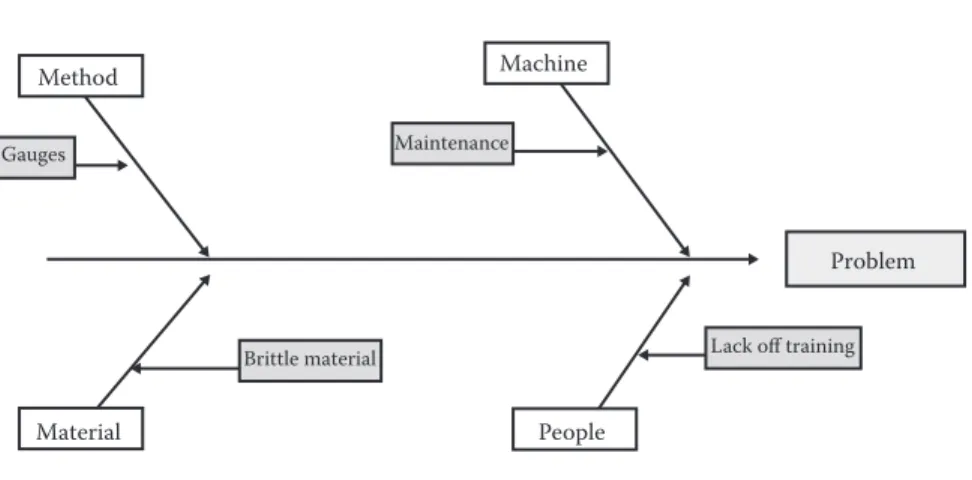
Fishbone diagram
The fishbone diagram shown in Figure 3.6 is used to determine causes and effects which relate to a nonconformity. The major branches of the fishbone diagram are used to determine the major influences that would result in the problem outcome. The braches are as follows:
1. Method: This is the branch where you would describe those factors in the process that would affect the output with regard to the current practices.
2. Machine: Here you would identify those factors which are related to the equipment used in the process.
3. Material: Here you would identify those factors related to the mate- rial used in the process.
4. People: Here you would identify those factors related to the people working within the process.
This technique has proven to be useful in determining the causes of problems. It is interesting to note here that changing any variable in the process will result in a change in the output regardless of whether it is the actual cause.
Method
Material People
Problem Machine
Gauges Maintenance
Lack off training Brittle material
Figure 3.6 Fishbone diagram.
cOntrOlling nOncOnFOrmance identiFicatiOn
identification during workWhen operators are engaged in an activity to produce a product, the act of regulating or making modifications is considered a component of that activity. In essence, any changes made during the manufacture of a prod- uct are not considered a nonconformity.
completion of work
Nonconformities are usually detected after the completion of work.
This occurs when the completed product (which is the result of work) is inspected with regard to preestablished requirements.
inspection
The purpose of inspection with respect to products is as follows:
1. To provide a basis for action for the product already on hand 2. To decide if the product meets requirements
3. To provide a basis for action with regard to the process 4. To decide if the process requires action
identification of nonconforming Product
When in the course of inspection (by the operator or independent inspec- tor) nonconforming product is detected, it should be identified by some suitable means (e.g., tags, markings, or location).
segregatiOn
short-run ProductionThere are cases where the lot or batch integrity must be maintained. In such circumstances, the nonconforming units must be appropriately iden- tified to ensure against their use. Where integrity of the lot is not an issue,
units should be isolated or removed from the flow of production to prevent unintended use.
long-run Production
In the case of mass production (or continuous, homogeneous flow), non- conforming units must be removed from the process for disposition.
Nonconforming units must be separated from other materials to prevent unintended use.
risk
Associated nonconformance risk levels are defined as follows:
1. Critical: A nonconformity that may cause bodily harm, injury, or death, and/or prevents the product from performing its intended function.
2. Major: A nonconformity that may reduce the life of the product and/
or is readily noticeable by the customer.
3. Minor: A nonconformity that is neither critical nor major.
disPOsitiOn
responsibilities for disposition
Over the years, there have been many ways to determine how to dispose of nonconforming material; the following are some current practices:
1. Material review boards: In some cases, organizations have opted to establish a group of top managers to review nonconforming material for disposition. This requires the consensus of all the managers in the disposition decision.
2. Management: Other organizations have delegated the responsibility for disposition of nonconforming product to a specific departmental manager or managers.
3. Operators: In some cases, due to the nature of the noncon- formity, the operator can dispose of nonconforming material immediately.
cOrrective and Preventive actiOn (caPa) methOdOlOgy
immediate action required
When the nonconformity has an associated risk of critical or major, correc- tive action should be taken immediately. If the nonconformity is detected while the product is in transit to the customer or storage, the customer must be notified at once and the material placed in quarantine.
magnitude of the nonconformity
An analysis should be made of the nonconformities by product to detect statistical trends. This is done using ranked order analysis (see Table 3.1) to determine the most frequently occurring nonconformity for corrective action.
caPa methodology
When performing either corrective or preventive action, the steps are the same. It should be noted that corrective actions are always product-based, whereas preventive actions are process- or system-based. The steps are as follows:
1. Investigate the cause of nonconformities relating to the product, pro- cess, and quality system, and record the results of the investigation.
2. Identify the root cause of issues requiring corrective or preven- tive action.
3. Determine the steps needed to deal with any problems requiring corrective or preventive action.
4. Implement corrective and preventive actions.
5. Apply controls to ensure that corrective and preventive action is taken.
6. Initiate controls to ensure that actions taken are effective.
7. Confirm that relevant information on actions taken is submitted for management review.
summary
Departmental managers are primarily concerned with the efficiency of certain activities in their department which are indicators of their overall performance. By monitoring these activities, departmental managers can prevent, reduce, or eliminate nonconformities, resulting in improved overall value. To do this, they must determine the out- put of each activity and its interrelationship with regard to providing value to the customer. Some activities provide support to achieving the desired output, while others are directly related to or incorporated into the output itself.
Each activity usually has a source document related to the output. This could be a purchase order, packing list, or training record. The documents provide a record of the event in writing, which preserves the knowledge of the transaction. In this way, key data are collected to provide useful information to management.
Once the data have been collected on records, these records must be categorized and summarized to provide a chronology of events related to the department’s output. This chronology usually provides the following information:
1. Number of outputs produced 2. Number of nonconformities found 3. Description of the nonconformities
The departmental managers should establish goals and requirements in writing which are consistent with the overall company performance.
In addition, departmental managers should identify the record used to collect pertinent data.
review QuestiOns
1. What is the purpose of the business quality report?
2. Describe the different types of centers.
3. Define the business quality report.
4. Define the basic activity-reporting process.
5. Describe how overall business performance is calculated.
6. Describe how value is calculated.
7. Describe the three principles of quality control.
8. Describe how goals are defined.
9. Define how the reports are communicated.
10. Explain the following:
A. The business-reporting structure B. Journalizing and posting
C. The product- and project-planning function