BUKTI CORRESPONDING AUTHOR
NUR FADJRIH ASYIK Email: [email protected] Cogent Economics & Finance
The Effect of Male CEO Masculinity Face on Earnings Management: Evidence From Indonesia
1. SUBMITED ARTIKEL (21 Agustus 2022) Bukti dari system
Bukti klarifikasi dari email
Berkas yang disubmit 21 Agustus 2022 Cover Letter
Dear Editor in Chief Cogent Economics & Finance
Here, we submit journal entitled The Effect of Male CEO Masculinity Face on Earnings Management: Evidence From Indonesia. All authors have read and approved the manuscript and take full responsibility for its content. All authors do not have conflict of interest in regard to this research or its funding.
Thank you very much for your attention.
Best regards,
Dr. Nur Fadjrih Asyik, S.E., M.Si., Ak., CA
Associate Professor of accounting of Indonesia School of Economic (STIESIA) Surabaya, Jl. Menur Pumpungan No.30, Menur Pumpungan, Sukolilo District, Surabaya City, East Java 60118, Indonesia WA +62 811-314-545
SCOPUS ID: 57211293999
ORCID: https://orcid.org/0000-0002-6060-7117 E-mail: [email protected]
Paper 21 Agustus 2023
The Effect of Male CEO Masculinity Face on Earnings Management: Evidence From Indonesia
Nur Fadjrih Asyik1*, Muchlis2*, Triyonowati3*, Rusdiyanto4*, Ignatia Martha Hendrati5*, Dian Anita Nuswantara6*, Suyanto7*
1,3Indonesia School of Economic (STIESIA) Surabaya, Jl. Menur Pumpungan No.30, Menur Pumpungan, Sukolilo District, Surabaya City, East Java 60118, Indonesia
2Muhammadiyah University, Surabaya, Jl. Raya Sutorejo No.59, Sutorejo Hamlet, Mulyorejo District, Surabaya City, East Java 60113, Indonesia
1*Corresponding Author Nur Fadjrih Asyik: [email protected]
Associate Professor of accounting and lecturer of Faculty of Economics and Business, Indonesia School of Economic (STIESIA) Surabaya, Jl. Menur Pumpungan No.30, Menur Pumpungan, Sukolilo District, Surabaya City, East Java 60118, Indonesia, Scopus ID: 57211293999.
ORCID: https://orcid.org/0000-0002-6060-7117
2* Author Muchlis: [email protected]
Associate Professor of accounting and lecturer of Faculty of Economics and Business, Muhammadiyah University, Surabaya, Jl. Raya Sutorejo No.59, Sutorejo Hamlet, Mulyorejo District, Surabaya City, East Java 60113, Indonesia.
3*Author Triyonowati: [email protected]
Associate Professor of accounting and lecturer of Faculty of Economics and Business, Indonesia School of Economic (STIESIA) Surabaya, Jl. Menur Pumpungan No.30, Menur Pumpungan, Sukolilo District, Surabaya City, East Java 60118, Indonesia.
4*Author Rusdiyanto: r[email protected]
Assistant Professor of accounting and lecturer of Faculty of Economics and Business, Universitas Airlangga Indonesia, Jl. Airlangga No.4, Airlangga, Gubeng, Surabaya, East Java 60286 Indonesia. Scopus ID: 57238673100. ORCID: https://orcid.org/0000-0002-7456-7072
5* Author Ignatia Martha Hendrati: [email protected]
Associate Professor of economic development and lecturer of Faculty of Economics and Business, Universitas Pembangunan Nasional Veteran Jawa Timur, Jl. Rungkut Madya No.1, Gunung Anyar City Surabaya East Java 60294, Indonesia.
Scopus ID: 57208886041, ORCID: https://orcid.org/0000-0002-1693-409X
6* Author Dian Anita Nuswantara: [email protected]
Associate Professor of Accounting and Lecturer of Faculty of Economics and Business, Universitas Negeri Surabaya, Jl. Lidah Wetan, Lakarsantri, Surabaya, Jawa Timur 60213, Indonesia..
Scopus ID: 57200395873, ORCID: https://orcid.org/0000-0002-7124-3099
7*Author Suyanto: [email protected]
*Associate Professor of Law and Lecturer of the Faculty of Law, Universitas Gresik, Jl. Arif Rahman Hakim Gresik No.2B, Gresik, Kabupaten Gresik, Jawa Timur 61111, Indonesia
Scopus ID: 58038299500, ORCID: https://orcid.org/0000-0002-4640-5084
4, 7, 8Universitas Airlangga Indonesia, Jl. Airlangga No.4, Airlangga, Gubeng, Surabaya, East Java 60286 Indonesia
5Universitas Pembangunan Nasional Veteran Jawa Timur, Jl. Rungkut Madya No.1, Gunung Anyar Kota Surabaya Jawa Timur 60294, Indonesia
6Universitas Negeri Surabaya, Jl. Lidah Wetan, Lakarsantri, Surabaya, Jawa Timur 60213, Indonesia
7Universitas Gresik, Jl. Arif Rahman Hakim Gresik No.2B, Gresik, Kabupaten Gresik, Jawa Timur 61111, Indonesia
Corresponding Author: [email protected] Abstract
Purpose: This study aims to obtain empirical evidence of the effect of male CEO masculinity face on earnings management, the research seeks to identify the effect of male CEO masculinity face on earnings management, research to prove the consistency of the influence of male CEO masculinity face on earnings management variables.
Design/ Methodology/ Approach: This study uses a quantitative approach with a population and research sample using companies listed on the Indonesia Stock Exchange in 2016-2021. This study collects facial images identified as male CEOs from data from the Indonesia Stock Exchange website and company websites and utilizes Google searches. The data analysis method in this study uses Regression Ordinary Least Square (OLS) with Stata Software. Stata software is one of the Regression completion procedures that has a high degree of flexibility in research that connects theory and data that can be carried out on research variables.
Finding: The findings explain that the higher the masculinity face value of male CEOs has an impact on increasing earnings management, and vice versa, the lower male CEO masculinity faces have an impact on decreasing earnings management. The findings support agency theory, behavioral consistency theory and Upper Echelon Theory.
Research implications: The practical implications of the results of this study can help the Indonesian Institute of Accountants in developing behavioral accounting in Indonesia. The theoretical implications of the findings can empirically explain Agency Theory, Behavioral Consistency Theory and Upper Echelon Theory. The policy implications of the results of this study can provide empirical evidence that the face of male CEO masculinity is a determinant of earnings management practices.
Originality/value: As long as the researchers' observations so far in Indonesia, there has been no research on the topic of male CEO masculinity associated with earnings management in Indonesia, the role of male CEO characteristics has an influence on earnings management practice policies. This study compares the results of previous findings (Jia, et al 2014) conducted in the United States for the sampling period from 1996-2010.
While this research was conducted in Indonesia, the sampling period was from 2016-2021.
Keywords: CEO Male Masculinity, earnings management, Stata JEL Classification: G02, G32, G34, M1, Z1
1. Introduction
Jensen & Meckling, (1976) Explaining in agency theory explains the relationship or contract between the principal and the agent. The principal employs the agent to perform tasks on behalf of the principal, including the delegation of decision-making authorization from the principal to the agent, where the agent is represented by a male CEO. (Mahiswari & Nugroho, 2014). Companies listed on the Indonesia Stock Exchange whose capital consists of shares, shareholders act as principals while male CEOs act as agents. CEO characteristics have an influence on earnings management (Shefer & Frenkel, 2005). Meanwhile, according to the behavioral consistency theory, (Epstein, 1979) explained that the face of male CEO masculinity is correlated with testosterone, aggressiveness and social status have an effect on earnings management.
The decision-making process characteristic of male CEOs is divided into two decision models, rational and incremental models (Fredrickson, 1984; Fredrickson & Mitchell, 1984; Miller & Friesen, 1983). In addition to the two requirements retrieval, there is a need for comprehensiveness model
taking process. The process that leads to a rational planning model that is complete with alternatives to the incremental process that relies on intuition and speed in decision-making characteristics of male CEOs, at the end of the decision should be implemented strategic practices. In the implementation process, a measuring tool is needed to assess and evaluate the results of an informational strategy that can help a strategy model that can examine a strategy (Jarzabkowski &
Kaplan, 2015; Kaplan, 2011; Vaara & Whittington, 2012). In this case, it certainly affects and determines the quality of decisions made by a leader. Hambrick & Mason, (1984) explains in the upper echelons theory that the company is a picture of the leaders in the company.
While the use of variable earnings management is based on the opinion of (Scott, 2015) which explains that earnings management is a practice in the process of compiling financial statements that do not violate generally accepted accounting principles, so as to increase or decrease accounting profit as desired by the agent. The agent as the manager of the company knows more data about the state of the company and the company's prospects in the future than the principal, the agent is the management party represented by the characteristics of the male CEO in managing the company. Earnings management can be seen in the attitude of agents with agency theory (Jensen & Meckling, 1976). So as to provide empirical evidence that the masculinity of the male CEO's face has an effect on earnings management. The findings are expected to complement the literature to provide empirical evidence of the disclosure of the influence of the masculinity face of male CEOs on earnings management that has not been carried out in Indonesia, so that it can provide empirical evidence in the field of behavioral accounting.
The face of masculinity is a concept of masculine behavior that exists in men which has implications for aggressive nature, has a hard character, tends to be emotional in taking action (Jewitt, 1997). Male CEO masculinity face is correlated with testosterone, aggressiveness and social status have an influence on earnings management practices ((Kamiya et al., 2018b)(Kamiya et al., 2018b)Jia dkk., 2014). The number of male CEOs of companies listed on the Indonesia Stock Exchange in 2016 to 2021 has grown. This development has become an important issue in companies listed on the Indonesia Stock Exchange. The characteristic role of male CEOs has an impact on the development of companies in Indonesia. The positive impact can be seen from the increase in the number of business units, proving that the economy in Indonesia is getting better and more business units are listed on the Indonesia Stock Exchange (Tanjaya & Santoso, 2020).
The face of masculinity has factors that can affect the performance of a male CEO in managing the company (Tanjaya & Santoso, 2020). The face of masculinity is a personal aspect, the face of one's masculinity is carried from birth. Kamiya dkk., (2018) described in the neuroendocrinology literature that facial masculinity in men predicts masculine behavior and aggressive behavior. The face of high masculinity male CEOs can be predicted to be more aggressive in managing the company (Tanjaya & Santoso, 2020).
Bertrand & Schoar, (2003) explained that the characteristics of male CEOs have an influence on the company's decision-making process. Characteristics of male CEOs are confident and often practice earnings management. The nature of excessive trust is characteristic of male CEOs who often practice earnings management (Graham, Harvey, dan Puri, 2013; Kamiya dkk., 2018; Malmendier &
Tate, 2005), acquisition (Doukas & Petmezas, 2007; Kim, 2013; Kamiya dkk., 2018), innovation (Hirshleifer, Low, & Teoh, 2012; Kamiya dkk., 2018). Research in the field of neuroendocrinology explains that a man's face has an influence on a person's aggressive behavior. Whereas (Carré &
McCormick, 2008; Christiansen & Winkler, 1992) explained that the face of male masculinity has an influence on aggressive behavior. Campbell., dkk (2011) explains that the face of masculinity has an influence on a man's behavior. Wong dkk., (2011) explained that the characteristics of male CEOs
tend to negotiate for personal gain. Therefore (Stirrat & Perrett, 2010) explained that men who have a high masculinity face are considered trustworthy. Therefore (Kamiya dkk., 2018; Kamiya, & Park, 2017; Wong dkk., 2011) provides empirical evidence that the characteristics of male CEOs who have higher masculinity faces have better performance than the characteristics of male CEOs who have lower masculinity faces. This study seeks to provide empirical evidence that male CEO masculinity has a positive effect on earnings management.
2. Literature Review and Hypothesis Development 2.1 Agency Theory
Agency theory is defined as a consequence of the differentiation of control characteristics of male CEOs as agents having direct access to company information data as compared to shareholders.
The relationship between the characteristics of a male CEOs as an agent and shareholders delegating authority to the characteristics of a male CEO as an agent to manage the company is explained in (Jensen & Meckling, 1976). A male CEO's as an agent should have the same objective as shareholders do, which is to improve the company through shareholder prosperity, but male CEOs as agents may have their own thoughts that are contrary to what shareholders think (Mayangsari, 2001). As a conclusion, agency theory offers an important solution to male CEOs' decision-making characteristics in the face of corporate earnings management. Jensen & Meckling, (1976) define agency costs in three categories: monitoring, bonding, and residual. Eisenhardt, (1989) The agency theory consists of three human nature assumptions, namely: (1) humans are generally selfish, (2) humans have limited thinking power in terms of future perceptions, and (3) humans avoid risk at all costs. From the concept of human nature, it can be seen that the usual role of male CEOs affects the company's earnings management.
2.2 Behavior Consistency Theory
Epstein, (1979) explains that the facial masculinity of male CEOs correlates with testosterone, aggressive, and social status affects earnings management, seen from the perspective of behavioral consistency theory. He also discusses how behavioral consistency could be used to predict a majority of people within a given time span. The theory of behavioral consistency is assumed to be the opinion of a person's ability to affect issues that trigger emotions to emerge; consistency of behavior can be shown as a particularly selected subject; consistency of behavior is described in the study with the title: "The Stability of Behaviour: I. Predicting Most of the People Much the Time”.
2.3 Upper Echelon Theory
Upper Echelon theory developed (Hambrick & Mason, 1984) explain the assumptions that will occur in a company by studying the characteristics of the company's top management team. Hambrick
& Mason, (1984) describes the distinguishing characteristics that are influenced by the characteristics of male CEOs on psychological aspects in terms of cognitive in managing the company. The decision- making process was initially divided into two models, namely rational and improvement (Fredrickson, 1984; Fredrickson & Mitchell, 1984; Miller & Friesen, 1983). The rational model focuses on prudence, completeness of information, good planning and analysis, with various alternatives and choosing the best alternative (Camillus, 1981; Quinn dkk., 1988). On the other hand, the Incremental model relies more on intuition, speed, spontaneity and not in a formal environment because it realizes that there are limitations in terms of rationale or budget. (Ismail & Zhao, 2017). In the rational model approach, the role of a leader (Selznick, 1996) environmental factor (Andrews dkk., 1971) and strategic decision models developed (Quinn dkk., 1988) impact on the quality of the company's decision-making. In the incremental model approach, the strategic formulation of the decisions taken is a dynamic that will work (Mintzberg, 1978). This rational model process is then
used as a starting point to develop a more comprehensive and complete model to conduct a more complete and thorough study (Fredrickson, 1984). A comprehensive approach is considered to provide sharpness in seeing opportunities and provides stability when execution is carried out with caution, thereby reducing the risk of failure. (Quinn dkk., 1988; Eisenhardt, 1989b). The holistic approach has its drawbacks when dealing with a dynamic environment, because a dynamic business environment requires speed of decision making (Eisenhardt & Bourgeois, 1988)
2.4 Face, Testosterone, and Behavior
Previous research has provided empirical evidence of a link between testosterone and masculine behavior. A CEO's face may be the basis for male facial linkages to topics in this study. (Jia et al., 2014) explains that a man's face can predict masculine behavior. Based on laboratory evidence, (Carré
& McCormick, 2008; Christiansen & Winkler, 1992) claim that a man's face predicts aggressive traits.
Men's faces affect masculine behavior (Eisenegger, Naef, Snozzi, Heinrichs, & Fehr, 2010; Jia et al., 2014). Jia et al., (2014) explain that the relationship between testosterone and male CEOs’ behavior affects the brain both before birth and during growth. A group of nerve cells plays a role in the processing of memories and emotional reactions as mediators between testosterone in brain regions to evaluate social interactions (Bos et al., 2012; Jia et al., 2014).
Testosterone regulates adolescent spurt (Johnston et al., 2001). Adolescents' development is affected by testosterone (Verdonck et al., 1999; Jia et al., 2014). Previous research indicates that male and female growth differs in the bizygomatic (the area between the left and right cheeks), however, there is no difference in the growth period for upper facial height (Jia et al., 2014). The findings provide empirical evidence that testosterone does affect the development of the male face (Folstad &
Karter, 1992). Meanwhile, according to (Jia et al., 2014; Alrajih & Ward, 2014), men's looks affect masculine behavior during their growth. Further, the findings of (Lefevre et al., (2013) provide empirical evidence that there is indeed a connection between testosterone and the ratio of male facial width. Some other studies suggest that the ratio of a man's face width to testosterone has a beneficial link. In addition, testosterone has a positive relationship with the face, as suggested by previous research (Lefevre et al., (2013). Higher or lower testosterone in men affects the facial masculinity, according to (Jia et al., 2014; Pound, Penton-Voak, & Surridge, 2009).
2.5 Earnings Management
According to (Sulistyanto, 2008; Lestari & Ningrum, 2018) explained that there are three patterns of earnings management that can be done by the management. First, income increasing raises the company's profit greater than the actual profit, the management wants the company's performance to be seen as good. Second, income decreasing, the management wants the company's performance to be lower than the actual performance, the management can lower the company's profit. Third, income smoothing, the management performs to control the financial statements, the management wants the profits to remain unchanged from the previous year, so that profits appear stagnant throughout certain periods. (Lestari & Ningrum, 2018).
According to (Scott, 2015) argues that earnings management is a practice in the process of compiling financial statements that does not violate generally accepted accounting principles, so that it can increase or decrease accounting profit as desired by the management. The management as the manager of the company knows more data about the state of the company and the company's prospects in the future than the shareholders. Earnings management can be seen in the opportunistic attitude of the management with agency theory (Jensen & Meckling, 1976). The management as a manager tries to prioritize his personal interests at the expense of the interests of shareholders
reflecting the opportunistic behavior of the management. Conflicts of interest occur between management and shareholders arise because both have different interests (Jensen & Meckling, 1976).
Model Jones
Model (Jones, 1991) propose a model that simplifies the assumption that nondiscretionary accruals are constant. This model seeks to regulate the impact of changes in the company's
economic area on non-discretionary accruals. Model (Jones, 1991) for nondiscretionary accruals in the year concerned with the following formula:
(1) Calculating TA (total accrual) i.e. net profit for year t less operating cash flow for year t with the following formula::
TAC = NIit – CFOit
The following is an estimate of total accrual (TA) using the Ordinary Least Square method:
= β1 ( ) + β2 ( ) + β3 ( )+ Ꜫ
(2) The NDA (non-discretionary accruals) are calculated using the formula above, which includes the regression coefficient:
NDAit = β1 ( ) + β2 (- - ) + β3 ( ) + Ꜫ
(3) Finally, the formula for determining DA (discretionary accruals) as a metric of Earnings Management is as follows::
DAit = - NDAit
Description:
NDAit = Non discretionary accruals of the corporation i in the period of years t TACit = Total accruals of the corporation i in the time/period t
NIit = Net profit of the corporation i in the time/period of years t CFOit = Corporation's operating cash flow in year t
Ait-1 = Total assets of corporation i in the time/period t-1
∆Revit = The revenue of the corporation i in year t is reduced by the revenue company I in year t-1
PPEit = Fixed assets of the corporation i in the time/period t
DAit = Discretionary accruals of the corporation i in the time/period to t
∆Recit = Accounts receivable of the corporation i in year t minus the income of the corporation i in year t-1
ε = Error
Model (Dechow dkk., 1995) explained that from the calculation results model (Jones, 1991) shows that this model is successful in proving the variation of total accruals. Assumptions implicit in the model (Jones, 1991) that income is not discretionary. If revenue is managed through revenue discretionary, then Model (Jones, 1991) could remove from earnings managed by proxy
discretionary accruals. Model (Jones, 1991) explained that total accruals related to revenue can extract discretionary accrual components, earnings management estimates are biased towards zero.
Model Kothari dkk., (2005)
In this study, the measurement of earnings management uses the model (Kothari dkk., 2005) refinement of the model (Jones, 1991), by including return on assets to control the company's financial performance. This model argues that by including the element of return on assets in calculating discretionary accruals, it can minimize specification errors to measure earnings
management more accurately, with the formula from the model (Jones, 1991) modified model (Kothari dkk., 2005) with the following formula:
(1) Calculate total accrual (TAC) which is net income in year t minus operating cash flow in year t with the following formula:
TAC = NIit – CFOit
Furthermore, total accrual (TA) is estimated using Ordinary Least Square (OLS) as follows:
= β1 ( ) + β2 ( ) + β3 ( )+ Ꜫ
(2) With the regression coefficient as in the above formula, nondiscretionary accruals (NDA) are determined by the following formula:
NDAit = β1 ( ) + β2 (- - ) + β3 ( ) + β4 ( ) + Ꜫ
(3) Finally, discretionary accruals (DA) as a measure of earnings management is determined by the following formula:
DAit = - NDAit
Description:
DAit = Discretionary accruals of company i in period t
NDAit = Nondiscretionary Accruals of company i in year period t TACit = Total accruals of company i in period t
NIit = Net profit of company i in year period t
CFOit = Cash flows from operating activities of company i in year period t Ait-1 = Total assets of company i in period t-1
∆Revit = Company i's revenue in year t is reduced by company i's revenue in year t-1 PPEit = Fixed assets of company i in period t
∆Recit = Accounts receivable of company i in year t minus the income of company i in year t-1
ROAit = Return on assets of company i in period t
ε = Error
2.6 Research Conceptual Framework
The conceptual framework is used to explain the influence between the independent variable and the dependent variable and the control variables used in this study. This study places the face of male CEO masculinity as the independent variable, earnings management as the dependent variable, size, profitability, research & development and leverage as control variables.
Placement of the independent variable on the face of male CEO masculinity, earnings management variable as the dependent variable (Jensen & Meckling, 1976) behavioral consistency theory (Epstein, 1979) and upper echelon theory (Hambrick & Mason, 1984). Agency theory, behavioral consistency theory and upper echelon theory underlie the explanation of the test of the influence of male CEO masculinity faces on earnings management (Jia dkk., 2014). The placement of control variables of size, profitability, research & development costs and leverage refers to agency theory (Jensen & Meckling, 1976) and behavioral consistency theory (Epstein, (1979). Agency theory and behavioral consistency theory underlie the explanation of the test of the effect of variable size, profitability, leverage and research & development costs on earnings management variables (Kadim
& Sunardi, 2019; Kamiya dkk., 2018). Based on the explanation above, the conceptual framework of this research can be seen in the following figure:
Independent Variable (X) Male CEO Masculinity Face (fWHR)
Dependent Variable (Y) Control Variable
Earnings Management (EM) Size (Size)
Profitability (ROA)
Research & Development (R&D) Leverage (LEV)
Figure 1: Research Conceptual Framework 2.7 Research Hypothesis
This study aims to examine and evaluate the effect of male CEO masculinity faces on Earnings Management.
2.7.1 The Face of Male CEO Masculinity Has a Positive Effect on Earnings Management
Agency theory basically discusses the form of agreement between shareholders and management in managing the company, the management bears a great responsibility for the success of the company it manages. Jensen & Meckling, (1976) explain agency relationships arise when shareholders employ management decision-making. In practice, the management as the manager of the company certainly knows more internal information and the company's prospects in the future than the shareholders. So that the management has an obligation to provide information about the condition of the company to shareholders. But in this case the information submitted by the management is sometimes not in accordance with the actual conditions of the company (Jensen &
Meckling, 1976).
Male CEO masculinity face is correlated with testosterone, aggressive, confident has an influence on earnings management, viewed from the perspective of behavioral consistency theory (Epstein, (1979). Strategic leadership is an integral part of the strategy formulation process in a company. The characteristic role of the leader in Upper Echelon Theory is to decide, implement, and ensure the strategy goes well (Hambrick & Mason, 1984). Tenggono & Syamlan, (2021) explains that an organization is a reflection of the characteristics of its leaders. Strategic leadership is the ability of a leader characteristic to empower his team to anticipate conditions that occur in the business environment, strategic leadership is very closely related to strategic change, the relationship between the two is clearly seen that anticipation of changes in the outside world will be responded by the leader by making strategic changes to achieve sustainability from competitive advantage (Tenggono
& Syamlan, 2021).
Previous research has explained that the masculinity of male CEOs has a positive influence on earnings management (Jia dkk., 2014). According to (Fee dkk., 2013; Bolton & Bruunermeier, 2008;
Jia dkk., 2014) explained that the development of research linking accounting practices with the characteristics of top management. The development of research in accounting, finance, and economics extends to the characteristics of male CEOs in the company's policy making process (Fee dkk., 2013; Bolton & Bruunermeier, 2008; Jia dkk., 2014). Bertrand & Schoar, (2003) explained that the role of male CEO characteristics has a positive influence on the process of presenting the company's financial statements. According to (Bamber dkk., 2010; Brochet dkk., 2011; Dyreng dkk., 2010; Feng dkk., 2011; Ge dkk., 2011; Jia dkk., 2014) provide empirical evidence that the
characteristics of male CEOs have a positive influence on earnings management. According to (Chava dkk., 2010; Jia dkk., 2014) provide empirical evidence that the characteristics of male CEOs are the result of the resulting incentives. According to (Dikolli dkk., 2012; Jia dkk., 2014) provide empirical evidence that certain characteristics of male CEOs have excessive trust in earnings management practices. According to (Jia dkk., 2014) provides empirical evidence that the masculinity of male CEOs has a positive influence on earnings management practices. By combining all the arguments described above, so that the first hypothesis proposed in this study is as follows:
H1: The Face of Male CEO Masculinity Has a Positive Effect on Earnings Management 3. Methodology
3.1 Types and Approaches to Research
This research uses a quantitative approach to give meaning to the interpretation of statistical figures (Aliyyah, Siswomihardjo, et al., 2021; Prasetio et al., 2021). The research aimed to provide empirical evidence of the effect of male CEO masculinity on earnings management. Explanatory research is used in the design process (Endarto, Taufiqurrahman, Kurniawan, et al., 2021; Indrawati et al., 2021). Companies listed on the Indonesia Stock Exchange from 2016 to 2021 were used in the population and research samples. The researchers collected data from the Indonesia Stock Exchange website and company websites, as well as Google searches, to obtain figures of faces identified as male CEOs within a period between 2016 and 2021. Regression ordinary least square (OLS) with Stata Software was used to analyze the data in this study. One of the regression completion procedures, Stata has a high degree of flexibility in research that connects theories, concepts, and data that can be done on variables in research.
3.2 Operational Definition and Measurement
Male CEOs' masculinity is the independent variable, earnings management is the dependent variable, and the variable of size, profitability, research & development and leverage is the control variable.
3.2.1 Variable Independent (fWHR)
Independent variable is a variable that can affect other variables (Abadi et al., 2021; Aliyyah, Prasetyo, et al., 2021) This study used male CEO masculinity facial variables as the independent variable. The facial masculinity is a concept of masculine behavior that exists in men having implications on aggressive behavior, having a tough character, having a tendency to be emotional in carrying out their actions (Jewitt, 1997). ImageJ software was used to measure male CEOs’ facial masculinity variables, this study changed the male CEO's face figure to a gray-scale figure with a height of 8 bits (Kamiya et al., 2018).
For the face of each male CEO inside the ImageJ software, the researchers selected a location in the face figure and dragged the mouse to another location to measure the distance, the vertical line size represents the distance between the upper lip and the highest point of the eyelid. The horizontal line represents the maximum distance between the left and right cheeks, while the vertical line represents the minimum length (Kamiya et al., (2018). Therefore, the study independently provided photo quality scores from zero to three based on the following guidelines:
0: Poor posture in which (1) only one ear is visible due to the person's sideways posture; or (2) the photographer photographed the face figure from below or above, causing face height measurement problematic.
1: One ear seems to be perfect, but because the person is facing to the side, only half of the other ear is visible.
2: The person looks straight ahead and both ears are visible with roots on the face.
3: Perfect posture, with both ears clearly visible to the roots, and the person is looking straight ahead.
Based on the criteria of (Kamiya et al., 2018), the study used quality scores of two and three.
The measurement scale of this study used the percentage ratio scale which can be seen in the following figure:
Figure 2: Male CEO Masculinity Face Measurements (fWHR) Description
Horizontal line : Represents the maximum distance between the left and right cheeks.
Vertical Line : Represents the distance between the upper lip to the highest point of the eyelid
3.2.2 Dependent Variable (Y)
The dependent variable is a variable whose value cannot be influenced by other variables. The dependent variable in this study earnings management in this study is defined and its measurement is described as follows:
3.2.2.1 Earnings Management (EM)
Earnings management is a practice in the process of preparing financial statements, so that it can increase or decrease accounting profit as desired by the management. The management as the manager of the company knows more data about the state of the company and the company's prospects in the future compared to shareholders (Scott, 2015). Earnings management in this study uses the measurement model (Kothari dkk., 2005) refinement of fashionl (Jones, 1991) By including return on assets, this model adds return on assets in the calculation of discretionary accruals, so as to measure earnings management more accurately. The measurement scale of this study uses a percentage ratio scale. Here's the model equation (Kothari dkk., 2005) with the following formula:
(1) Calculate total accrual (TAC) which is net income in year t minus operating cash flow in year t with the following formula:
TAC = NIit – CFOit
Furthermore, total accrual (TA) is estimated using Ordinary Least Square (OLS) as follows:
= β1 ( ) + β2 ( ) + β3 ( )+ Ꜫ
(2) With the regression coefficient as in the above formula, nondiscretionary accruals (NDA) are determined by the following formula:
NDAit = β1 ( ) + β2 (- - ) + β3 ( ) + β4 ( ) + Ꜫ
(3) Finally, discretionary accruals (DA) as a measure of earnings management is determined by the following formula:
DAit = - NDAit
Description:
DAit = Discretionary accruals of company i in period t
NDAit = Nondiscretionary Accruals of company i in year period t TACit = Total accruals of company i in period t
NIit = Net profit of company i in year period t
CFOit = Cash Flows from operating activities of company i in year period t Ait-1 = Total assets of company i in period t-1
∆Revit = Company i's revenue in year t is reduced by revenue company i in year t-1
PPEit = Fixed assets of company i in period t
∆Recit = Accounts receivable of company i in year t minus the income of company i in year t-1
ROAit = Return on assets of company i in period t
ε = Error
3.2.3 Control Variable
The control variable is a variable to control the causal relationship so that it is better to obtain a more complete and better empirical model (Riadi dkk., 2021). So that this variable can affect the indications being studied. Placement of control variables following previous research (Kamiya dkk., 2018), The control variables used in this study consist of size, profitability, leverage and research &
development.
3.2.3.1 Size (Size)
Size is a value that can classify companies into large or small types that are sourced from total assets, log size. The greater the total asset, the greater the size. So that the transactions carried out are more complete (Kamiya dkk., 2018). Noviyana & Rahayu, (2021) explain the size measurement scale using firm size with the following formula:
SIZE = Ln total asset 3.2.3.2 Profitability (ROA)
Profitability is a tool that can be used to evaluate investments that have been invested by investors and are able to provide the expected returns. Measurement of profitability using Return on assets which describes the distribution of net income divided by total assets (Kamiya dkk., 2018).
The measurement scale of this study uses a percentage ratio scale, with the following formula:
Return on asset =𝑁𝑒𝑡 𝑃𝑟𝑜𝑓𝑖
𝑇𝑜𝑡𝑎𝑙 𝐴𝑠𝑠𝑒𝑡 Description
Return on asseti,t = Return on assets of company i in year t Net profiti,t = Net profit of company i in year t Total asseti,t = Total assets of company i in year t 3.2.3.3 Research & Development (R&D)
Research & development is an investment made by the company on the basis of new knowledge, to produce more efficient product methods based on existing resources. Research cost of research & development is measured using the ratio of research & development intensity (Padgett &
Galan, 2010; Arifian & Yuyetta, 2012) with the following formula:
Research & Development = 𝑡𝑜𝑡𝑎𝑙 𝑟𝑒𝑠𝑒𝑎𝑟𝑐ℎ & 𝑑𝑒𝑣𝑒𝑙𝑜𝑝𝑚𝑒𝑛𝑡 𝑒𝑥𝑝𝑒𝑛𝑑𝑖𝑡𝑢𝑟𝑒
𝑆𝑎𝑙𝑒𝑠
Description:
Research & Developmenti,t = Research & development i in year t
Total Research & Development Expenditurei,t = Total Research & Development Expenditure i in year t
Salesi,t = Sales i in year t
3.2.3.4 Leverage (LEV)
Leverage describes the division of total liabilities by total assets. This financial ratio explains the amount of assets owned by the company which is financed by liabilities. The greater the value of the liability, the greater the impact felt by investors to receive the profits they receive (Kamiya dkk., 2018). Leverage measurement uses the result of dividing total liabilities by total assets (Kamiya dkk., 2018). The measurement scale of this study uses a percentage ratio scale with the following formula:
Leverage = Description:
Leveragei,t = Leverage i in year t
Total Liabilitasi,t = Total liabilities of company i in year t Total Aseti,t = Total assets of company i in year t 3.3 Data Analysis Techniques
Data analysis is part of the data testing process after the selection and collection stage of research data. Data analysis is interpreted as estimating or determining the magnitude of the quantitative influence of the change of an event on something else, as well as predicting or estimating other events (Sudaryanto et al., 2022; Utari, Sudaryanto, et al., 2021).
3.3.1. Descriptive Statistics
Descriptive statistics are statistics that can illustrate the research object through analytical data, without doing analysis (Prasetyo, Aliyyah, Rusdiyanto, Utari, et al., 2021; Utari, Iswoyo, et al., 2021) from the data of male CEO facial masculinity variable, Earnings management variable, size variable, profitability variable (ROA), Research & Development variable and leverage variable.
3.3.2. Pearson Correlation Test
Parson correlation testing is used to look at the relationship between an independent variable and a dependent variable by assuming the Pearson correlation of the data is normally distributed (Prasetyo, Aliyyah, Rusdiyanto, Nartasari, et al., 2021; Rusdiyanto et al., 2021). Correlation testing produces positive (+) and negative (-) numbers. If the correlation value is positive, it means that the variables move in the same direction, meaning that when the independent variable is large, the dependent variable is also getting bigger. If the value is negative, it means that the variables move in the opposite directions, meaning that if the value of the independent variable is large, then the dependent variable is getting smaller. Correlation numbers range from 0-1 (Endarto,
Taufiqurrahman, Suhartono, et al., 2021; Prasetyo, Aliyyah, Rusdiyanto, Kalbuana, et al., 2021).
Pearsonr correlation formulation is as follows:
} ) ( }{
) ( {
) )(
(
2 2
2
2 X n Y Y
X n
Y X XY
rxy n
Description:
r = Correlation value X = Variable X Y = Variable Y
3.3.3 Research Regression Model
Regression analysis is used to find out how close the relationship between one variable and another variable is. The regression analysis has a function to predict the value of independent variable (Y) if the dependent variable (fWHR) is changed (Prasetyo, Aliyyah, Rusdiyanto, Nartasari, et al., 2021; Rusdiyanto et al., 2021). The method used in this study was panel data regression analysis. Panel data is also called pool data, longitudinal data, and micro panel data. The panel data regression analysis was used to examine the influence of male CEOs’ facial masculinity (fWHR) on earnings management (Y). Based on the independent variables and dependent variables that have been described, an equation model is obtained that will be used as follows:
EMi,t = β0 + β1 fWHRi,t,+ β2 Sizei,t+ β3 ROAi,t,+ β4 R&Di,t+ β5 LEVi,t,+ Ꜫ ………(1) To explain the model of the facial masculinity of male CEOs, variables of earnings management, size, profitability, research & development and leverage can be explained as follows:
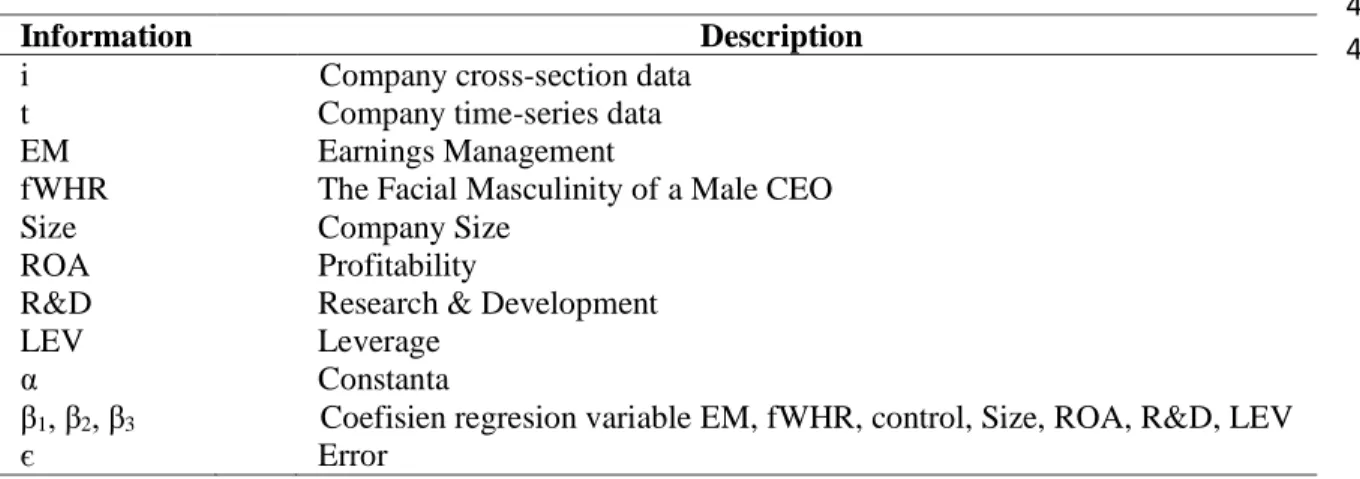
Table 1: Variable Description
4.
4.
4.Research and Discussion Results 4.1 Descriptive Statistics of Variables
The results of descriptive statistics can be presented with minimum, maximum, mean, and standard deviation of the variables studied from the sample companies. In addition to presenting based on a sample of all companies listed on the Indonesia Stock Exchange from 2016 to 2021, the figure also shows the testing of this sample based on the company:
Table 2: Descriptive Statistics
Variables Dependent Obs Mean Std. Dev. Min Max p1 p99 Skew. Kurt.
Earnings Management 1925 .003 .007 0 .046 0 .036 3.132 12.117
Variables Independent Obs Mean Std. Dev. Min Max p1 p99 Skew. Kurt.
fWHR 1781 2.086 6.287 .11 267 1.34 2.79 42.038 1771.784
Variables Independent Obs Mean Std. Dev. Min Max p1 p99 Skew. Kurt.
Size 1925 23.12 5.011 11.862 31.592 12.927 30.952 -.269 1.746
ROA 1925 .078 .108 0 .925 .001 .528 3.626 20.785
R&D 170 15.234 2.549 6.234 21.802 6.491 21.797 -.19 4.575
Leverage (LEV) 1925 .482 .246 0 .99 .01 .93 -.041 2.107
The table output variables dependent stata above shows the number of observations (N) was 1925. From these 1925 observations, the earnings management value minimum was .0, and the earnings management value maximum was 0.046, the average value of 1925 observations or the mean was of 0.003 with a standard deviation of 0.007. The table variables independent output stata above
Information Description
i = Company cross-section data t = Company time-series data
EM = Earnings Management
fWHR = The Facial Masculinity of a Male CEO
Size = Company Size
ROA = Profitability
R&D = Research & Development
LEV = Leverage
α = Constanta
β1, β2, β3 = Coefisien regresion variable EM, fWHR, control, Size, ROA, R&D, LEV
є = Error
shows the number of observations (N) was 1781. From these 1781 observations, the value of male CEOs’ facial masculinity minimum was 0.11, and the value of male CEOs’ facial masculinity maximum was 267, the average value of 1781 observations or the mean was of 2.086 with a standard deviation of 6.287. The table variables control output stata above shows the number of observations (N) was 1925. From these 1925 observations, the size value (minimum) was 11.862, and the size value (maximum) was 31.592, The average value of 1925 observations or the mean was of 23.12 with a standard deviation of 5.011, Based on the table output stata above, it can be seen that the number of observations (N) was 1925. From thse 1925 observations, the profitability value (ROA) minimum was 0, and the profitability value (ROA) maximum was 0.925, the average value of 1925 observations or the mean was of 0.078 with a standard deviation of 0.108, Based on the table output stata above, it can be seen that the number of observations (N) was 170. From thse 170 observations, the research
& development minimum was 5.234, and the research & development maximum was 21.502, the average value of 170 observations or the mean was of 15.234 with a standard deviation of 2.549, Based on the table output stata above, it can be seen that the number of observations (N) was 1925.
From thse 1925 observations, the leverage minimum was 0, and the leverage maximum was 0.99, the average value of 1925 observations or the mean was of 0.482 with a standard deviation of 0.246.
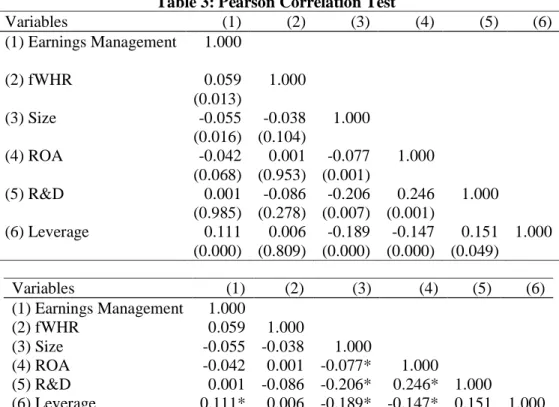
4.2 Pearson Correlation Test
Pearson's correlation test was done to see how strong or how weak the relationship between the facial masculinity of male CEOs and earnings management. In this test, if the Pearson
correlation value (r) is above 0.05 (5%), it means that there is a strong relationship between the facial masculinity of male CEOs to earnings management, but if the Pearson correlation value is below 0.05 (5%), then it means that the relationship between the facial masculinity of male CEOs and earnings management is said to be weak.
Table 3: Pearson Correlation Test
Variables (1) (2) (3) (4) (5) (6)
(1) Earnings Management 1.000
(2) fWHR 0.059 1.000
(0.013)
(3) Size -0.055 -0.038 1.000
(0.016) (0.104)
(4) ROA -0.042 0.001 -0.077 1.000
(0.068) (0.953) (0.001)
(5) R&D 0.001 -0.086 -0.206 0.246 1.000 (0.985) (0.278) (0.007) (0.001)
(6) Leverage 0.111 0.006 -0.189 -0.147 0.151 1.000 (0.000) (0.809) (0.000) (0.000) (0.049)
Variables (1) (2) (3) (4) (5) (6)
(1) Earnings Management 1.000
(2) fWHR 0.059 1.000
(3) Size -0.055 -0.038 1.000
(4) ROA -0.042 0.001 -0.077* 1.000
(5) R&D 0.001 -0.086 -0.206* 0.246* 1.000
(6) Leverage 0.111* 0.006 -0.189* -0.147* 0.151 1.000
*** p<0.01, ** p<0.05, * p<0.1
Based on the table above, it can be interpreted that the earnings management variable, the facial masculinity of male CEOs, size, Profitability (ROA), Research & development and leverage have a value above 0.05 (5%). Thus, it explains that all variables are declared to be valid to be used in model
testing. The reliability test results above explain the value of above 0.05 (5%). This proves that all variables used are reliable and produce the same results when tested.
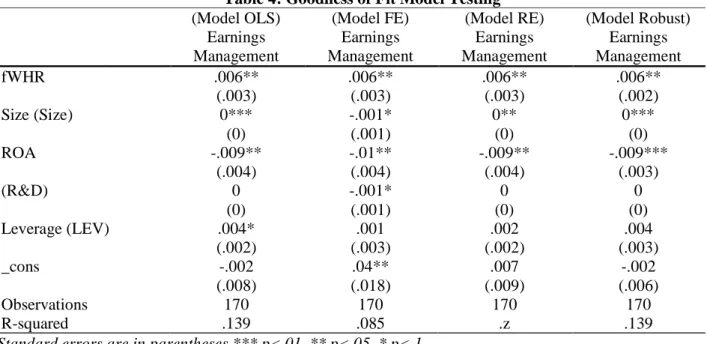
4.3 Goodness of Fit Model Testing
Hypothesis testing in research is very important, because it can determine whether the research conducted is scientific enough or not. To determine the scientific feasibility of the model, based on the results of four tests that have been carried out Common Effect Model or Pooled Least Squares (PLS)/Ordinary Least Squares (OLS), Fixed Effect Model (FE), Random Effect Model (RE). with the following output:
Table 4: Goodness of Fit Model Testing
(Model OLS) (Model FE) (Model RE) (Model Robust)
Earnings
Management
Earnings Management
Earnings Management
Earnings Management
fWHR .006** .006** .006** .006**
(.003) (.003) (.003) (.002)
Size (Size) 0*** -.001* 0** 0***
(0) (.001) (0) (0)
ROA -.009** -.01** -.009** -.009***
(.004) (.004) (.004) (.003)
(R&D) 0 -.001* 0 0
(0) (.001) (0) (0)
Leverage (LEV) .004* .001 .002 .004
(.002) (.003) (.002) (.003)
_cons -.002 .04** .007 -.002
(.008) (.018) (.009) (.006)
Observations 170 170 170 170
R-squared .139 .085 .z .139
Standard errors are in parentheses *** p<.01, ** p<.05, * p<.1 4.4 Discussion of Research Results
The probability result of Prob>F was 0.0003 ≤ 0.05 (5%), showing that if taken together, the value of regression coefficient is significant, which means that the facial masculinity of male CEOs affects earnings management. The R2 value was 0.139, indicating that the male CEO's masculinity on the earnings management had a determination level of 0.139. This means that the facial masculinity of male CEOs can be explained by the 0.139 of variability of 0.139. The discussion of the research findings is an analysis of the suitability of previous theories, opinions, or research that has been put forward by the findings of past research to overcome phenomena in this study. The followings are the main parts that can be discussed in the analysis of the findings of this study:
4.4.1 Findings: Male CEO Facial Masculinity has a positive effect on Earnings Management
The masculinity face of the male CEO shows a positive coefficient estimation result in accordance with the initial hypothesis. The results of the t-test explain that the masculine face of male CEOs has a positive and significant effect on earnings management at the significance level of p- value 0.017 0.05 (5%). Furthermore, regarding the magnitude of the influence of male CEO masculinity faces on earnings management, it can be seen from the regression coefficient value of male CEO masculinity faces of .0059656. This explains that when the face of male CEO masculinity increases by 1 percent, earnings management will increase by .0059656.
Empirical test results prove that the higher the masculinity of the male CEO's face has an impact on increasing earnings management, and vice versa, the lower the masculinity of the male CEO has an impact on the decrease in earnings management. These empirical findings support The hypothesis
is that male CEO masculinity has a positive effect on earnings management, the hypothesis is accepted (p-value 0.017 ≤ 0.05 (5%). Submission of the direction of the initial hypothesis based on the findings of previous studies that lead to positive (Jia et al. 2014). The initial hypothesis with empirical findings is the value of the masculinity coefficient of male CEOs in Indonesia in the same direction as the results of the masculinity of male CEOs in the United States. The results of the coefficient of determination indicate that the masculinity face of Indonesian male CEOs is in line with the value of the masculinity face of male CEOs in the United States. These empirical findings have an impact on masculine behavior, so that it has an impact on male CEOs in making policy on earnings management.
The results of this empirical research are consistent with the previous empirical findings (Jia et al, 2014) His empirical study in the United States for the sampling period from 1996-2010 with his findings revealed that the face of male CEO masculinity has a positive effect on earnings management, meaning that the higher the masculinity of the male CEO's face has an impact on the increase in earnings management, and vice versa, the lower the masculinity of the male CEO. impact on the decline in the value of earnings management. While the results of empirical research findings in Indonesia for the sampling period in 2016-2021 with the findings revealing that the masculinity of male CEOs has a positive effect on earnings management, meaning that the higher the masculinity of the male CEO's face has an impact on the increase in earnings management, and vice versa, the lower the face of male CEOs. male CEO masculinity has an impact on earnings management.
These findings are supported by behavioral consistency theory which explains that male CEO masculinity is correlated with testosterone, aggressiveness, social status affects earnings management, viewed from the perspective of behavioral consistency theory (Epstein, 1979). While agency theory basically discusses the form of agreement between shareholders and the characteristics of the male CEO as an agent in managing the company, the characteristics of the male CEO as an agent carry a great responsibility for the success of the company he manages. Jensen & Meckling, (1976) Explaining agency relationships arise when shareholders employ male CEO characteristics as agents to provide services and then delegate authority in decision making. In practice, the characteristics of male CEOs as agents as company managers certainly know more internal information and company prospects in the future than shareholders. So that the characteristics of male CEOs as agents have the obligation to provide information about the condition of the company to shareholders. While the Upper Echelon Theory (Hambrick & Mason, 1984) explain the assumptions that occur in the company by studying the characteristics of the company's top management team.
Hambrick & Mason, (1984) explain the distinguishing characteristics of male CEOs on psychological and cognitive aspects of corporate management. The decision-making process is divided into two rational models and improvements (Fredrickson, 1984; Fredrickson & Mitchell, 1984; Miller &
Friesen, 1983). The rational model focuses on caution, completeness of information, planning and analysis with various alternatives and choosing the best alternative (Camillus, 1981; Quinn dkk., 1988).
Jia et al, (2014) provide empirical evidence that the higher the masculinity of the male CEO has an impact on increasing earnings management, and vice versa, the lower the masculinity of the CEO has an impact on the decline in earnings management, financing decisions are focused on earnings management policies, high earnings management can increase company profitability. The higher the value of male CEO characteristics has an impact on increasing learning management, and vice versa, the lower the value of male CEO characteristics has an impact on decreasing earnings management (Cronqvist et al., 2012; Huang et al., 2013; Malmendier et al, 2011; Chava et al., (2010).
5. Conclusion
The higher the masculinity of the male CEO's face has an impact on increasing earnings management, and vice versa, the lower the masculinity of the male CEO's face has an impact on the decline in earnings management. Behavioral consistency theory explains that the face of CEO masculinity has a positive effect on earnings management, agency theory explains the role of male CEO characteristics in policy making on earnings management, while upper echelon theory explains the assumptions that occur in a company by studying the characteristics of the company's top management team, describing the characteristics of the company's top management team.
distinguishing characteristics of male CEOs on cognitive psychological aspects in corporate management. ImageJ software supports empirical findings that the face of male CEO masculinity has a positive effect on earnings management, the presence of male CEO characteristics has a positive effect on earnings management. The face describes the distinctive style of male CEOs in making earnings management policies, supported by agency theory, behavioral consistency theory and upper echelon theory. Male CEO style can influence masculine behavior and testosterone is supported by behavioral consistency theory. The face of masculinity in biology and psychology explains a person's masculine behavior supported by behavioral consistency theory. The face of masculinity in accounting explains that the masculinity of male CEOs has an effect on earnings management, supported by agency theory, behavioral consistency theory and upper echelon theory.
5.1 Author Contributions:
Conceptualization, N.F.A and R.; investigation, M. and R.; writing—preparation of origi-nal draft, I.K.B; writing—reviews and editing, R. and M.; supervision, T; project ad-ministration, N.F.A.; fund acquisition, N.F.A, and T All authors have read and ap-proved the published version of the manuscript.
5.2 Funding:
This work has been carried out with support provided by the Indonesia School of Econom-ics (STIESIA) Surabaya, Jl. Menur Pumpungan No.30, Menur Pumpungan, Sukolilo Dis-trict, Surabaya City, East Java 60118, Indonesia
5.3 Data Availability Statement:
The study did not involve any data sets and the articles collected were sourced from https://www.scopus.com/home.uri, accessed on 2022 and https://scholar.google.com/, ac-cessed on 2022.
5.4 Declaration of Conflicting Interests:
The authors declared no potential conflicts of interest with respect to the research, authorship, and/or publication of this article.
References
Abadi, S., Endarto, B., Taufiqurrahman, Aji, R. B., Kurniawan, W., Daim, N. A., Ismono, J., Alam, A. S., Purwati, A., Wijaya, A. U., Rusdiyanto, & Kalbuana, N. (2021). Indonesian Desirious Finality Of The Community In Regard. Journal of Legal, Ethical and Regulatory Issues, 24(Special Is), 1–10.
Adams, R. B., & Ragunathan, V. (2017). Lehman Sisters. Working Paper, 1–57.
https://doi.org/10.2139/ssrn.3046451
Aliyyah, N., Prasetyo, I., Rusdiyanto, R., Endarti, E. W., Mardiana, F., Winarko, R., Chamariyah, C., Mulyani, S., Grahani, F. O., Rochman, A. S., Kalbuana, N., Hidayat, W., & Tjaraka, H. (2021).
What Affects Employee Performance Through Work Motivation? Journal of Management
Information and Decision Sciences, 24, 1–14.
https://www.scopus.com/inward/record.uri?eid=2-s2.0-
85110461420&partnerID=40&md5=4b5e50800f8866ccdd52682c4b5a73f4
Aliyyah, N., Siswomihardjo, S. W., Prasetyo, I., Rusdiyanto, P., Rochman, A. S., & Kalbuana, N.
(2021). THE EFFECT OF TYPES OF FAMILY SUPPORT ON STARTUP ACTIVITIES IN INDONESIA WITH FAMILY COHESIVENESS AS MODERATION. Journal of Management Information and Decision Sciences, 24(Special Is), 1–15.
Alrajih, S., & Ward, J. (2014). Increased facial width-to-height ratio and perceived dominance in the faces of the UK’s leading business leaders. British Journal of Psychology, 105(2), 153–161.
https://doi.org/10.1111/bjop.12035
Andrews, D. F., Gnanadesikan, R., & Warner, J. L. (1971). Transformations of multivariate data.
Biometrics, 825–840.
Arifian, D., & Yuyetta, E. N. A. (2012). TERHADAP TANGGUNG JAWAB SOSIAL PERUSAHAAN ( CORPORATE SOCIAL RESPONSIBILITY ) (Studi Empiris: Perusahaan terdaftar di BEI). Accounting, 1–30.
Bamber, L. S., Jiang, J., & Wang, I. Y. (2010). What’s my style? The influence of top managers on voluntary corporate financial disclosure. Accounting Review, 85(4), 1131–1162.
https://doi.org/10.2308/accr.2010.85.4.1131
Benmelech, E., & Frydman, C. (2013). Military CEOs. Journal of Financial Economics, 117(1), 43–
59. https://doi.org/10.1016/j.jfineco.2014.04.009
Bertrand, M., & Schoar, A. (2003). Managing With Style: The Effect Of Managers On Firm Policies.
The Quarterly Journal of Economics, CXVIII(4), 1169–1208.
Bolton, P., & Bruunermeier, markus K. (2008). Economists ’ Perspectives on Leadership. Working Paper, 1–33.
Bos, P. A., Hermans, E. J., Ramsey, N. F., & Van Honk, J. (2012). The neural mechanisms by which testosterone acts on interpersonal trust. NeuroImage, 61(3), 730–737.
https://doi.org/10.1016/j.neuroimage.2012.04.002
Brochet, F., Faurel, L., & McVay, S. (2011). Manager-specific effects on earnings guidance: An analysis of top executive turnovers. Journal of Accounting Research, 49(5), 1123–1162.
https://doi.org/10.1111/j.1475-679X.2011.00420.x
Camillus, J. C. (1981). Corporate strategy and executive action: transition stages and linkage dimensions. Academy of Management Review, 6(2), 253–259.
Campbell, T. C., Gallmeyer, M., Johnson, S. A., Rutherford, J., & Stanley, B. W. (2011). CEO optimism and forced turnover. Journal of Financial Economics, 101(3), 695–712.
https://doi.org/10.1016/j.jfineco.2011.03.004
Carré, J. M., & McCormick, C. M. (2008). In your face: Facial metrics predict aggressive behaviour in the laboratory and in varsity and professional hockey players. Proceedings of the Royal Society B: Biological Sciences, 275(1651), 2651–2656. https://doi.org/10.1098/rspb.2008.0873 Chava, S., & Purnanandam, A. (2010). CEOs versus CFOs: Incentives and corporate policies. Journal
of Financial Economics, 97(2), 263–278. https://doi.org/10.1016/j.jfineco.2010.03.018
Christiansen, K., & Winkler, E. ‐M. (1992). Hormonal, anthropometrical, and behavioral correlates of physical aggression in !Kung San men of Namibia. Aggressive Behavior, 18(4), 271–280.