by BRETT A. LEIDA
B.S. Electrical Engineering Tufts University, 1991
Submitted to the Department of Electrical Engineering and Computer Science and the Technology and Policy Program
in Partial Fulfillment of the Requirements for the Degrees of
MASTER OF SCIENCE IN ELECTRICAL ENGINEERING AND COMPUTER SCIENCE
and
MASTER OF SCIENCE IN TECHNOLOGY AND POLICY
at the
MASSACHUSETTS INSTITUTE OF TECHNOLOGY
February 1998
1998 Massachusetts Institute of Technology All rights reserved
Signature of Author
Department of Electrical Engineering and Computer Science November 4, 1997 Certified by
Professor Richard C. Larson Department of Electrical Engineering and Computer Science Thesis Supervisor Certified by
Dr. Lee W. McKnight Lecturer, Technology and Policy Program Thesis Reader Certified by
A. C. Smith Chairman, Committee on Graduate Students Department of Electrical Engineering and Computer Science Certified by
Professor Richard deNeufville Chairman, Technology and Policy Program
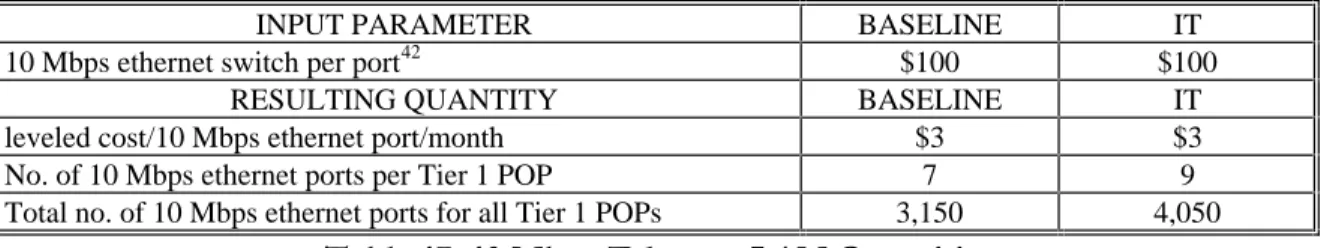
by BRETT A. LEIDA
Submitted to the Department of Electrical Engineering and Computer Science and the Technology and Policy Program
in Partial Fulfillment of the Requirements for the Degrees of Master of Science in Electrical Engineering and Computer Science
and
Master of Science in Technology and Policy February 1998
ABSTRACT
A cost model of Internet service providers is developed in this thesis. The model is used to gain insight into an ISP’s present costs and to quantify the impact on these costs of Internet telephony. In addition, the model is used to understand how management
techniques can be applied to the provision of Internet access services, and more generally to the telecommunications industry. Policy implications of Internet telephony and yield management are also presented.
The model considers five cost categories of an ISP: capital equipment, transport, customer service, operations and other expenses (sales, marketing, general and
administrative). Results show that the costs of providing Internet service exceed slightly the revenues and that no particular cost category dominates an ISP’s costs. Variation in the cost distribution among the five types of subscribers studied in the model is
considerable. Residential dial-in, business dial-in, 128 kb dial-in ISDN, 56 kb leased-line, and T1 leased-line subscribers were modeled. Hence, the ISP’s overall cost distribution will vary substantially if the mix of subscribers is varied.
The Internet telephony scenario considers the impact of computer-to-computer use of Internet telephony. The results show an increase in total ISP costs that is more than double the increase in revenue. The costs are still relatively evenly distributed among the five cost categories, but transport costs become the highest costs. Each subscriber type’s cost increases differently, but transport and customer service costs have the largest impact.
Policy issues studied include U.S. and European decisions on regulating ISPs and Internet telephony. The impact on ISP costs of recent access-charge reform by the FCC is shown to be limited, while the potential impact of per-minute access charges would be
significant.
Thesis Supervisor: Prof. Richard C. Larson Title: Professor of Electrical Engineering Thesis Reader: Dr. Lee W. McKnight
Title: Lecturer, Technology and Policy Program
Many people have helped me throughout the development of this thesis, and for that I am grateful. I would like to thank my advisors, Richard Larson and Lee McKnight. Lee has guided me through the development of the cost model, and Prof. Larson has provided the vision of applying yield management to telecommunications.
I thank the members of the MIT Internet Telephony Consortium for their guidance and support. ITC staff, including David Clark, Shawn O’Donnell, Sharon Eisner Gillett, Bill Lehr, Terry McGarty and John Wroclawski, have provided copious and constructive feedback on my attempt to build a realistic cost model. In addition, Petros Kavassalis and Ioannis Paschalidis have furthered my understanding of yield management.
I have received invaluable guidance from many industry experts. Particular thanks goes to Raj Bansal of Nokia, Fran Clairmont of Pacific Bell, Bob Dalton of Lucent, Brett Krause of Sprint, Oivind Kure of Telenor, Chuck Jackson, François Menard of Mediatrix, and Kevin Werbach of the FCC.
I thank fellow students, both former and current, for providing a great environment in which to work. Specifically at RPCP, thanks to Donya Krairit, Andrew Sears, Kristin Short, and Jim Wahl for providing constructive discussions during the formative stages of the cost model. Special thanks to Jim Wahl for all the hours spent hacking on
spreadsheets. Thanks also to Joe Bailey for his incessant encouragement over the years − Joe has been a role model for many students here − and to David Gingold for teaching me how to pace myself when writing a thesis. I also thank Salal Humair of the MIT
Operations Research Center for his invaluable guidance and research on yield
management issues and Elizabeth Yoon for her administrative support and for making RPCP a great place to work.
And, most of all, I thank my mom for allowing me the freedom to pursue my interests, and Vanessa for her understanding when those “other” interests took all my free time.
ABSTRACT_____________________________________________________________ 3 ACKNOWLEDGMENTS____________________________________________________ 5 TABLE OF CONTENTS____________________________________________________ 6 LIST OF FIGURES________________________________________________________ 8 LIST OF TABLES ________________________________________________________ 9 CHAPTER ONE: INTRODUCTION___________________________________________ 11 1. Internet Telephony Overview _________________________________________ 12 2. Internet Telephony Policy ____________________________________________ 14 2.1. U.S. Policy ____________________________________________________ 14 2.2. European Internet Telephony Policy ________________________________ 15 3. Overview of Thesis _________________________________________________ 15 CHAPTER TWO: TELECOMMUNICATIONS YIELD MANAGEMENT_________________ 17 1. Overview of Yield Management _______________________________________ 17 1.1. Yield Management in the Context of Airlines _________________________ 18 2. Characteristics of Industries Using Yield Management _____________________ 20 2.1. Large Sunk Cost and Low Marginal Cost ____________________________ 20 2.2. Perishable Goods _______________________________________________ 21 2.3. Varying but Predictable Demand Patterns ____________________________ 22 2.4. Capability of Segmenting the Market________________________________ 22 2.5. Service Reservations ____________________________________________ 24 2.6. Capability of Easily Varying Prices _________________________________ 25 3. Existing Yield Management Techniques in Telecommunications _____________ 25 4. Identifying Services for Yield Management ______________________________ 27 4.1. Perception of Service ____________________________________________ 27 4.2. Technology and Yield Management_________________________________ 29 5. Policy Considerations for Yield Management in Telecommunications _________ 29 6. Summary _________________________________________________________ 30 CHAPTER THREE: A COST MODEL OF INTERNET SERVICE PROVIDERS___________ 31 1. ISP Market Structure________________________________________________ 32 2. Modeling the ISP___________________________________________________ 34 2.1. Defining the Regions Served by the ISP _____________________________ 35 2.2. ISP Network Topology___________________________________________ 36 2.3. ISP Service Definition ___________________________________________ 38 2.4. POPs _________________________________________________________ 40 2.5. ISP Market Profile ______________________________________________ 41 2.6. Revenue ______________________________________________________ 44 2.7. User Profile____________________________________________________ 45 3. Principal Cost Categories ____________________________________________ 52
3.3. Customer Service _______________________________________________ 78 3.4. Operations ____________________________________________________ 81 3.5. Other Expenses_________________________________________________ 84 4. Summary _________________________________________________________ 87 CHAPTER FOUR: COST MODEL ANALYSIS AND INTERPRETATION________________ 88 1. Baseline Scenario Results ____________________________________________ 88 1.1. Total ISP Costs_________________________________________________ 88 1.2. Subscriber Costs ________________________________________________ 89 1.3. Baseline Scenario Summary_______________________________________ 94 2. Internet Telephony Scenario Results____________________________________ 95 2.1. Total ISP Costs_________________________________________________ 95 2.2. Subscriber Costs ________________________________________________ 96 2.3. Internet Telephony Scenario Summary _____________________________ 100 3. Sensitivity Analysis________________________________________________ 100 3.1. Dial-in Subscribers per POP______________________________________ 101 3.2. Internet Telephony Use by Dial-in Subscribers _______________________ 104 3.3. Internet Telephony Use by T1 Subscribers __________________________ 105 3.4. Customer Service Costs _________________________________________ 106 4. Impact of Access Charge Reform on ISP Costs __________________________ 108 5. Yield Management Example for Dial-in Subscribers ______________________ 110 6. Chapter Summary _________________________________________________ 115 CHAPTER FIVE: CONCLUSIONS __________________________________________ 116 1. ISP Costs ________________________________________________________ 116 2. Internet Telephony_________________________________________________ 117 2.1. Policy Issues for Internet Telephony _______________________________ 118 3. Yield Management ________________________________________________ 119 4. Areas for Further Research __________________________________________ 120 APPENDIX ONE: LIST OF ACRONYMS _____________________________________ 122 APPENDIX TWO: REFERENCES___________________________________________ 123 APPENDIX THREE: NETWORK LOSS AND ERLANG B FORMULAE _______________ 126 1. General Network Loss Formula ______________________________________ 126 2. Erlang B Formula _________________________________________________ 128 APPENDIX FOUR: COST MODEL TABLES: USER INPUTS_______________________ 130 APPENDIX FIVE: COST MODEL TABLES: MODEL OUTPUTS____________________ 136 APPENDIX SIX: COST MODEL TABLES: CAPITAL EQUIPMENT__________________ 140 APPENDIX SEVEN: COST MODEL TABLES: TRANSPORT_______________________ 145 APPENDIX EIGHT: COST MODEL TABLES: CUSTOMER SERVICE________________ 155 APPENDIX NINE: COST MODEL TABLES: OPERATIONS _______________________ 156
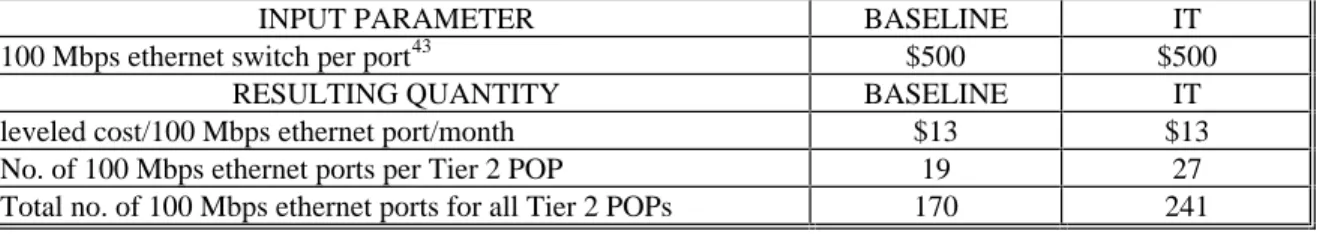
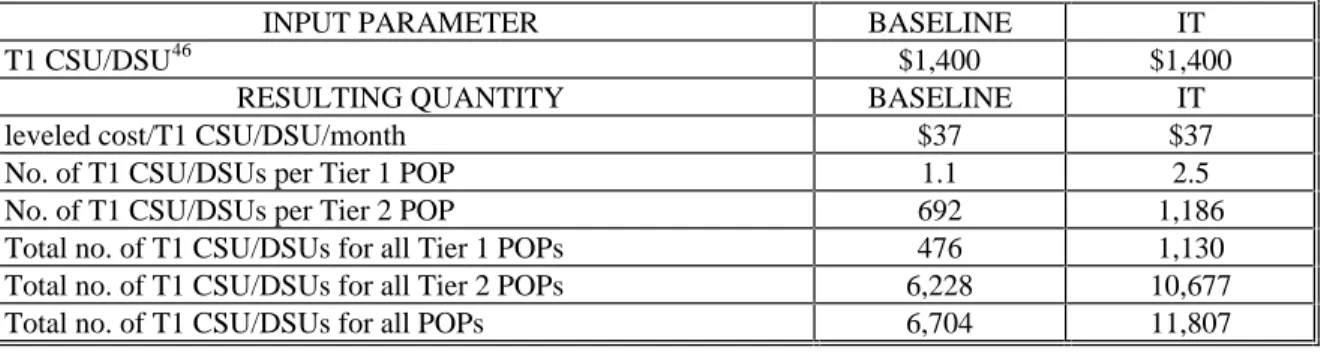
Figure 1. ISP Network Architecture ________________________________________ 33 Figure 2. ISP Topology __________________________________________________ 37 Figure 3. Tier 1 POP____________________________________________________ 40 Figure 4. Tier 2 POP____________________________________________________ 41 Figure 5. Analog and ISDN Subscriber Usage Patterns_________________________ 48 Figure 6. 56 kb and T1 Usage Patterns _____________________________________ 50 Figure 7. Modem Sizing Process___________________________________________ 56 Figure 8. Backbone Network (with distances in miles)__________________________ 74 Figure 9. Baseline Scenario Subscriber Cost Distribution_______________________ 91 Figure 10. Comparative Cost Results _______________________________________ 95 Figure 11. Cost/Revenue Ratio for Baseline and IT Scenarios____________________ 97 Figure 12. Modem Sizing _______________________________________________ 101 Figure 13. Subscriber to Modem Ratio _____________________________________ 102 Figure 14. Dial-in Subscriber Cost as Number of Subs. per POP Varies __________ 103 Figure 15. Internet Telephony and Usage Level Impact on Dial-in Subscriber’s Costs 104 Figure 16. T1 Subscriber’s Cost while Varying Bandwidth _____________________ 105 Figure 17. T1 Subscriber’s Cost Distribution while Varying Bandwidth___________ 106 Figure 18. Dial-in Subscriber Customer Service Costs ________________________ 107 Figure 19. Access Charge Impact on Dial-in User Cost _______________________ 110 Figure 20. Modem Sizing (2)_____________________________________________ 113 Figure 21. Subscriber to Modem Ratio (2) __________________________________ 114
Table 1: EU Criteria for Voice Telephony ___________________________________ 15 Table 2. ISP Size Definition ______________________________________________ 36 Table 3. Online Statistics ________________________________________________ 43 Table 4. ISP Subscribers _________________________________________________ 43 Table 5. ISP Revenue____________________________________________________ 45 Table 6. Analog Dial-in User Assumptions___________________________________ 46 Table 7. ISDN Dial-in User Assumptions ____________________________________ 48 Table 8. 2.7.3. 56 kb and T1 Subscribers Assumptions__________________________ 49 Table 9. User Bandwidth Assumptions ______________________________________ 51 Table 10. Discount Factor _______________________________________________ 53 Table 11. Cost of Equity _________________________________________________ 54 Table 12. Cost of Capital ________________________________________________ 55 Table 13. Modem Assumptions ____________________________________________ 57 Table 14. Modem Quantities ______________________________________________ 58 Table 15. ISDN Access Router Quantities____________________________________ 59 Table 16. POP Server Quantities __________________________________________ 60 Table 17. 10 Mbps Ethernet LAN Quantities _________________________________ 61 Table 18. 100 Mbps Ethernet LAN Quantities ________________________________ 62 Table 19. 100 Mbps Ethernet LAN Cost Allocation ____________________________ 62 Table 20. 56 kb CSU/DSU Quantities _______________________________________ 62 Table 21. T1 CSU/DSU Quantities _________________________________________ 63 Table 22. T1 CSU/DSU Cost Allocation _____________________________________ 63 Table 23. Cisco 2500 Router Quantities _____________________________________ 64 Table 24. Cisco 7513 Router Quantities _____________________________________ 66 Table 25. Cisco 7513 Router Cost Allocation_________________________________ 66 Table 26. Fore ASX-200BX ATM Switch Quantities____________________________ 67 Table 27. Bulk Transport Discount Assumptions ______________________________ 69 Table 28. Data T1 Cost Results____________________________________________ 72 Table 29. Backbone T3/OC-3 Results _______________________________________ 75 Table 30. Dial-In T1 Cost Results __________________________________________ 76 Table 31. Dial-In T1 Cost Results __________________________________________ 77 Table 32. NAP Interconnection Cost Assumptions _____________________________ 78 Table 33. Customer Service Assumptions ____________________________________ 80 Table 34. Network Operation and Maintenance Assumptions ____________________ 82 Table 35. Facilities Cost Assumptions ______________________________________ 83 Table 36. Billing Assumptions_____________________________________________ 84 Table 37. Sales and Marketing Assumptions _________________________________ 86 Table 38. G&A Assumptions ______________________________________________ 87 Table 39. Revenue and Cost Comparison ____________________________________ 89 Table 40. Baseline Scenario Cost Summary __________________________________ 89 Table 41. Baseline Scenario Subscriber Cost _________________________________ 90
Table 43.High-Cost Components for ISDN Subs. (Baseline Scenario) _____________ 92 Table 44. High-Cost Components for 56 kb Subs. (Baseline Scenario) _____________ 93 Table 45. High-Cost Components for T1 Subs. (Baseline Scenario) _______________ 94 Table 46. Comparative Cost Results ________________________________________ 96 Table 47. Subscriber Cost Increase ________________________________________ 97 Table 48. High-Cost Components for Residential Dial-in Subs. (IT Scenario) _______ 98 Table 49. High-Cost Components for Business Dial-in Subs. (IT Scenario) _________ 98 Table 50.High-Cost Components for ISDN Subs. (IT Scenario)___________________ 99 Table 51. High-Cost Components for 56 kb Subs. (IT Scenario) __________________ 99 Table 52. High-Cost Components for T1 Subs. (IT Scenario) ___________________ 100 Table 53. Analog Dial-in Subscriber Costs for 4 Scenarios _____________________ 109
Introduction
During the past few years the “Internet” has become a household name. Through its ever- changing array of services, this phenomenon is altering the means of communication. The beauty of the Internet is how it facilitates the adoption of new services. The architects of the underlying Internet protocols1 have designed them with the intent of allowing various applications to run over various types of networks − all communicating via this common set of protocols. One such set of applications is Internet telephony.
The ultimate impact of Internet telephony as a means of communication is still unclear − many technical, financial and policy issues remain to be solved. The goal of this thesis is to elucidate some of the financial and policy issues associated with Internet telephony, and, more generally, with Internet Service Providers (ISPs).
Specifically, this thesis investigates how Internet telephony can impact the costs of Internet service providers. Further, it introduces techniques known as yield management (which are described in Chapter 2) and applies them to the telecommunications industry − specifically to ISPs. These techniques − originally applied to the airline industry − are designed to control costs and/or to increase revenues. Additionally, policy issues studied include U.S. and European decisions on whether and how to regulate ISPs and Internet telephony. The impact on ISP costs of recent access-charge reform by the FCC is quantified as well as the potential impact on ISP costs of per-minute access charges.
To conduct this study a cost model of Internet service providers is developed. This model quantifies technical and non-technical costs of ISPs for two principal scenarios: one of
1 Such protocols include IP, TCP and UDP. See [CO95b] for further explanation.
current Internet use with relatively little Internet telephony and one of future use with moderate amounts of (computer-to-computer) Internet telephony. Once the ISP’s costs are described, a yield management scenario for ISPs is presented that aims to control the high, technical costs of dial-in Internet users.
,QWHUQHW7HOHSKRQ\2YHUYLHZ
The term “Internet telephony” has been broadly applied to a family of applications where (real-time) voice communication occurs over a network using Internet protocols. This is in contrast to traditional telephony (or “Plain Old Telephone Service” − POTS) that occurs solely over a circuit-switched telephone network. However, this distinction
between Internet telephony and traditional telephony becomes less clear when one begins to consider telephony services that bridge packet-switched and circuit switched networks.
[CL97] presents a visionary analysis of the various types of telephony services that can be realized using these once-disparate networks.
The principal contrast between traditional and Internet telephony is due to the type of network on which a call occurs. Each call of traditional telephony on a circuit-switched network has a fixed amount of bandwidth − a circuit − allocated between the two ends of the call. Any unused bandwidth due to a pause in conversation can not be recovered by the network and allocated to another call.2 In contrast, an IP-based network requires all information − be it email, web pages, audio or video − to be broken into discrete elements called packets that are individually routed over the network. Hence, if there is a pause in the conversation of an Internet telephony call, no packets are generated and packets of other users/applications can be sent in this void.
It is this statistical sharing of a potentially constrained resource − bandwidth − that leads one to believe at first thought that Internet telephony is more efficient, and, hence, less expensive than traditional telephony. The existence of an inherent cost advantage of Internet telephony is very debatable and not immediately clear. However, one certain
2 However, on certain high-cost, trans-ocean links compression techniques are used that have this effect.
advantage of Internet telephony is its ability to be integrated with other Internet services (such as those described in [CL97]). For example, a user who is browsing a web-based catalog could have a question or desire to place an order via the phone. The person could be connected to a customer service representative merely by clicking on a link in the web page. The user and the representative would then talk via Internet telephony software.
Another example could be two (or more) people collaborating on a document from remote locations. Each would have a copy of the document on the computer screen and could edit and discuss the document in real-time. Further examples are limited only by one’s imagination.
While packetization is one of the strengths of IP networks, it also presents a technical challenge for implementing real-time services. Because packets are routed individually, they 1) may follow different paths between origin and destination; 2) may be individually delayed along these paths, and 3) may arrive at the destination out of order − if they even arrive at all.3 Such characteristics of the Internet are manifested in a phone conversation as broken speech and as jitter − the end result being a sound quality poorer than that of POTS. Current research into additional protocols (such as, RSVP and RTP) is aimed at eliminating these limits associated with the Internet telephony of today.
The type of Internet telephony represented in the cost model is computer-to-computer Internet telephony. Future forms of Internet telephony that bridge the PSTN and the Internet (as described in [CL97]) will employ devices known as gateways. These devices can serve multiple roles:
• they conduct the translation between Internet and PSTN protocols;
• they convert analog voice into digitized voice to send over the Internet, and they convert digitized voice into analog voice to send over the PSTN;
• they provide directory services so that Internet users can locate PSTN users and vice versa;
• they monitor usage for billing and security purposes.
3 Further, delay from each end-user’s computer operating system and voice-digitizing hardware can also add delay to the system.
Because the development of gateways is in a relatively nascent state and the method of their deployment is uncertain, they are not considered in the ISP cost model; the only type of Internet telephony considered in this model is computer-to-computer Internet
telephony.
,QWHUQHW7HOHSKRQ\3ROLF\
863ROLF\
Telephony has been traditionally one of the most regulated industry segments in the United States. Under FCC rules (specifically, the Computer II Inquiry) ISPs, being classified as “enhanced service providers,” are exempt from regulations imposed on
“carriers,” such as long-distance telephone companies.4 These carriers must pay per- minute “access charges” on the order of $0.06 per minute to the local phone companies who terminate each end of a long distance call [WE97]. A trade association of telephone companies − America’s Carriers Telecommunications Association (ACTA) − filed a petition with the FCC asking it to regulate Internet telephony [AC96]. ACTA argued that ISPs providing Internet telephony services should pay access charges to the local
telephone companies as do other long-distance service providers.
In May 1997 the FCC unveiled a reformed access-charge system.5 The FCC essentially ruled against the ACTA petition by not requiring ISPs to pay per-minute access charges.
Instead, the FCC imposed increased phone charges on business users − ISPs included − (and residential users with a second phone line) in the form of an increased Subscriber Line Charge (SLC) and a new Presubscribed Interexchange Carrier Charge (PICC). The impact of these decisions on an ISP’s costs is presented in Chapter 4.
4 In its ”Computer II Inquiry” [FCC80], the FCC established the definition of (basic and) enhanced service providers and chose not the regulate them for reasons of public interest. Based on this definition, ISPs have always been classified as enhanced service providers [WE97, p.32].
5 See [FCC97a], [FCC97b] and [FCC97c].
(XURSHDQ,QWHUQHW7HOHSKRQ\3ROLF\
Because of the high rate of growth of the Internet in the United States, potential Internet regulation has been focused on at the highest levels of the U.S. government − more than in most other nations. However, the European Commission has also considered regulating Internet telephony. The European Commission’s approach to determining policy for Internet telephony merits attention because of the obvious impact such policies may have in enabling, or inhibiting, the continued growth of a worldwide market for advanced Internet services.
As discussed in [SH97], the European Commission has established several criteria that Internet telephony must meet before it will be subject to regulation. These criteria, initially published in [EC97], are presented in Table 1.
Based on these criteria, Internet telephony is not considered voice telephony because Internet telephony does not meet the criterion of “real-time” communication due to the current, high levels of delay experienced by Internet telephony users on the public
Internet.7 Hence, Internet telephony services in Europe are not subject to regulation at this time.
2YHUYLHZRI7KHVLV
Chapter 2 furnishes a survey of yield management and discusses how it can be used within the telecommunications industry. Further, issues regarding policy implications of yield management are addressed. Chapter 3 presents a detailed description of the ISP cost model. Analysis of the cost model results is done in Chapter 4. Additionally, the impact
6 [SH97].
7 ibid.
Such communications are subject of a commercial offer.
Such communications are provided for the public.
Such communications are to and from the public switched network termination points on a fixed telephony network.
Such communications involve direct transport and switching of speech in real-time.
7DEOH(8&ULWHULDIRU9RLFH7HOHSKRQ\
of regulatory decisions on ISP’s costs and a yield management scenario of Internet access are presented in Chapter 4. Conclusions and areas for further research are discussed in Chapter 5.
Telecommunications Yield Management
In this chapter several issues are presented regarding how yield management could be introduced to telecommunications. Some elementary forms of yield management are already being used in telecommunications. These techniques are discussed as well as whether or not more elaborate techniques could be used. Additionally, policy implications for using yield management in telecommunications are discussed.
2YHUYLHZRI<LHOG0DQDJHPHQW
Yield management (YM) is a group of techniques that has been applied successfully to a variety of industries including airlines, hotels, car and truck rental companies, and sea and land cargo carriers. Among other purposes, yield management has been used to stabilize varying demand for a given service, and thus, to stabilize, and perhaps increase, a service’s revenue. An often cited result is American Airlines attributing a $500 million annual revenue contribution to yield management techniques [SM92].
Generally speaking, yield management is used in a service that has some sort of fixed capacity (e.g., a fixed number of seats on an airplanes, hotel rooms in a hotel, or
communications links of a network). Additionally, the cost of adding capacity for these services is usually prohibitive and the service or good is usually perishable.8 The policies of yield management offer incentives to increase use of a system when demand is low and to dissuade use of a system when demand is high. A combination of techniques such as pricing, admission control, service definition and resource allocation, among others, can
8 For example, an airplane seat for a given flight can not be sold after the plane has flown. Hence, it is considered a perishable good.
be used to attain yield management’s goal of efficient use of facilities while maximizing revenue.
The following is a brief overview of how yield management is applied in the airline industry.
<LHOG0DQDJHPHQWLQWKH&RQWH[WRI$LUOLQHV
The fundamental business of an airline is to transport people. To do so, the carrier needs to build and maintain a network on which its passengers are transported. In this case the network is composed of fixed-capacity airplanes flying on fixed routes. Because of the large capital investment needed to build this network, the total capacity of the network can be considered as fixed over a short to medium time horizon.9
Because the planes must fly according to pre-determined schedules (i.e., the plane can not wait until it is full of passengers before flying) the seats on the airplane can be considered as perishable inventory. If the plane were to take off with any empty seats, what was once a product to sell is no longer available: this particular inventory has perished. Hence, it is in the airline’s interest to try to have every seat full on every flight, even if only a fraction of the standard revenue is achieved for an otherwise empty seat. Once a flight’s schedule is fixed (i.e., the resources of the airplanes are allocated), the capacity (the number of seats) between any two points on the network is also fixed. The airline then needs to strategically vary its prices in order to fill all seats and hopefully to maximize revenue − which, on a per-seat basis, is termed the “expected marginal seat revenue” − while considering such factors as the number of seats already reserved, the percent of reservations that will actually show up for a flight, competitors’ prices, and so on.
The airline’s task is further complicated, in part, by having several types of passengers with varying willingness to pay. It is for this reason that airline uses a technique known as
“price discrimination.” Passengers can be put into two general categories: business travelers and pleasure travelers. History has shown that pleasure travelers are more price
sensitive than business travelers. Additionally, business travelers tend to make travel plans at the last minute and are not prone to traveling over weekends but rather during the business week. In contrast, the pleasure travelers usually plan a vacation in advance and include some time over the weekend in their travel plans.
Using these passenger characteristics, airlines are able to sell essentially the same service
− airline transportation − to different people at different prices. In order to achieve this, the products need to be sufficiently differentiated so that the passengers perceive that they are purchasing different products. Hence, discounted tickets targeted toward the pleasure travelers have such restrictions as a two-week advanced purchase, Saturday night stay- over and nonrefundable fares. Full-fare tickets targeted towards the business travelers are refundable and do not have the advanced-purchase and Saturday-night-stay-over
restrictions. Additionally, other classes of airline travel exist such as first class, business and coach. In essence, all classes are simply seats on an airplane, but the carrier is able to further differentiate the products (and charge accordingly) by adding low-cost incentives such as free drinks and a higher quality meal for business and first class than for the coach class.
For each class of travel on each flight of an airline’s schedule “booking limits” and prices are established. Often prices are greatly influenced by external factors such as
competitors’ prices and are not considered to be part of the yield management process.
The booking limit corresponds to how many seats of a given fare are available for a particular flight. At any point in time, an airline has prices and booking limits established for travel for up to almost one year. Each evening, the airlines re-compute prices and booking limits based on such factors as the number and type of tickets sold that day and projected demand for the various flights. As previously mentioned, the result of such extensive modeling and computation − in order to near-optimally set prices and booking limits and to define services − has permitted at least one major airline to become
profitable.
9 However, by reassigning airplanes spatially and/or temporally, each segment of the network can have a varying capacity.
&KDUDFWHULVWLFVRI,QGXVWULHV8VLQJ<LHOG0DQDJHPHQW
As mentioned above, certain industries − such as airlines, hotels, car and truck rental companies, and sea and land cargo carriers − are using successfully a combination of yield management techniques to control costs and to stabilize revenue. In this section similar characteristics between these industries are identified and a comparison is made with the telecommunications industry.
/DUJH6XQN&RVWDQG/RZ0DUJLQDO&RVW
Most industries to which yield management has been traditionally applied have shared this characteristic. For instance, in the case of airlines, the number of units available for sale (the seats on an aircraft on a particular route at a particular time) are fixed. To provide one more unit (seat), an additional airplane, or a larger airplane, has to be flown on the same route at the same time. On the other hand, given that capacity is available, the marginal cost of providing service to an additional passenger (such as, food and airplane fuel) is negligible. This results in a wide range of prices over which it is preferable to sell the seat at a deep discount rather than let it go empty.
The hotel industry provides another example. Assuming a room is available, the marginal cost of providing service to an extra occupant may be as little as $15-25 when the room rate could be in excess of $100. Thus, a substantial discount is preferable to leaving a room empty. If capacity is unavailable, there is a high fixed cost of adding capacity (i.e., building more rooms).
However, one must mention that the characteristics of large sunk cost and low marginal cost are not essential for yield management to be practical. Yield management has been applied successfully to car and truck rental companies (e.g., Ryder Car and Truck Rental [MC94]) where the incremental cost of adding one more unit of capacity to the whole is relatively lower than in the case of an airline or a hotel.
Weatherford and Bodily [WB92] cite an interesting hypothetical case where even an airline that never sells out − in effect, one that has unlimited capacity − should
nevertheless stimulate demand early and then raise prices for late arrivals. Car and truck rental companies can be considered to have variable capacity because vehicles are rented for varying durations. Having fixed capacities is therefore not essential for the application of yield management techniques to an industry but is common.
The similarities between the airline/hotel scenarios and the telecommunications network scenario is evident. Once a network infrastructure is in place, the marginal cost of establishing a session on the network (assuming the network is session-oriented) is essentially negligible, assuming sufficient capacity is available for this session. However, the fixed cost of increasing the bandwidth of the network or the capacity of the switches is huge compared to the small, marginal cost of one more person using the network.
3HULVKDEOH*RRGV
The distinguishing feature of yield management is that it deals with goods or services that are perishable. There is one and only one date or time at which the good becomes
available and has to be used immediately − or within an appropriately small interval of time − otherwise the good “perishes.” The item can be stored either not at all or at least not without significant cost or deterioration. If the item were storable, inventory
management techniques would probably be more applicable than yield management techniques. Examples of perishable goods are seats in an aircraft, seats in a theater, rooms in a hotel, and even broadcast advertising time slots.
Similarly, bandwidth on a telecommunications network can be considered a perishable good. A network is sized according to a peak demand. At times when the demand is not at its peak, there is idle capacity. This capacity can not be stored; it can only be used in real-time. Hence, bandwidth can be considered a perishable good. The implications for telecommunications providers is that they should give incentives for use of the network when there is idle capacity.
9DU\LQJEXW3UHGLFWDEOH'HPDQG3DWWHUQV
Shifting demand “from the peaks (of high demand) to the valleys (of low demand)”
implies that the demand for a given product is varying over time. For example, demand for a movie ticket at 8 p.m. on a Friday night is greater than at noon on a Monday. Similar temporal demand trends exist for many services − especially telecommunications.
The limit of how much demand one can shift to the valleys depends on the nature of the service. Even if a movie theater offered a first-run film for $1 at 3 a.m., few people would go. However, for certain telecommunications services, one would be more willing to set up a computer/VCR to automatically download a file/movie at 3 a.m. if the price were much cheaper than at a high demand period.
In addition to the demand pattern varying, it must also be predictable. One must be able to reasonably forecast how demand patterns will vary (usually based on current trends), as well as how demand patterns will change with the applications of yield management techniques.
&DSDELOLW\RI6HJPHQWLQJWKH0DUNHW
A market, as defined by neoclassical economics, is the exchange of currency for a good or service across all people supplying and demanding the service. The market equilibrium is reached at the point where supply equals demand. Individual consumer surplus is the difference in what the consumer is willing to pay − his reservation price − and what the market has set − the equilibrium price. Consumer surplus is the individual consumer surplus summed over all consumers. Similarly, individual supplier surplus is the difference in the supplier’s reservation price and the equilibrium price, and supplier surplus is the individual supplier surplus summed over all suppliers.10
Price discrimination is the ability to separate consumers such that there is no one equilibrium price for all consumers, but there are separate prices for each consumer or classes of consumers. By separating the demand curve into multiple classes of consumers,
suppliers are able to set multiple equilibrium prices. By doing so, they reduce consumer surplus and increase supplier surplus. In essence, the supplier or suppliers are increasing their profits by separating the aggregate demand curve into separate demand curves. This is price discrimination. As described in [PI95], there are three principal types of price discrimination.
First degree price discrimination is a perfect price discrimination where the demand curve is separated into an individual’s demand. The supplier charges each customer his
reservation price. This removes all consumer surplus and maximizes supplier surplus.
Second degree price discrimination is non-linear pricing. By setting a price for the good that decreases over the quantity bought, suppliers are able to separate buyers who are buying in high volume and those buying in low volume. Once again, this has the effect of shifting consumer surplus to supplier surplus.
Third degree price discrimination is the type most commonly used by the airlines to segment the market. In this type of price discrimination, users are separated by their buying behavior.
As described in the yield management overview at the beginning of the chapter, airlines realize that there are different groups of people willing to pay different prices for the same product. The airline would like to be able to sell seats to any group who is willing to pay a price that is greater than the marginal cost of the product. The essential step is for the airline to differentiate the product for each group so that a consumer of a given group thinks he is purchasing a different product than one designated for another group. If the products are not sufficiently differentiated, consumers would simply purchase the product with the lowest price.
As previously described, the airlines achieve the product differentiation through
restrictions on each type of plane ticket (e.g., two week advance purchase, Saturday night stay-over, and so on). Hence, business travelers and tourist travelers are segmented into
10 See [PI95] for further discussion on consumer and supplier surplus.
their respective groups − referred to as fare classes. In reality, airlines have segmented the market into many more than two groups; on any given flight, there might be as many as twenty different fare classes.
One should note, however, that because price discrimination is only one of many tools of yield management, it can be implemented without price discrimination. As previously described, the general process of yield management shifts the demand “from the peaks to the valleys.” This has two principal impacts: costs are reduced as a result of the lowered peak demand, and revenue is increased as a result of the overall increased use of the system. Such impacts are still possible without the use of price discrimination through other techniques, such as congestion pricing and admission control. However, given demand patterns conducive to price discrimination, overall revenue would be greater if the firm employed price discrimination than if the firm did not employ it.
6HUYLFH5HVHUYDWLRQV
A characteristic common among services where yield management is employed is that reservations are made. As with hotel rooms and airplane tickets, consumers reserve space in advance so they can be essentially certain that they will be served at the time they would prefer. As previously mentioned, different classes of travelers will have different reservation patterns; for example, tourists generally reserve further in advance than business travelers. The service provider uses the reservation information along with demand forecasts to set the number of available places and prices for each class of service.
Traditionally, in the telecommunications industry, advance reservations are not made. For example, someone making a long-distance telephone call does not call the phone
company several days in advance and reserve capacity. Most likely, phone companies give no incentive for such reservation to occur for several reasons: 1) the cost of
monitoring such a large number of phone calls would be prohibitive, 2) a phone call takes such little capacity vis-à-vis the total capacity of the network, and 3) even during the high
demand times, the phone network has been sized such that there is available capacity 99.9% of the time.
Even though advance reservations have not been made traditionally in the
telecommunications industry, there is plenty of opportunity for this to occur with emerging services. Many new services − especially video services − require much more capacity than a telephone call. Networks that carry currently millions of telephone calls will be more constrained when carrying “video calls.” Hence, service providers can plan for an efficient use of their network capacity by taking advance reservations for certain classes of service to be certain the network is as full as possible at all times.
&DSDELOLW\RI(DVLO\9DU\LQJ3ULFHV
One characteristic of industries using yield management is the ability to vary easily the prices of service. While yield management techniques were being developed for American Airlines as early as the 1960s, they could not implement the techniques until the deregulation of the airline schedules and prices in 1979 [SM92]. Likewise, in other industries employing yield management, such as hotels and cruise lines, pricing flexibility exists.
In contrast, the telecommunications industry has many of its services regulated. For example, tariffs for local and long-distance telephone service need to be filed with the appropriate regulatory bodies. Any changes to the pricing structures of a service need to be filed and approved. Certainly, the telecommunications industry can not vary its prices as freely as the airline industry. However, there is a current trend of deregulation in the telecommunications industry, and an environment where service providers have more flexibility in varying its prices is certainly perceivable.
([LVWLQJ<LHOG0DQDJHPHQW7HFKQLTXHVLQ 7HOHFRPPXQLFDWLRQV
Yield management has not been systematically practiced in the telecommunications industry even though there does exist some rudimentary usage of such techniques. For
instance, long distance telephone rates are varied throughout the day in order to affect demand. Peak usage occurs traditionally during the day, and rates are set higher; when demand drops in the evening and throughout the night, rates are lowered. Hence, only basic, pricing techniques are used. Reasons for this could be due, in part, to current pricing inflexibility as described above.
Because the telephone network has only one class of service, the extent of admission control is based solely on the availability of capacity. If a route from origin to destination exists, the call request is accepted; if no route (of two network links or less) exists, the call is blocked. The public switched telephone networks in the United States are sized such that the probability of a call being blocked is less than some blocking probability threshold − usually on the order of 0.01 or 0.001.11
As another example of yield management, one can look at ISPs. As described in Chapter 3, dial-in subscribers connect to the Internet via the ISP’s modems. The number of modems that an ISP uses will vary according to the number of the ISP’s dial-in
subscribers and to what level of service the ISP wants to offer. At one extreme, the ISP could have one modem for each subscriber; quality of service would be great because no users would be blocked. At the other extreme the ISP could have one modem for all subscribers; service would be rather lousy because the chance of being blocked is high.12 Hence, the ISP needs to size its modems somewhere between these two extremes. Not all ISPs will size their modems to the same level, and, thus, there will be varying levels of blocking seen by the end users.
ISPs realize that certain end users are willing to pay more than the default $20 per month if they could be guaranteed a connection when they want it. Hence, some ISPs offer a
11 As just described, from a technical perspective, there is only one class of service. From a pricing perspective, there are actually two broad classes (which are generally unrelated to yield management):
business users and residential users, with different prices for each class. This is a form of price
discrimination known as “customer-class pricing,” which is based on the theory of Ramsey pricing and rate- of-return regulation [MI91]. This price discrimination is due not to the telephone service providers but rather to regulators who desire business users, with a greater willingness to pay (on average), to subsidize the cost of residential users, who are more sensitive to price (on average).
12 Of course, the blocking probability would depend on the actual number of subscribers and their usage patterns.
different class of dial-in service where there is a dedicated modem for each subscriber of this service. This could be considered as a form of yield management because the service provider identified a varying willingness-to-pay and created multiple classes of service for its subscribers.
,GHQWLI\LQJ6HUYLFHVIRU<LHOG0DQDJHPHQW
A service provider will have many types of issues to consider when trying to identify the services with which to use yield management. Considerations include technical and non- technical issues as described below.
3HUFHSWLRQRI6HUYLFH
One of the effects of the airlines using yield management is that the passenger’s
perception of service has changed. Arguably, one could consider the service definition of airlines before yield management to be similar to commercial bus carriers today. For a bus passenger wishing to travel from Boston to New York, for example, the availability of a ticket depends solely on whether or not there remain open seats on the bus. Similarly, in the long distance telephone networks, a call request is admitted solely based on
whether or not there exists a route with capacity between the origin and destination. In contrast, the availability of an airline ticket for a certain class of service depends on whether or not there remain any seats for that class on the airplane, not simply whether or not there remain any seats on the airplane. In one scenario, there might remain open seats on the airplane, but no more tickets for a particular fare. In this case, the passenger must choose a ticket from another fare (presumably at a higher price) or choose not to travel on that flight.
Consider the users of the public switched telephone network as an example of a user’s perception of a telecommunications service. While the telephone networks have slowly migrated from analog networks to digital networks over the past several decades, the fundamental service of POTS has remained essentially the same since its inception earlier this century. The local (and usually, monopoly) telephone company has defined POTS to
be a single level of quality, known as toll quality − a sort of one-size-fits-all telephone service. Moreover, the user expects the telephone network to have capacity for him to make a phone call when he picks up the telephone. Given this assumption about the user’s perception of service, the phone companies spend much effort and money to sufficiently provision the telephone network so that there is a 99.9% chance (which corresponds to a 0.001 afore-mentioned blocking probability) that the network has
available capacity for the user to make a phone call at any time during normal conditions.
The service provider (e.g., telephone company) could take a perspective different than that of continually sizing the network to accommodate fluctuations in demand; instead, the service provider could define different levels of service for telephony, such as
discounted and standard service, for example. The discounted service could be one that is priced less per minute than standard service and would not necessarily have the toll- quality clarity that the standard service would have. In addition, during times of high demand, the service provider might limit the amount of discounted service that is available. In effect, the user could attempt to make a telephone call with discounted service and find that that service is not currently available at that time; instead, the user would have to pay more and use the standard service. Traditionally, telephone networks have been circuit-switched, and such distinctions in quality-of-service were unachievable, or perhaps not cost-effective. The advent of packet-switched Internet telephony permits more easily such variations in service definition.
Having several levels of quality-of-service for the above example of telephony is not necessarily desirable or cost effective (at least for circuit switched telephony), but having several levels of quality-of-service for other telecommunications service, such as video applications, is potentially beneficial.
Not only will service providers need to define their services from a different perspective, but the end-users will also have to take a different perspective (e.g., growing accustomed to being blocked for a certain discount service but having a higher level of service available − presumably at a higher price).
7HFKQRORJ\DQG<LHOG0DQDJHPHQW
The specific yield management techniques used would depend on the type of services and on the technology employed by the telecommunications provider. For example, one might approach defining yield management techniques for telephony on circuit switched
networks differently than for telephony on packet switched networks. Likewise, yield management techniques for broadcast, analog video on a coaxial cable plant vis-à-vis packetized, digital video on the same coaxial plant would be approached differently because of the potential for sharing the bandwidth used by the digital video with other digital services.
3ROLF\&RQVLGHUDWLRQVIRU<LHOG0DQDJHPHQWLQ 7HOHFRPPXQLFDWLRQV
From a policy maker’s perspective, extensive use of yield management in
telecommunications could further complicate an already complex decision-making process. Using yield management as described, service providers could be varying prices and blocking call requests for certain types of service. Given the trend in deregulation, the policy maker would have to decide what, if any, services should remain regulated.
Responsibilities for policy makers would include not only potentially regulating prices of services, but also availability of services.
The passing of the 1996 Telecommunications Act has spawned a reconsideration of what services to include under the Universal Service umbrella − which has traditionally
included only telephone services;13 there is now the possibility of including Internet and other enhanced services. Hence, a policy maker might ultimately decide that some service being offered by a telecommunications service provider using yield management should also be included under the Universal Service umbrella. The service provider will then have to consider this policy constraint when defining the yield management techniques in order to meet the minimum requirements (as defined by the policy maker).
13 Universal Service is the concept of ensuring that "[c]onsumers in all regions of the Nation, including low- income consumers and those in rural, insular, and high cost areas . . . have access to telecommunications
For example, consider a cable company offering a packet switched telephone service along with other digital video and data services on its coaxial cable plant. The cable company might choose to use yield management techniques to allocate its bandwidth resources. However, regulations might require the cable company to make available at all times the ability of a local telephone call (e.g., a 911 call). Hence, there are certain call requests for some basic level of telephone service (however that is defined by the
regulator) that can not be denied. As a result, the cable company will have to consider this when developing its yield management techniques.
6XPPDU\
Chapter 2 examined how yield management can be applied to many types of
telecommunications services. Characteristics common to industries already employing yield management techniques were presented and compared to the telecommunications industry. The specific case for studying yield management in this thesis is for Internet service providers, and the specific scenario presented in Chapter 4 is for dial-in Internet access service.
The next chapter introduces the Internet service provider cost model.
and information services . . . at rates that are reasonably comparable to rates charged for similar services in urban areas” [FCC97a, p. 5].
A Cost Model of Internet Service Providers
This chapter presents a cost model of Internet service providers that was developed for the MIT Internet Telephony Consortium (ITC) and the MIT Research Program on Communications Policy (RPCP). Specifically, the model aims to quantify the impact on an ISP’s costs that result from an increased use in Internet telephony. The model contains two scenarios: a baseline scenario representing current ISPs where the principal use of the network is for web browsing and there is essentially no Internet telephony; an Internet telephony (IT) scenario where the ISP sees a substantial increase in use of computer-to- computer Internet telephony by its subscribers.
This model serves several purposes:
(1) It identifies the costs of end-to-end Internet service for various types of users (e.g.
dial-in, leased-line) and how those costs fall into various cost categories. One can then understand an ISP’s motivations for targeting certain types of subscribers.
(2) One can quantify the impact on an ISP’s costs for certain “what if” scenarios. For example, what happens to the costs under a substantial increase of computer-to- computer Internet telephony use.
(3) Using the model results, one can tailor yield management techniques to have the most impact on the high-cost areas of Internet service provision for each type of user.
The model breaks down the ISP’s costs into five principal categories:
• Capital Equipment − the hardware and software of the network;
• Transport − the leased lines of the network and interconnection costs;
• Customer Service − staff and facilities for supporting the customers;
• Operations − billing, equipment and facilities maintenance, and operations personnel;
• Other Expenses − sales, marketing, general, and administrative.
The details of each category are presented later in this chapter. However, before considering the specifics of the cost model, one must first understand which type of telecommunications entity is attempting to be modeled.
,630DUNHW6WUXFWXUH
In building a cost model of an ISP, one must define what type of ISP the model is intended to represent. In order to provide a perspective of this task, note a comment by Bob Metcalfe in his weekly column:
My key fact of the week is that there is no meaningful notion of an “average" ISP [ME97b].
Hence, questions like ‘What is a typical ISP?’ or even ‘What is an ISP?’ are not easily answered. Many entities ranging from national backbone providers − such as MCI − to AOL (who provides access to the Internet as well as to proprietary content) to the local access provider around the corner (who might have only 300 subscribers) all call
themselves ISPs because they all provide Internet service. Clearly, a single model can not represent sufficiently all of these entities.
The current structure of ISPs is that there are several national backbone providers such as Sprint, MCI, UUnet, Netcom, and BBN.14 These network operators have diverse
networks that span the country (and internationally in some cases) and interconnect at several points throughout the country. These interconnection points can be at public
14 The number of ISPs who have these national backbones is growing as other entities who own national telecommunications networks for services other than Internet are considering using some of this capacity for Internet services. For example, as its name would indicate, Cable & Wireless Internet Exchange (CWIX) was initially involved in telecommunications services other than Internet but now operates an international ISP network.
locations −such as NAPs (network access point) or MAEs (metropolitan area ethernet) − or can be at privately arranged peering points.
The types of subscribers that these national backbone ISPs have are (1) business and institutions wanting dedicated, high-bandwidth access and (2) the local and regional ISPs (also referred to as Internet access providers, IAPs). It is from these Internet access providers that many residential users and small businesses obtain their access. Essentially these IAPs are using the larger, upstream provider to interconnect the IAPs’ local network with (1) the other local networks of the upstream provider, (2) the individual leased-line subscribers of the upstream provider, and (3) the rest of the Internet that is accessed via one of the NAPs. Hence, there is a clear distinction between the businesses providing end-user access and those providing a nationwide backbone that interconnects the access providers.15 There are, however, some ISPs that offer both backbone connectivity as well as access service, but this is usually carried out in separate divisions of the ISP, almost as separate business entities.
15 Several years ago certain ISPs, such as Netcom and PSInet who had national backbones also had over 100,000 dial-in subscribers. They have since left the mass consumer market to concentrate on the more profitable business (leased-line) market.
1$3
EDFNERQH,63$
EDFNERQH,63%
DFFHVV,63VDQG OHDVHGOLQHVXEV
)LJXUH,631HWZRUN$UFKLWHFWXUH
As an example of ISP structure, Figure 1 shows two hypothetical backbone ISPs. Their networks span the country and interconnect at several NAPs. Additionally each backbone ISP has many access ISP customers and leased-line subscribers that connect at a node, also referred to as a point-of-presence (POP).
Additionally, two important trends are affecting the ISP market structure:
(1) Because of continued growth of Internet services, the total number of ISPs is growing.
Boardwatch Magazine lists 1455 ISPs in its March 1997 directory of ISPs [BO97]; its Fall 1996 directory lists 3068 ISPs in North America [BO96].
(2) Consolidation among ISPs is also occurring. Because of “acquisitions or attrition,”
one analyst put the number of ISPs in the US to be around 1,500 by the year 2000 [LA97].
The effect is that ISP market structure in the US is very dynamic. Developing a model to understand the costs of Internet services that tries to closely imitate current market structure will not necessarily provide additional insight. Moreover, ISP market structure outside the US is less fractured; many countries have just a handful of ISPs, each with substantial market share. Hence, in order to quantify costs of Internet service, one must represent the end-to-end costs, not just the costs of a particular access or backbone ISP based on a market structure that is fast changing.
0RGHOLQJWKH,63
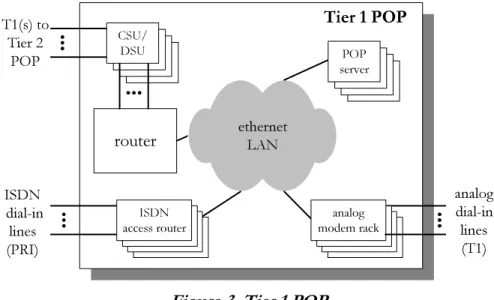
In order to quantify these end-to-end costs of Internet service provision, the cost model represents a single backbone ISP and its associated access ISP customers and its leased- line subscribers. It is assumed that the other backbone ISPs (and their subscribers) would have a cost distribution similar to the one being modeled. For descriptive simplicity in the cost model, the aggregated entity of the backbone ISP and the access ISPs will be referred to as a single ISP. Figures 2, 3, and 4 illustrate the topology and technology of this ISP that are discussed in the following sections.
'HILQLQJWKH5HJLRQV6HUYHGE\WKH,63
ISPs generally locate a point-of-presence (POP) in a region that it wants to serve. These POPs can range in size depending on how many subscribers for which the POP is
providing service. The model uses a two-level hierarchy of POPs: Tier 1 POPs and Tier 2 POPs. In each urban region, which corresponds to a major city, a Tier 2 POP is located, and in each rural area surrounding a city, a Tier 1 POP is located. Thus, with each Tier 2 POP, there is associated a certain number of Tier 1 POPs. The following list shows the model parameters that define the regions served by the ISP:
• No. of Tier 2 POPs
• No. of Tier 1 POPs / Tier 2 POP
• No. of NAP Interconnection points
• Tier 1 POP average population
• Tier 2 POP average population
• average distance Tier 1 POP to Tier 2 POP (miles)
• average E/W distance between 2 Tier 2 POPs
• average N/S distance between 2 Tier 2 POPs
• average distance Tier 1 POP to closest central office (miles)
• distance to NAP from closest Tier 2 POP.
Using the combination of the number of Tier 1 and Tier 2 POPs and the population
served by each POP, the model determines the total population of the region served by the ISP. Additionally, using the distance parameters, the model determines the area of the region being served.
One implied factor that greatly influences the region served by a POP in reality is how one defines the region in which a non-toll call can be made. The main reason for locating multiple POPs throughout a region is that for those users who dial-in over telephone lines, they will most likely not use an ISP for whom they need to make a toll call. The smaller the region in which one can make a non-toll call, the more dispersed the ISP’s POPs must be. At one extreme, if a dial-in user can call a POP anywhere in the country without a toll (and the ISP does not have to pay for the call; e.g., 800 numbers), then it is to the ISP’s advantage to centralize all equipment in order to save the additional costs of
maintaining POPs dispersed throughout a region and in order to take advantage of statistical multiplexing of certain network equipment (e.g. modems).
'HIDXOW9DOXHVLQWKH0RGHO
The ISP is sized such that it serves 9 major cities throughout the US. The average East- West distance between the cities is 1,500 miles and the average North-South distance is 500 miles so that the ISP essentially spans the US Table 2 indicates the values used for the above mentioned parameters. Because Internet telephony will have no effect on these parameter values, they are the same for both the baseline scenario and the IT scenario.
,631HWZRUN7RSRORJ\
This section describes the structure of the network connecting the various POPs. The ISP’s network, which is shown in Figure 2, is similar to that in Figure 1. The Tier 2 POPs are interconnected in a mesh network, and the Tier 1 POPs interconnect in a star network with a Tier 2 POP at the center. The ISP interconnects with other ISPs at three NAPs.16 The Tier 1 POPs connect to a Tier 2 POP with dedicated T1 circuits. The Tier 2 POPs are interconnected with dedicated OC-3 or T3 circuits, depending on which type of circuit is cheaper. The total number of required circuits depends on the number of POPs and the
16 An earlier version of the model used a star network instead of a mesh network to interconnect the Tier 2 POPs. As the network was scaled beyond a regional network to one that spans the US, the costs associated with the network (i.e., what are referred to as transport costs in the model) became very high. Updating the model with a mesh network, but maintaining the same level of demand, caused the transport costs to decrease. Hence, for the given demand, the mesh network represents a more efficient backbone topology than a star network.
PARAMETER BASELINE IT
No. of Tier 2 POPs 9 9
No. of Tier 1 POPs / Tier 2 POP 50 50
No. of NAP Interconnection points 3 3
Tier 1 POP average population 500,000 500,000
Tier 2 POP average population 2,000,000 2,000,000
average distance Tier 1 POP to Tier 2 POP (miles) 75 75
average E/W distance between 2 Tier 2 POPs 1500 1500
average N/S distance between 2 Tier 2 POPs 500 500
Area of Region Served (sq. mi.) 3,000,000 3,000,000
Total Population of Region 243,000,000 243,000,000
distance to NAP from closest Tier 2 POP (miles) 5 5
7DEOH,636L]H'HILQLWLRQ
aggregated amount of traffic. Each Tier 1 and Tier 2 POP has also analog and ISDN dial- in lines over whi