INCLUSION OF FATIGUE EFFECTS IN HUMAN RELIABILITY ANALYSIS
By
Candice D. Griffith
Dissertation
Submitted to the Faculty of the Graduate School of Vanderbilt University
in partial fulfillment of the requirements for the degree of
DOCTOR OF PHILOSOPHY in
Interdisciplinary Studies: Human Reliability in Engineering Systems
May, 2013 Nashville, Tennessee
Approved by:
Professor Sankaran Mahadevan Professor Mark Abkowitz
Professor Julie Adams Professor Mark Lipsey Professor Matthew Weinger
Copyright © 2013 by Candice D. Griffith All Rights Reserved
To George, my favorite feline helper
ACKNOWLEDGMENTS
I would like to acknowledge several people and organizations that have made this research possible. I especially thank Dr. Mahadevan for his patience and support as my dissertation committee chair and research advisor; and for the hours of sleep deprivation he accrued reading about sleep deprivation. I would also like to thank my other committee members: Dr. Mark Abkowitz, Dr. Julie Adams, Dr. Matthew Weinger, and Dr. Mark Lipsey for their time and contributions.
This research was sponsored in part by a graduate fellowship funded by the National Science Foundation (NSF) IGERT program at Vanderbilt University and by Idaho National Laboratory’s Human Factors, Instrumentation, and Control Systems Department through the Idaho National Laboratory Educational Programs. I am grateful for the guidance of Dr. Bruce Hallbert and Dr. Harold Blackman of Idaho National Laboratory during the grant period and additional research visits. I would also like to acknowledge Jeffrey Joe and Dr. Ron Boring of Idaho National Laboratory for their friendship and guidance throughout this research.
I had the opportunity to participate in an internship at the Nuclear Regulatory Commission (NRC) and to work in my area of research. At the NRC, I would like to thank Dr. J. Persensky, and especially, Dr. Erasmia Lois for her support and guidance.
I am grateful for the support of the students in the reliability and risk engineering program and the support staff of the Department of Civil and Environmental Engineering at Vanderbilt. Special thanks to Dr. Janey Smith Camp for her help and encouragement,
and to Karen Page, Dr. Robert Guratzsch, and Dr. Ned Mitchell for helping make this process fun. I am grateful to my family and friends for their continued support throughout my graduate career. I am especially thankful to my mother for her proofreading, my brother’s printing and mailing services, and to my father for his support and Tuesday phone calls. Finally, I would like to thank George, for being the best furball ever.
TABLE OF CONTENTS
Page
DEDICATION ... iii
ACKNOWLEDGMENTS ... iv
LIST OF FIGURES ... ix
LIST OF TABLES ... xiii
ABBREVIATIONS ... xx
Chapter I. INTRODUCTION ... 1
Background ... 1
Research Objectives ... 6
Organization of the Dissertation ... 7
II. FATIGUE RESEARCH AND HRA METHODS ... 9
Fatigue ... 9
Difficulties in Defining Fatigue ... 16
Measurement of Fatigue ... 18
Measurement of Sleep Deprivation Effects on Performance ... 21
Probabilistic Risk Assessment (PRA) ... 26
Human Reliability Analysis (HRA) ... 29
THERP ... 32
ATHEANA ... 35
SPAR-H ... 37
PSFs in SPAR-H ... 38
Limitations in Current HRA Methods ... 40
Inclusion of Fatigue in HRA Methods ... 41
Summary ... 43
III. SYNTHESIS OF SLEEP DEPRIVATION STUDIES ... 44
Background on Meta-Analysis ... 44
Procedure for Meta-Analysis ... 46
Equations of Meta-Analysis ... 47
Shortcomings of Meta-Analysis ... 50
Variations among Sleep Deprivation Studies ... 51
IV. RESEARCH METHODOLOGY ... 58
Data Collection ... 58
Coding Applications ... 61
Data Resources... 61
Study Selection ... 62
Coding of Study Information ... 64
Study Descriptors ... 65
Sample Descriptors ... 65
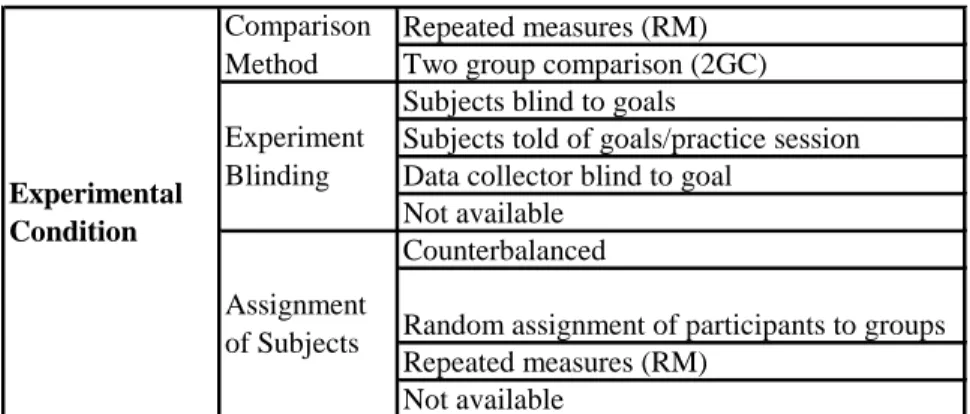
Experimental Conditions ... 66
Task Characteristics ... 68
Statistical Data ... 69
Data Collected ... 71
Data Analysis ... 77
Data Analyzed ... 78
Analysis Methodology ... 79
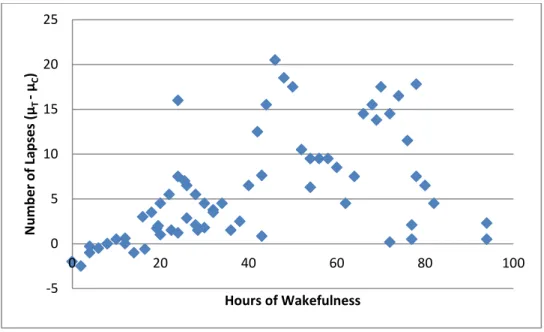
Difference between Mean Values ... 79
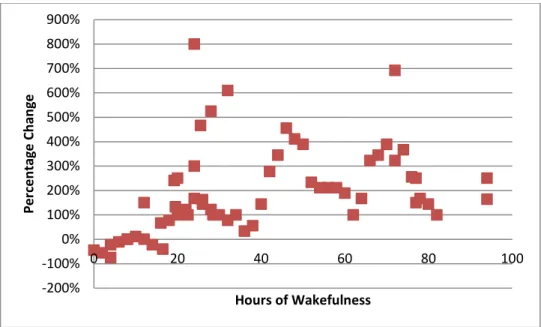
Percentage Change ... 80
Effect Size and Reliability Index Calculations ... 81
Linear Regression ... 83
PSF Derivation ... 84
Uncertainty Analysis ... 87
Summary of Methodology ... 91
V. RESULTS... 93
Resulting Data ... 93
Data on Number of Lapses ... 98
Quantitative Effect of Sleep Deprivation on Number of Lapses ... 98
Linear Regression for Number of Lapses ... 105
Derivation of Probability Ratios for Number of Lapses ... 109
Uncertainty Analysis of Probability Ratios for Number of Lapses ... 119
Data on Reaction Time ... 122
Quantitative Effect of Sleep Deprivation on Reaction Time ... 123
Reaction Time Regression ... 131
Predictive Modeling of Reaction Time vs. Hours of Wakefulness ... 137
Derivation of Probability Ratios for Reaction Time ... 143
Uncertainty Analysis of Probability Ratios for Reaction Time ... 151
Data on Accuracy ... 154
Quantitative Effect of Sleep Deprivation on Accuracy ... 155
Sensitivity to Normal Assumption ... 157
Inter-rater Reliability ... 158
Summary ... 161
VI. SUMMARY AND CONCLUSIONS ... 163
Summary of Accomplishments ... 163
Research Assumptions: ... 165
Summary of Results ... 166
Practical Application ... 169
Future Directions ... 173
BIBLIOGRAPHY ... 175
Appendix A INTERESTING FATIGUE FACTS ... 196
B FATIGUE ACCIDENTS ... 198
C IMPACT FACTOR OF JOURNALS ... 204
D ACCURACY ANALYSIS RESULTS... 206
Data on Accuracy ... 206
Data on Number Correct ... 207
Data on Percentage Correct (% Correct) ... 212
Data on Number of Errors (# Errors) ... 219
Data on Percentage of Errors (% Errors) ... 225
Data on False Positives (False +) ... 230
Summary and Conclusion for Accuracy Data ... 235
E META-ANALYSIS CODING DATA ... 238
F INTER-RATER RELIABILITY DATA ... 291
G INITIAL SEARCH RESULTS (i.e., 600 STUDIES) ... 294
LIST OF FIGURES
Page
Figure 1: Fatigue Model... 4
Figure 2: Fatigue as a Bucket (Grandjean, 1968) ... 17
Figure 3: Hours of Wakefulness Compared to BAC% ... 26
Figure 4: HRA Three-Step Process (INL HRA Course, 2004) ... 30
Figure 5: Event-Tree for Two Tasks (A, B): Both Completed Correctly ... 34
Figure 6: Event-Tree for Two Tasks (A, B): Either One Completed Correctly ... 34
Figure 7: Yerkes-Dodson Law Inverted U-graph (Yerkes and Dodson, 1908) ... 40
Figure 8: Meta-Analysis Procedure Diagram ... 46
Figure 9: Normal Probability Distribution with Threshold Value (k) ... 85
Figure 10: Differences between the Means for Number of Lapses ... 99
Figure 11: Percentage Change for Number of Lapses ... 101
Figure 12: Percentage Change for Number of Lapses (Outliers > 900% Removed)... 102
Figure 13: ES and β for Number of Lapses ... 103
Figure 14: Probability P(T > C) for Number of Lapses ... 104
Figure 15: Probability Ratios P(T>C)/0.5 for Number of Lapses vs. Hours of Wakefulness ... 109
Figure 16: Probability Ratios for Number of Lapses vs. Hours of Wakefulness ... 111
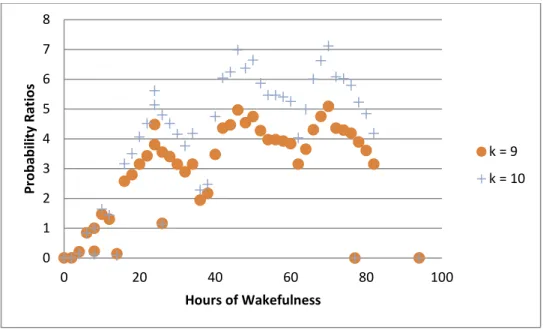
Figure 17: Probability Ratios for Number of Lapses (k = 9, 10) ... 112
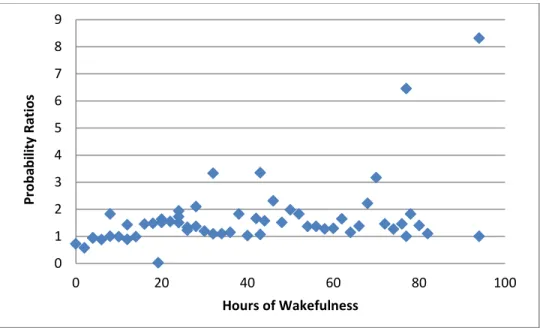
Figure 18: Probability Ratios for Number of Lapses (k = 2) ... 114
Figure 19: Probability Ratios for Number of Lapses (k = 1, 3, 6) ... 115
Figure 20: Mean Probability Ratios for Number of Lapses (k = 1) ... 120
Figure 21: Number of Lapses (Test) vs. Hours of Wakefulness ... 122
Figure 22: Difference between the Means for Reaction Time (µT-µC) ... 124
Figure 23: Difference between the Means for Reaction Time (µT-µC) (Values > 100 and < -100 Removed)... 125
Figure 24: Percentage Change for Reaction Time ... 127
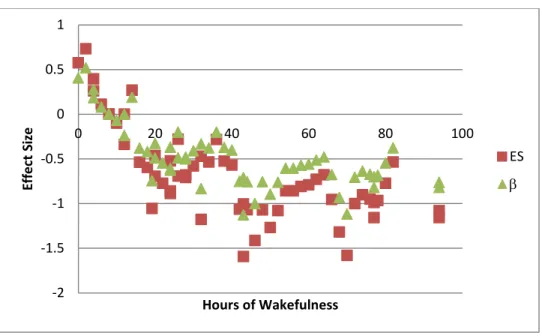
Figure 25: ES and β for Reaction Time ... 128
Figure 26: ES and β for Reaction Time (Values > 10 and < -10 Removed) ... 130
Figure 27: Probability P(T > C) for Reaction Time ... 131
Figure 28: Regression of Reaction Time Data from Five Studies (77 Data Points) ... 138
Figure 29: Simple Regression of 5 Studies with Reaction Time Data (≤ 24 Hours of Wakefulness)... 142
Figure 30: Weighted Regression of 5 Studies with Reaction Time Data (≤ 24 Hours of Wakefulness)... 142
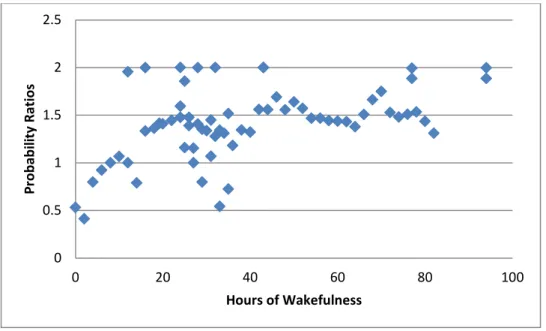
Figure 31: Probability Ratios for Reaction Time vs. Hours of Wakefulness ... 144
Figure 32: Probability Ratios for Reaction Time (Values >10 Removed) ... 145
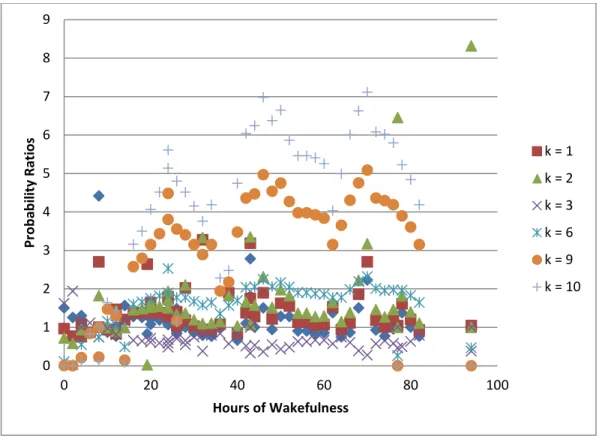
Figure 33: Probability Ratios for Reaction Time (k = 250, 400) ... 146
Figure 34: Probability Ratios for Reaction Time (k = 300) (Values >10 Removed) ... 147
Figure 35: Probability Ratios for Reaction Time (k = 500, 750) (Values>10 Removed)148 Figure 36: Probability Ratios for Reaction Time (k = 1000) (Values >10 Removed) .... 150
Figure 37: Mean Probability Ratios and 95% Confidence Intervals of the Mean for Reaction Time (k = 500) ... 152
Figure 38: Reaction Times vs. Hours of Wakefulness (Test Condition Data) ... 154
Figure 39: PSF Coefficients for k = 500 for Normal and Lognormal C and T ... 158
Figure 40: Bland-Altman Plot Differences between Main and Auxiliary Coder (Control) ... 160 Figure 41: Bland-Altman Plot Differences between Main and Auxiliary Coder (Test) . 161
Figure 42: Effect Sizes for Number of Lapses... 167
Figure 43: Effect Sizes for Reaction Time Data ... 168
Figure 44: Difference between Mean Values (µT-µC) for Number Correct Data ... 208
Figure 45: Percentage Change for Number Correct Accuracy Data ... 209
Figure 46: ES and β for Number Correct Accuracy Data ... 210
Figure 47: Probability Ratio for Number Correct Data vs. Hours of Wakefulness ... 212
Figure 48: Difference between the Mean Values (µT-µC) for Percentage Correct Data . 214 Figure 49: Percentage Change for Percentage Correct Accuracy Data ... 216
Figure 50: ES and β for Percentage Correct Accuracy Data ... 217
Figure 51: Probability Ratio for Percentage Correct vs. Hours of Wakefulness ... 218
Figure 52: Difference between the Mean Values (µC-µT) for Number of Errors Accuracy Data ... 220
Figure 53: Percentage Change for Number of Errors Accuracy Data ... 221
Figure 54: ES and β for Number of Errors Accuracy Data ... 222
Figure 55: Probability Ratio for Number of Errors Accuracy Data vs. Hours of Wakefulness ... 223
Figure 56: Difference between Mean Values (µC-µT) for Percentage Error Accuracy Data ... 226
Figure 57: Percentage Change for Percentage Error Accuracy Data ... 227
Figure 58: ES and β for Percentage Error Accuracy Data ... 228
Figure 59: Probability Ratios for Percentage Error Accuracy Data vs. Hours of Wakefulness ... 229
Figure 60: Difference between the Mean Values (µC-µT) for False Positive Accuracy Data ... 231
Figure 61: Percentage Change for False Positives Accuracy Data ... 232
Figure 62: ES and β for False Positives Accuracy Data ... 232 Figure 63: Probability Ratios for False Positives Accuracy Data vs. Hours of
Wakefulness ... 234
LIST OF TABLES
Page
Table 1: Estimation of Human Error Contributions as % of All Failures ... 2
Table 2: Incidents That List Human Fatigue as a Root Cause ... 10
Table 3: Recent Nuclear Power Plant Fatigue Related Incidents ... 15
Table 4: Factors That Differ in Sleep Deprivation Studies... 22
Table 5: Hours of Wakefulness Compared to BAC% Levels... 25
Table 6: THERP Table 20-14, Estimated HEPs in Detecting Stuck Locally Operated Valves (Swain and Guttman, 1983) ... 33
Table 7: Interpreting Effect Size (Coe, 2000) ... 50
Table 8: Studies Using the PVT... 56
Table 9: List of 108 Studies ... 63
Table 10: Study and Sample Descriptors ... 66
Table 11: Experimental Conditions ... 67
Table 12: Characteristics of the Task... 69
Table 13: Statistical Data ... 71
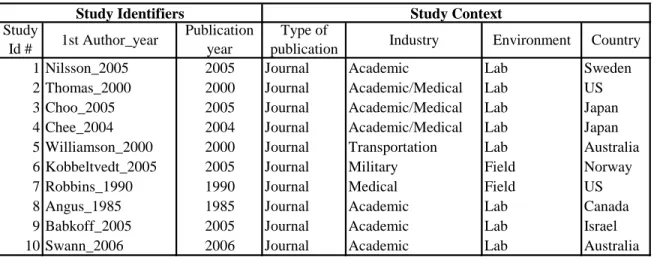
Table 14: Coding Example of Study Identifiers and Study Context Data ... 72
Table 15: Sample Descriptors and Experimental Condition Coding Example ... 73
Table 16: Task Characteristics Coding Example ... 74
Table 17: Statistical Data ... 76
Table 18: Statistical Data Continued from Table 17 ... 76
Table 19: Desired Data for Collection ... 77
Table 20: Data Used for Analysis ... 79
Table 21: Error Conditions ... 80
Table 22: Resulting Studies Used in Analysis ... 94
Table 23: Resulting Studies and Performance Variables Reported Part 1 ... 95
Table 24: Resulting Studies and Performance Variables Reported Part 2 ... 96
Table 25: Resulting Studies and Performance Variables Reported Part 3 ... 97
Table 26: Studies w.r.t. Data on Number of Lapses ... 98
Table 27: Number of Data Points for Differences between Means for Number of Lapses ... 100
Table 28: Number of Data Points for ES Calculation (Number of Lapses) ... 104
Table 29: Number of Lapses vs. Hours of Wakefulness: Within-Study Regression Coefficients ... 105
Table 30: Overall Number of Lapses Equation Based on Within-study Regression ... 106
Table 31: Between-Studies Regression Coefficients for Number of Lapses vs. Hrs of Wakefulness ... 107
Table 32: Between-Studies Regression for Number of Lapses: Non-Significant Variables Removed ... 108
Table 33: Probability Ratios for Number of Lapses (k = 9, 10) ... 113
Table 34: Probability Ratios for Number of Lapses (k = 2) ... 115
Table 35: Probability Ratios for Number of Lapses (k = 1, 3, 6) ... 117
Table 36: Summary Data for Number of Lapses (k = 1, 2, 3, 6, 9, 10) ... 118
Table 37: Summary of Probability Ratios at 24 Hours of Wakefulness ... 118
Table 38: Descriptive Statistics for Number of Lapses Information ... 119
Table 39: Mean Probability Ratios for Number of Lapses and 95% CI (k = 1) ... 120
Table 40: Probability Ratios for Number of Lapses: Means and Standard Deviations .. 121
Table 41: Studies w.r.t. Data on Reaction Time ... 123
Table 42: Number of Data Points for Reaction Time ... 126
Table 43: Number of Data Points for Reaction Time Percentage Increase ... 127
Table 44: Number of Data Points per Study for ES Calculation (Reaction Time) ... 129
Table 45: Number of Data Points per Study for ES and β for Reaction Time (Values >10 Removed) ... 130
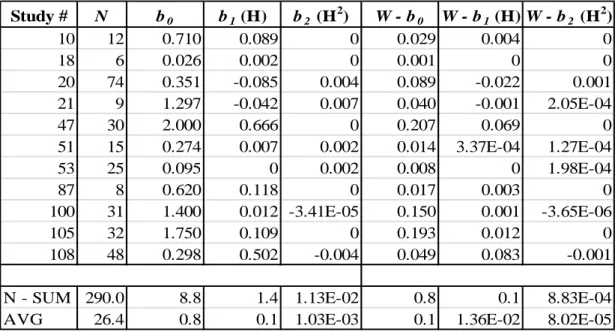
Table 46: Reaction Time vs. Hours of Wakefulness: Within-Study Regression Coefficients ... 133
Table 47: Overall Reaction Time Equation Based on Within-Study Regression ... 134
Table 48: Between-Studies Regression Coefficients for Reaction Time vs. Hours of Wakefulness ... 135
Table 49: Between-Studies Regression for Reaction Time: Non-Significant Variables Removed ... 136
Table 50: Reaction Time Predictive Model: Within-Study Regression Results... 137
Table 51: Leave-one-out Cross-Validation Results ... 139
Table 52: Summary of Within-Study Regression Data for ≤ 24 Hours of Wakefulness140 Table 54: Leave-one-out Cross-Validation Results ≤ 24 Hours of Wakefulness ... 140
Table 54: Residual Mean Squared Values ≤ 24 Hours of Wakefulness ... 141
Table 55: Probability Ratios Regression Models for Reaction Time (k = 250, 400)... 146
Table 56: Probability Ratios Regression Models for Reaction Time (k = 300) (Values >10 Removed) ... 148
Table 57: Probability Ratios Regression Models for Reaction Time (k = 500, 750)... 149
Table 58: Probability Ratio Regression Models for Reaction Time (k = 1000) ... 150
Table 59: Descriptive Statistics for Reaction Time ... 152
Table 60: Mean Probability Ratios for Reaction Time and 95% CI (k = 500) ... 153
Table 61: Probability Ratios for Reaction Time: Means and Standard Deviations ... 153
Table 62: Accuracy Data Summary ... 155
Table 63: Summary of Inter-rater Reliability ... 159
Table 64: Summary of Mean Probability Ratios: Means (Standard Deviations) ... 169
Table 65: Impact Factor of Journals in 108 List as of 2010 ... 204
Table 66: Impact Factor of Journals in 108 List as of 2010 Continued ... 205
Table 67: Summary Accuracy Data for Number Correct Data ... 207
Table 68: Number of Data Points from Each Study for Number Correct ... 209
Table 69: Number Data Points for Percentage Change for Number Correct Accuracy Data ... 210
Table 70: Number of Data Points for ES and β Calculation for Number Correct Accuracy Data ... 211
Table 71: Summary of Percentage Correct Data ... 213
Table 72: Number of Data Points for Percentage Correct Accuracy Data ... 215
Table 73: Number of Data Points for ES and β for Percentage Correct Accuracy Data 217 Table 74: Summary for Number of Errors Accuracy Data ... 219
Table 75: Number of Data Points for Number of Errors Accuracy Data ... 221
Table 76: Number of Data Points for ES and β for Number of Error Accuracy Data .... 222
Table 77: Probability Ratio Equations for Number of Error Data (k = 0 and k = 50) .... 224
Table 78: Summary of Percentage of Errors Accuracy Data ... 225
Table 79: Number of Data Points to Calculate Difference between the Mean Values... 227
Table 80: Number of Data Points per Study ES and β for Percentage Error Accuracy Data ... 228
Table 81: Probability Ratio Equations for Percentage Error Data ... 229
Table 82: Summary of False Positive Accuracy Data ... 230
Table 83: Number of Data Points per Study Difference between Mean Values (µC-µT) for
False Positives Accuracy Data ... 231
Table 84: Number of Data Points to Calculate ES and β for False Positives Accuracy Data ... 233
Table 85: Probability Ratio Equations for False Positives Accuracy Data ... 234
Table 86: Study Descriptors Raw Data Part 1a ... 238
Table 87: Study Descriptors Raw Data Part 1b ... 239
Table 88: Study Descriptors Raw Data Part 2a ... 240
Table 89: Study Descriptors Raw Data Part 2b ... 241
Table 90: Study Descriptors Raw Data Part 3a ... 242
Table 91: Study Descriptors Raw Data Part 3b ... 243
Table 92: Number of Lapses Raw Data Part 1a ... 244
Table 93: Number of Lapses Raw Data Part 1b ... 245
Table 94: Number of Lapses Raw Data Part 2a ... 246
Table 95: Number of Lapses Raw Data Part 2b ... 247
Table 96: Number of Lapses Raw Data Part 3 ... 248
Table 97: Reaction Time Raw Data Part 1a... 249
Table 98: Reaction Time Raw Data Part 1b ... 250
Table 99: Reaction Time Raw Data Part 2a... 251
Table 100: Reaction Time Raw Data Part 2b ... 252
Table 101: Reaction Time Raw Data Part 3a... 253
Table 102: Reaction Time Raw Data Part 3b ... 254
Table 103: Reaction Time Raw Data Part 4a... 255
Table 104: Reaction Time Raw Data Part 4b ... 256
Table 105: Reaction Time Raw Data Part 5a... 257
Table 106: Reaction Time Raw Data Part 5b ... 258
Table 107: Reaction Time Raw Data Part 6a... 259
Table 108: Reaction Time Raw Data Part 6b ... 260
Table 109: Reaction Time Raw Data Part 7a... 261
Table 110: Reaction Time Raw Data Part 7b ... 262
Table 111: Reaction Time Raw Data Part 8a... 263
Table 112: Reaction Time Raw Data Part 8b ... 264
Table 113: Reaction Time Raw Data Part 9a... 265
Table 114: Reaction Time Raw Data Part 9b ... 266
Table 115: Reaction Time Raw Data Part 10a... 267
Table 116: Reaction Time Raw Data Part 10b ... 268
Table 117: Reaction Time Raw Data Part 11a... 269
Table 118: Reaction Time Raw Data Part 11b ... 270
Table 119: Reaction Time Raw Data Part 12a... 271
Table 120: Reaction Time Raw Data Part 12b ... 272
Table 121: Percentage of Error Raw Data Part 1a ... 273
Table 122: Percentage of Error Raw Data Part 1b ... 274
Table 123: Percentage of Error Raw Data Part 2a ... 275
Table 124: Percentage of Error Raw Data Part 2b ... 276
Table 125: False Positive Raw Data Part 1a ... 277
Table 126: False Positive Raw Data Part 1b ... 277
Table 127: Percentage Correct Raw Data Part 1a ... 278
Table 128: Percentage Correct Raw Data Part 1b ... 279
Table 129: Percentage Correct Raw Data Part 2a ... 280
Table 130: Percentage Correct Raw Data Part 2b ... 281
Table 131: Percentage Correct Raw Data Part 3a ... 282
Table 132: Percentage Correct Raw Data Part 3b ... 282
Table 133: Number of Errors Raw Data Part 1a ... 283
Table 134: Number of Errors Raw Data Part 1b... 284
Table 135: Number Correct Raw Data Part 1a ... 285
Table 136: Number Correct Raw Data Part 1b ... 286
Table 137: Number Correct Raw Data Part 2a ... 287
Table 138: Number Correct Raw Data Part 2b ... 288
Table 139: Number Correct Raw Data Part 3a ... 289
Table 140: Number Correct Raw Data Part 3b ... 290
Table 141: Inter-rater Reliability Data Part 1 ... 291
Table 142: Inter-rater Reliability Data Continued Part 2... 292
Table 143: Inter-rater Reliability Data Continued Part 3... 293
ABBREVIATIONS
ATHEANA A Technique for Human Event Analysis BAC% Blood Alcohol Content (percentage)
EFC Error-Forcing Context
FSS Fatigue Severity Scale
HEP Human Error Probability
HERA Human Event Response Analysis
HRA Human Reliability Analysis
INL Idaho National Laboratory
NASA National Aeronautical and Space Administration
NRC Nuclear Regulatory Commission
PRA Probabilistic Risk Assessment
PSF Performance Shaping Factor
PVT Psychomotor Vigilance Task
SPAR-H Standardized Plant Analysis Risk – Human Reliability Analysis
THERP Technique for Human Error Rate Prediction
VAS Visual Analog Scale
CHAPTER I
INTRODUCTION
Many industries experience significant losses due to human error. Despite years of research, difficulties still exist in quantifying the direct contribution of human error to incidents that result in disaster and/or losses. Human reliability analysis (HRA) attempts to quantify human error probability under various situations. This information is useful in probabilistic risk analysis (PRA) of large complex systems, such as nuclear power plants. To date, HRA has mostly used expert opinion to quantify error probabilities resulting in discrepancy of risk assessments from one analyst to another (Boring, 2007).
One way to improve the technical basis of HRA methods is to quantify the effects of various performance shaping factors using empirical data. This dissertation investigates methods to develop such an objective technical basis and focuses on fatigue resulting from sleep deprivation. Information and data on sleep deprivation’s effect on performance are not explicitly included in current HRA methods. This dissertation develops a methodology for including sleep deprivation effects in human reliability analysis (HRA).
Background
The degree to which fatigue impacts human performance ranges from slight to catastrophic. In the case of large complex systems, it is possible for the fatigue-related
error of a single person working under sleep-deprived conditions to cause an industrial accident that can kill thousands of people, cause major environmental damage and/or cost billions of dollars (Dinges, 1995). Human error accounts for 30% to 90% of all industrial accidents (Reason, 1990). The percentage of incidents resulting from human error contributions for several industries is provided in Table 1. The US National Safety Council (1999) reported that human error was a root cause in 80% of all industrial accidents and responsible for $98.5 billion in accident-related costs. In the United States alone, human error is a contributing factor in over 90% of auto accidents (Treat et al., 1977) which cost approximately $160 billion dollars per year (Clifford, 2008).
Table 1: Estimation of Human Error Contributions as % of All Failures Aviation 70-80% Weigmann & Shappell (1999) Maritime Vessels 80-85% Baker & McCafferty (2005) Chemical Industry 63% Peters & Peters (2006) Nuclear Power (US) 50-70% Trager (1985)
Automobile 65% Dhillon (2007) Heavy Truck 80% Dhillon (2007)
Human errors occur in various industries and at great cost; therefore, there is a need to assess the role of the human in these errors. Human reliability analysis (HRA) is the attempt to predict the effect of human-system interactions on system reliability (Chandler et al., 2006). HRA grew out of the need to understand the human role in the operation of complex systems, like those listed in Table 1. These complex systems tend to have a low probability of a negative incident, but with high consequence (e.g., nuclear power plants). When an incident occurs at a high-profile, largely complex system, it attracts substantial attention from both industry and the general public. For example,
increased interest in occupational safety and human health resulted from the Three Mile Island nuclear power plant disaster in 1979, the Chernobyl nuclear power plant explosion in 1986, and the Challenger accident in 1986. These incidents have been the catalysts in driving the development of HRA methods (Reason, 1990).
One option for obtaining quantitative data for use in HRA is to collect the number of occurrences of events related to human performance (i.e., frequency data). However, since adverse events in nuclear power plants and other industries are atypical, there are not enough incidents to accurately use frequency data for HRA quantification while producing statistically significant results. HRA practitioners currently use whatever data exist (mostly expert opinion), updating when new information is obtained. The infrequency of adverse events in nuclear power plants motivates the investigation into other industries, such as aviation, medical, and the military, to gather field data.
To improve HRA, this research will explore and collate quantitative data on the effect of fatigue on performance. Cognitive fatigue, as caused by hours of wakefulness and measured through reaction time, accuracy, and the number of lapses, is evaluated in this research. Physiological measures of fatigue (e.g., critical flicker frequency, blood pressure, heart rate, etc.) are not investigated. Even though this research investigates reaction time, which does have a physical component, in simple reaction time experiments, the fatigue effect on performance has more to do with the draw on attentional capacity rather than on muscle fatigue. Reaction time is often used as a measure of cognitive performance throughout the psychological literature (Chee and Choo, 2004; Choo et al., 2005; Kobbeltvedt et al., 2005; Nilsson et al., 2005; Thomas et al., 2000; Williamson and Feyer, 2000). For the purposes of this research, fatigue will be
confined to that caused by sleep deprivation (i.e., hours of wakefulness) or acute fatigue.
Chronic fatigue, though an important cause of worker fatigue (Weinger and Ancoli- Israel, 2002), will not be examined in this research. The fatigue model used in this research is diagramed in Figure 1.
Figure 1: Fatigue Model
The length of sleep deprivation can be objectively measured by recording the hours of wakefulness. Also, sleep deprivation effects can be mitigated through risk analysis and regulation. Since fatigue cannot be directly measured, the typical performance metrics used to measure fatigue effects are: reaction time (RT), accuracy, and number of lapses.
The metrics of reaction time, accuracy, and number of lapses were selected as performance measures in this research because they are the most commonly reported metrics in the sleep deprivation literature and are output variables of working memory tasks. Performance on working memory tasks is predictive of performance on a range of other cognitive tasks (Kushida et al., 2005). Working memory is considered to be
Reaction Time
Accuracy
Number of Lapses Performance
Metrics Sleep
Deprivation Fatigue
fundamental to performance on virtually any neurocognitive task. The criteria for a cognitive performance task to assess neurobehavioral performance capability should have the following features: 1) uses basic expressions of performance (e.g., reaction time), 2) is sensitive to homeostasis and circadian rhythms, 3) is easy to learn or perform, 4) has sufficient task load (i.e., stimulus rate) to prevent boredom, 5) has sufficient re-test reliability, and 6) reflects an aspect of real-world performance (Kushida et al., 2005).
Performance tasks, such as PVT (Dinges and Powell, 1985) and SRT have the above features, and are useful in the tracking ability to access to the working memory of the prefrontal cortex of the brain.
The metrics of reaction time, accuracy, and number of lapses are typically the reported results of such working memory tasks. Reaction time, accuracy, and number of lapses provide an index of the degree of functional impairment from sleep deprivation that is meaningful and easily measurable outcome variables. Physical variables may also be measured, such as temperature and cortisol levels; but these variables do not measure performance decrements; which were the focus of this research.
These three metrics are measured through a variety of tasks in the literature, such as: vigilance tasks, timed tasks, dual or multiple tasks, mental arithmetic tasks, memory tasks, and others (Williamson and Feyer, 2000; Nilsson et al., 2005). New models are needed to transform reaction time, accuracy and number of lapses into human error probabilities (HEPs).
Research Objectives
The overall goal of this research is to improve the technical basis for including sleep deprivation effects in human reliability analysis (HRA) methods used in probabilistic risk assessment (PRA). Quantitative information to characterize the effect of sleep deprivation on performance was considered. Data were collected from existing psychological, medical, military, and transportation literature and in a structure that is compatible with meta-analysis technique and the Human Event Response Analysis (HERA) database being developed for the Nuclear Regulatory Commission (NRC), and the NASA HRA database; both of which are being developed at Idaho National Laboratory (INL).
The overall goal of this research can be divided into five sub-objectives:
1. Analyze existing HRA models and their treatment of cognitive fatigue;
2. Collect and analyze data with respect to the effect of sleep deprivation on performance through the meta-analysis research synthesis procedure;
3. Evaluate the quantitative effect of sleep deprivation on performance;
4. Derive performance shaping factor coefficients based on quantitative data to improve HRA models (e.g., SPAR-H); and
5. Conduct uncertainty analysis of the derived performance shaping factor coefficients.
The first objective includes evaluation and analysis of existing HRA methods and models, with a focus on how cognitive fatigue is covered, or not covered, in the existing models. The models investigated are: THERP (Swain and Guttman, 1983), SPAR-H (Gertman et al., 2005), and ATHEANA (USNRC, 2000). Fatigue was observed not to have been explicitly covered in THERP (Swain and Guttman, 1983), SPAR-H (Gertman et al., 2005), and ATHEANA (USNRC, 2000) HRA methods.
The second objective is to interpret and synthesize the fatigue data from research literature, nuclear power plant-specific sources, and other industries with similar demands
on operating personnel. The meta-analysis technique of research synthesis is used for this purpose.
In the third objective, the quantitative effect of sleep deprivation on performance is evaluated. This is done by analyzing the data collected from objective two. For example, the change in performance after sleep deprivation is evaluated using effect size, percentage change, and failure probabilities. The results are segregated by reaction time, accuracy and number of lapses.
The fourth objective derives performance shaping factor coefficient values based on quantitative data gathered in objective two, based on the analysis in objective three.
This is done through ratios of the probability of failure between the test and control conditions of performance.
The fifth objective is to conduct uncertainty analysis on the derived performance shaping factor coefficient values. The calculated performance shaping factor coefficient values show significant variability due to sparse data. Data were subdivided into twenty hour intervals (i.e., < 20, 20-40, 40-60, 60-80, and > 80), and the mean and standard deviation was used to find a confidence interval over the twenty hour time blocks. Also, the uncertainty associated with the coding process of the quantitative data is evaluated by calculating the inter-rater reliability.
Organization of the Dissertation
This dissertation is organized into six chapters. Chapter two includes a review of HRA methods, the difficulties in defining fatigue, sleep deprivation literature, and the shortcomings of current HRA methods with respect to the treatment of fatigue and sleep
deprivation. The third chapter discusses the meta-analysis technique of data collection and the coding procedure. Chapter four develops the methodology used to evaluate the quantitative effect of sleep deprivation on performance and to derive performance shaping factor multipliers for modifying the base error probability. The fifth chapter provides the results of the application of methodology and uncertainty analysis. Chapter six discusses the conclusions drawn and future research needs.
CHAPTER II
FATIGUE RESEARCH AND HRA METHODS
This chapter provides a review of fatigue and sleep deprivation studies and probabilistic risk assessment (PRA) and HRA methods. The difficulties in defining sleep deprivation and the problems associated with sleep deprivation research studies are discussed. Three HRA methods are explored in detail with respect to the inclusion of fatigue effects. Incidents attributed to fatigue in the nuclear industry and other industries are discussed. Also explored in this chapter are the effects of fatigue and sleep deprivation in quantitative HRA.
Fatigue
Unlike chemical impairment due to alcohol or drugs, which can be detected by biochemical tests, fatigue is more difficult to measure and discern as the cause of reduced performance. Typically, fatigue must be inferred from the context of the situation. For example, in the case of a single car accident, fatigue or even having fallen asleep, may not be listed as the cause of the accident; instead only the end result, such as driving into a ditch, might be listed, even when it is reasonable to assume fatigue as a root cause.
Despite this limitation, fatigue has increasingly been claimed as the primary cause of numerous accidents (Mitler et al., 1988).
The effects of fatigue on performance have been documented as a root cause of many of the major industrial accidents of the last thirty years (Mitler et al., 1988).
Examples of some accidents with global impact that are believed to have human fatigue as a root cause are listed in Table 2. Although fatigue is not the sole cause of the accidents listed in Table 2, it is considered a contributing factor.
Table 2: Incidents That List Human Fatigue as a Root Cause1
Three Mile Island 28-Mar-79 USA 4:00 None Mitler et al. 1988
Davis-Besse 9-Jun-85 USA 1:30 None Mitler et al. 1988
Challenger 28-Jan-86 USA 11:39 7 Mitler et al. 1988
Hinton train disaster 8-Feb-86 Canada 8:41 23 Halliday, 1997
Chernobyl 26-Apr-86 USSR 1:23 50 Mitler et al. 1988
Exxon Valdez 24-Mar-89 USA 0:04 None Dement, 1992
Peacock 18-Jul-96 Australia 1:55 None Folkard, 2000
Am. Airlines Flight 1420 1-Jun-99 USA 23:50 11 deaths, 110 injured Hirshkowitz & Smith, 2004 Staten Island Ferry 15-Oct-03 USA 15:21 11 died, 71 injured Hirshkowitz & Smith, 2004
Death Toll Reference
Accident Date Country
Time of Event
On January 28, 1986, National Aeronautics and Space Administration (NASA) managers, after working over 20 hour shifts, made the critical decision on whether to launch with their knowledge of O-ring failures at low temperatures; this resulted in the catastrophic failure of the shuttle orbiter Challenger (Mitler et al., 1988; Morgan 1996;
Eller and Minkley 1998; Rogers Commission Report 1986; Reason, 1990).
On February 8, 1986, in Canada, a VIA Rail (passenger train) collided with a Canadian National Railway (freight train) near Hinton, Alberta, west of Edmonton. The
1 Additional information on the incidents is available in Appendix B.
accident was the result of the crew of the freight train having become incapacitated by fatigue (Halliday, 1997).
On March 24, 1989, the Exxon Valdez oil tanker struck a reef in Prince William Sound, Alaska, and spilled 11 to 32 million gallons of crude oil. The accident was caused by the third mate improperly maneuvering the vessel. He had had only 6 hours of sleep in the previous 48 hours, while the first mate had been working for 30 hours continuously. The estimated cleanup cost was $2 billion dollars, including $41 million to clean and rehabilitate approximately 800 birds and a few hundred sea otters (NSTB, 1989; NSTB, 1990; Dement, 1992; Hassen, 2008; Eller and Minkley, 1998; Exxon Valdez Oil Spill Trustee Council, 2008).
At 01:55 a.m. on July 18, 1996, the Peacock, a cargo vessel carrying 605 tons of heavy fuel oil, ran aground on the Great Barrier Reef at full speed. The inquiry to the accident suggested that the pilot had fallen asleep fifteen minutes before the grounding.
Minor damage occurred to the reef and pollution was negligible (Folkard, 2000; Parker et al., 1998). On October 15, 2003, the Staten Island Ferry, vessel Andrew J. Barberi, piloted by the assistant captain, ran the ferry into the dock at full speed. The pilot made no attempt to slow down because he had fallen asleep at the controls. Eleven were killed and seventy-one injured (Hirshkowitz and Smith, 2004).
On June 1, 1999, an American Airlines Flight 1420 from Dallas, Texas, to Little Rock, Arkansas, overran the runway upon landing and crashed; eleven were killed and 110 injured. Pilot fatigue and the resulting diminished judgment were listed as partial causes for the crash. The crew had been on duty for about 13½ hours at the time of the
incident (Malnic, 2001; Hirshkowitz and Smith, 2004; National Transportation Safety Board, 2001).
A sampling of human error with potentially severe detrimental impacts caused by fatigue can be found when looking at the history of nuclear reactors. The Three Mile Island incident occurred on March 28, 1979; nuclear reactor coolant escaped after the pilot-operated relief valve failed to close properly. The mechanical failures were compounded by the failure of operators to recognize that the plant was experiencing a loss of coolant. When the situation was realized, the crew was not able to solve the problem until the relief crew came on and took over for the fatigued crew. The incident occurred in the morning between 04:00 and 06:00 a.m. (Reason, 1990; Harrison and Horne, 2000; Monk, 2007; Mitler et al. 1988; USNRC, 1979). Another incident occurred on June 9, 1985, at 01:30 a.m., when the Davis-Besse (Oak Harbor, Ohio) nuclear power plant went into automatic shutdown after a loss of cooling water and then had a total loss of the main feed-water. The incident was compounded when the operator pushed the incorrect button and turned off the auxiliary feed-water system. The operator’s error was discovered by workers coming on the next shift (Coren, 1996; Mitler et al. 1988;
USNRC, 1985).
On April 26, 1985, at approximately 01:30 a.m. at the Chernobyl nuclear power facility in the Ukraine, workers turned off critical automatic safety systems causing the reactor to begin to overheat. The sleep-deprived shift workers had turned off the cooling system instead of turning on the automated safety systems. This caused the reactor to overheat and led to the explosion that released 13 million curies of radioactive gases and less than 20 curies of iodine-131 (Coren, 1996; Mitler et al., 1988; USNRC, 1987b;
Reason, 1990). These are only a few major incidents known to have been at least in part caused by fatigue.
An example of an event resulting from fatigue that did not result in a major accident, but posed a severe threat to public safety, occurred at the Peach Bottom Atomic Energy Plant (USNRC, 1987a). In 1987, during a routine, but unannounced, inspection of the Peach Bottom plant, U.S. Nuclear Regulatory Commission (NRC) inspectors found control room operators asleep in their chairs. According to the USNRC report, the management at Peach Bottom had a plan of willful circumvention of USNRC guidelines by inventing its own mechanism to handle worker fatigue associated with the night shift work: allowing control room operators to sleep during the night shift. Consequently, the NRC ordered the power station shut down; this was a first in American nuclear power history. Despite being a state-of-the-art and high-efficiency plant, management had overlooked the effects of human limitations in 24 hour operations. Even though no nuclear accident had occurred, the plant closure, which resulted from human inattention, resulted in enormous costs.
Although the incident at Peach Bottom occurred in 1987, and guidelines were in place at the time for limiting work shift hours (10-CFR26.20), similar events still occur at nuclear power plants. Again, in 2007, at the Peach Bottom Plant, a video of sleeping security guards was taken by a fellow guard and released to the media (Mufson, 2008).
Table 3 provides a list of events at nuclear power plants that involve similar situations of sleeping or inattentive workers. Incidents, such as those in Table 3, occur because the NRC procedures include only prescriptive and general guidelines on working hours and shifts, aimed at limiting worker fatigue. The USNRC recognized that fatigue is an
important component to safe operations and that the fitness-for-duty guidelines (10- CFR26.20) need to be more inclusive of fatigue effects and not just chemical impairment (Persensky et al., 2002). The fitness-for-duty guidelines were changed in 2008, increasing the minimum break between shifts, limiting the reasons for waivers for overtime limits, and establishing training for fatigue management (Lenton, 2007). This move addressed the fundamental issue of fatigue and its effects on overall human error probability (HEP).
In several incidents, security officers have been found sleeping or inattentive (Seabrook, 2002; Oyster Creek, 2003; Beaver Valley, (2004 and 2005); Three Mile Island, 2007; Peach Bottom, 2007). In two incidents, security officers had fallen asleep while driving (Millstone, 2002; Braidwood, 2004). In two others, control room operators were found asleep at their stations (Massachusetts Institute of Technology, 2003; Pilgrim, 2004). Table 3 also includes incidents of work hour violations, (Susquehanna, 2002; St.
Lucie, 2003), along with a court case brought by an engineer who had been fired after complaining about hours beyond the work limitations (D.C. Cook, 2004). Three reports included security officers being threatened with disciplinary actions or being sent to a psychiatrist when they complained of working their 6th day of 12 hour shifts (Indian Point, 2003; Prairie Island, 2003; Wakenhut Security, 2003).
Table 3: Recent Nuclear Power Plant Fatigue Related Incidents
Date Plant Report/Reference Incident Description
Jul. 2002 Seabrook IR ML022000576 Security officer inattentive to duty Nov. 2002 Millstone POGO (2002) Security guard falls asleep and drives into
concrete barrier IR 50-387/02-05
IR 50-388/02-05 IR 72-28/02-01 IR 50-335/02-04 IR 50-389/02-04 Mar. 2003 Indian Point &
Prairie Island POGO (2002); Gordon (2003) Guards who claimed they were too tired to work a 6th 12-hour shift were sent to psychiatrists Apr. 2003 Oyster Creek IR 05000219-03-003 Two guards found asleep at checkpoint Jun. 2003 MIT IR 50-20/2003-1 Sleeping operator in control room
Apr. 2004 Beaver Valley Lenton (2007) Security guard found sleeping
Jun. 2004 Pilgrim
IR 05000293-05-003
Sleeping operator in control room at nuclear power plant on video
Dec. 2004 Braidwood POGO (2002) Security guard falls asleep, drives patrol vehicle into fence
Feb. 2005 Beaver Valley catonavenue Security guard found inattentive
Apr. 2007 TMI Lenton (2007) Security guards found inattentive
Sep. 2007 Peach Bottom Mufson (2008) Video of sleeping security guards released Apr. 2004 D.C. Cook I&M v. Kenneth Tipton $264K in damages paid to an engineer fired
after complaining he was forced to work excessive hours
Aug. 2003 Wackenhut
POGO (2002)
Inside NRC reports that guards who refuse 5th or 6th 12-hour shift could face discipline Nov. 2002 Susquehanna
NCV for failure to maintain adequate shift coverage without routine heavy use of overtime
Jan. 2003 St. Lucie NCV for multiple instances of individuals
exceeding overtime limits without authorization
Note: IR is a USNRC incident report, NCV is a USNRC NonCited Violation, and POGO is the Project on Government Oversight
The incidents in Table 2 and Table 3 emphasize the need for a method to measure the impact of fatigue on human performance, specifically human error. One option would be through human error probabilities (HEP). HEPs are used in human reliability analysis (HRA), which attempts to include the role of the human in the overall system reliability.
Difficulties in Defining Fatigue
While fatigue is a major risk factor, it is not easy to define; few words have been less adequately described or understood (Schmitt, 1976). Fatigue is used as the name of the condition and the experience of feeling tired and weary (Bartley, 1957). Unlike physical fatigue, mental fatigue can only be inferred from the context of the evidence;
which leads to fatigue often being defined in terms of its consequences rather than its causes. Fatigue is a personal experience and is a function of the individual’s motivation and past and present circumstances.2
Fatigue results not only from prolonged activity, but also from psychological, socioeconomic, and environmental factors that affect the mind and body. Figure 2 shows Grandjean’s (1968) analogy of fatigue being liquid filling a bucket. Grandjean compared fatigue to the level of liquid in the container (bucket) that is being continuously filled by:
monotony of task, environment, intensity and length of work, psychological and physical factors, and it can only be emptied by recovery or rest.
2 See Appendix A for additional information on fatigue.
Figure 2: Fatigue as a Bucket (Grandjean, 1968)
Fatigue can lead to impaired performance, such as diminished short-term memory, reduced aversion to risk, and degraded communication skills (Dinges, 1995).
Fatigued subjects tend to choose low effort/low probability of success strategies over high effort/high probability of success options. In the confines of the workplace, fatigue can occur when an individual cannot meet self-imposed or externally imposed performance goals, because of a sense of duty and/or the need to safeguard the lives of others, and is forced to continue working under adverse conditions (Brown, 1994).
Another difficulty with the study of fatigue is that it suffers from not having a formal scientific or operational definition, such as the term work in regards to mechanical systems, W = F*d where W is work, F is force, and d is displacement. Also, the term fatigue covers mental/cognitive and physiological fatigue and acute and chronic fatigue.
A further complication comes from the fact that fatigue cannot be directly measured, but
instead must be inferred from changes in other conditions, such as reaction time, body temperature, sleep latency (i.e., time taken to fall asleep), etc. (Boring et al., 2007).
Measurement of Fatigue
There is no direct objective measure of fatigue. There are subjective fatigue scales that are used to indicate the level of fatigue. One of these is the fatigue severity scale (FSS) by Krupps et al. (1989) that uses nine statements on a seven-point scale of agreement; for example, one statement is how fatigue interferes with physical functioning. The fatigue severity scale measures the impact of fatigue on specific types of functioning, relating to behavioral consequences of fatigue rather than symptoms. The other commonly used fatigue scale is the visual analog scale (VAS) by Bond and Lader (1974). A 100-mm scale line, ranging from not at all to extremely fatigued, is used for the subjects to describe the level of fatigue they are experiencing. These measures are useful for the investigation of levels of fatigue, but are not appropriate for the study of effects on performance.
Work scheduling programs such as Fatigue Avoidance Scheduling Tool (FAST) (Hursh et al., 2004), Manpower and Personnel Integration (MANPRINT) (Army Regulation 602-2, 2001), and Micro Saint (USNRC, 1995) consider the effect of fatigue and sleep deprivation on performance. The software programs aid in limiting the negative effect of fatigue caused by work schedules, but rely mostly on circadian influences on performance for input. The effect of fatigue is not measured in these programs but mitigated.
Performance moderator functions (PMFs) are used in modeling and simulation of human behavior models. PMFs are similar to performance shaping factors (PSFs) used in HRA. For example, for the Endocrine response to an acute psychological stress, the PMF is continuous-time measurement of the plasma concentration level of sympathetic adrenal and pituitary hormones (Richter et al., 1996). Performance moderator functions can be used to represent the behavior or cognition that is needed in a simulation. PMFs are used in SAFTE™, from which FAST™ is derived. Both software programs are used to aid in operator scheduling, i.e., fatigue problems with sustained operation, but do not provide a quantitative value for the effect of sleep deprivation performance. The result from FAST™ is expressed in qualitative terms as a percentage of effectiveness.
The fatigue avoidance scheduling tool (FAST™) was designed by the US Air Force Research Laboratory (AFRL) in 2000 to address the problem of fatigue associated with aircrew flight scheduling (Eddy and Hursh, 2001). FAST™ is a Windows-based program that quantifies the effects of various work-rest schedules on human performance.
The output from FAST™ produces a graphical display of cognitive performance effectiveness (y-axis), using a scale from 0 to 100% effectiveness, as a function of time (x-axis). The effectiveness rating represents a composite of human performance on a number of tasks, but does not provide a numerical value of the effect of sleep deprivation on performance (i.e., error probability). The goal of users is to manipulate the lengths of work and rest periods to keep performance at or above the 90% effectiveness level.
Performance effectiveness is determined by: time of day, biological rhythms, time spent awake (i.e., hours of wakefulness), and amount of sleep.
Fatigue predictions in FAST™ are derived from Sleep Activity, Fatigue, and Task Effectiveness (SAFTE) (Hursh, 1998). SAFTE™ produces a three-process model of human cognitive effectiveness by integrating quantitative information about: (1) circadian rhythms in metabolic rate; (2) cognitive recovery rates related to sleep and cognitive decay rates associated with wakefulness; (3) cognitive performance effects associated with sleep inertia. The rating of cognitive effectiveness is dependent on the current balance of the sleep regulation process, the circadian process, and sleep inertia.
The sleep regulation process is dependent on hours of sleep, hours of wakefulness, current sleep debt, the circadian process, and sleep fragmentation (i.e., awakening during sleep). In SAFTE™ the focus is on the circadian process, the cognitive effectiveness, and sleep regulation.
FAST™ was used to evaluate data from US freight railroads and find a correlation between effectiveness and number of human factor errors. The results found that there exists a meaningful relationship between accident risk and effectiveness (Hursh et al., 2006). Attempts to apply FAST™ to daily flying scheduling operations were unsuccessful, due to the user interface having been designed for scientists and not for operators. FAST™ has been used for operation risk management of fatigue effects, but is not designed for use in HRA.
This dissertation sought to develop a method to derive PSF coefficients that will modify the basic error probability, based on quantitative data. SAFTE™ and FAST™
are fatigue management tools trying to insure sufficient rest to maintain effective performance. While useful in designing work schedules, they are not directly applicable to HRA methods; i.e., they do not provide error probabilities or PSF coefficient values.
In further research it may be possible to extrapolate the output of FAST™ and SAFTE™
to validate the derived PSF coefficient values for sleep deprivation effects on error probabilities. The types of tasks are also not delineated in FAST™. The developed PSF coefficient derivation method can be adapted easily for specific types of tasks by using the data on similar tasks to derive the PSF coefficient values; this is not possible with FAST™.
The three main causes of cognitive fatigue are sleep deprivation, shift work, and time on task. Sleep deprivation, or hours of wakefulness, lends itself best to research studies because it is relatively simple to achieve and straightforward to measure. While fatigue and sleepiness are often used interchangeably, they are different phenomena.
Sleepiness has to do with the propensity to fall asleep, while fatigue is a sense of tiredness or exhaustion associated with impaired (i.e., depletion of capacity) physical and/or cognitive functioning (Shen et al., 2006).
Fatigue effects on performance are measured indirectly through performance metrics: typically reaction time, accuracy, and number of lapses. These three metrics are measured through a variety of psycho-motor tasks in the literature, such as: vigilance tasks, timed tasks, dual or multiple tasks, mental arithmetic tasks, memory tasks, and others (Williamson and Feyer, 2000; Nilsson et al., 2005).
Measurement of Sleep Deprivation Effects on Performance
There is a wide body of research literature on the effects of fatigue on performance in many different fields. The literature predominately focuses on sleep deprivation due to its easy manipulation for study purposes as opposed to shift work and
time-on-task experiments. Although it is simple to cause sleep deprivation, it does not follow that it is easy to summarize the available literature. There are no standard protocols for sleep deprivation research. There are many differences between the studies, e.g., the way sleep deprivation is induced, hours of wakefulness, what type of task is used to evaluate performance, etc., (see Table 4).
Table 4: Factors That Differ in Sleep Deprivation Studies
Acute Chronic
Laboratory or Field
Environment (e.g., Zeitgebers) Physical Activity Level Age Range
Sex
Personal Characterisitcs
Type of Subjects (e.g. student volunteers) Subjective, Objective, or Psychomotor Simulated Real World
Real Work
Complexity Level (e.g., simplified task) Isolated Task
Definition of Sleep Deprivation
Experimental
Design Subject Differences Study Setting
Task Details Type of Task
Hours of Wakefulness Type of Sleep Deprivation
In order to illustrate the magnitude of fatigue effects on performance, several research studies comparing performance at various blood alcohol content (BAC %) levels and hours awake are reviewed. The purpose of these studies is to equate the performance degradation at a specific level of BAC% to that of hours of wakefulness. There exists better understanding of performance under the influence of alcohol than under sleep deprivation. These studies illustrate the lesser known, but more common, serious effects of sleep deprivation in our culture as compared to better known BAC%.
A review of six studies (Arnedt et al., 2000; Arnedt et al., 2001; Dawson and Reid, 1997; Lamond and Dawson, 1999; Marmuff et al., 2005; Williamson and Feyer, 2000) is used here for illustration of the comparison between sleep deprivation and blood alcohol concentration on performance. These studies showed that performance at 17 to 24 hours of wakefulness equated to the same level of performance at BAC% of 0.05 (the legal limit in many countries); 20 to 24 hours of wakefulness corresponded to a BAC% of 0.08 (the legal limit in the US), and 20 to 25 hours of wakefulness to a BAC% of 0.1.
The results are reported in ranges of hours of wakefulness to BAC% due to the fact that different tasks were used in the studies.
The different tasks used to evaluate performance included: simulated driving task in Arnedt et al. (2000) and Arnedt et al. (2001); Mackworth clock vigilance task (Mackworth, 1950) in Williamson and Feyer (2000); simple reaction time from the CogState test battery in Marmuff et al. (2005); tracking tasks in Lamond and Dawson (1999) and Dawson and Reid (1997); grammatical reasoning and vigilance task in Lamond and Dawson (1999).
A simulated driving task measuring performance through lane position and speed deviation was used in Arnedt et al. (2000) and Arnedt et al. (2001). Performance in the simulated driving task was equivalent at 18.5 hours of wakefulness to a BAC% of 0.05 and at 20 and 21 hours of wakefulness to a BAC% of 0.08. When a tracking test was used to evaluate performance, such as in Dawson and Reid (1997) and Lamond and Dawson (1999), the results showed that 17 hours of wakefulness equated to a BAC%
level of 0.05, 24 hours of wakefulness equated to a BAC% level of 0.08, and 25 hours of wakefulness equated to a BAC% level of 0.1. Two of the studies employed a vigilance
task (Lamond and Dawson, 1999; Williamson and Feyer, 2000). The findings for these studies were that 17 hours of wakefulness equated to a BAC% of 0.05 and that 25 hours of wakefulness on the latency component of the vigilance task and 22.3 hours of wakefulness on the accuracy component of the vigilance task corresponded to a BAC%
of 0.1. A grammatical reasoning task (Baddeley, 1968) was used in Lamond and Dawson (1999) that equated performance at the BAC% level of 0.1 to 20.3 hours.
When looking at the data from a complexity level, the more demanding the task is cognitively, the fewer hours of wakefulness are needed to produce impairment equivalent to higher BAC% levels. For example, the more complex task of grammatical reasoning performance level for 20 hours of wakefulness was the same as at the BAC% of 0.1.
However, for the less cognitively demanding tracking task, performance after 25 hours of wakefulness was the same as at the BAC% level of 0.1. The damaging effects of sleep deprivation (extended hours of wakefulness) on performance is illustrated through these studies by equating common legal limits of BAC% performance to that of hours of wakefulness. Table 5 presents a summary of the hours of wakefulness that were compared with BAC% and the type of task used.
Table 5: Hours of Wakefulness Compared to BAC% Levels
Study Reference Hrs Sleep Dep BAC % Task
Arnedt et al., 2001 18.5 0.05 Simulated driving task Dawson and Reid, 1997 17 0.05 Tracking task
Marmuff et al., 2005 24 0.05 Simple reaction time Williamson and Feyer, 2000 17 0.05 Mackworth clock Arnedt et al., 2001 21 0.08 Simulated driving task Dawson and Reid, 1997 24 0.08 Tracking task
Arnedt et al., 2000 20 0.08 Simulated driving task
Lamond and Dawson, 1999 20.3 0.10 Grammatical reasoning - latency Lamond and Dawson, 1999 24.9 0.10 Vigilance - latency
Lamond and Dawson, 1999 22.3 0.10 Vigilance - accuracy Lamond and Dawson, 1999 25.1 0.10 Tracking task
Figure 3 shows a graphical representation of BAC% compared to hours of wakefulness. Tasks are divided into three categories: complex, motor, and cognitive.
Driving simulation (Arnedt et al., 2000 and Arnedt et al., 2001) was considered a complex task. Tracking tasks (Dawson and Reid, 1997 and Lamond and Dawson, 1999), vigilance tasks (Lamond and Dawson, 1999), Mackworth clock, a vigilance and tracking task, (Williamson and Feyer, 2000), and simple reaction time (Marmuff et al., 2005) were considered to be examples of motor tasks. The grammatical reasoning task used in Lamond and Dawson (1999) was considered to be a cognitive task.
Figure 3: Hours of Wakefulness Compared to BAC%
Not many would consider driving a motor vehicle with a BAC% level above the legal limit, but few would think twice about getting behind the wheel after 20 hours of wakefulness. These findings begin to illustrate the seriousness and safety risk that the ever increasingly sleep-deprived population presents.
Sleep deprivation is important and needs to be considered in formal risk assessments. The most widely used formal risk assessment is probabilistic risk assessment (PRA) (Gertman and Blackman, 1994).
Probabilistic Risk Assessment (PRA)
Risk assessment provides a means of informing decision makers and identifying failure-prone situations. Probabilistic risk assessment (PRA) can be used to determine system reliability, improve plant layout, validate system design, and determine frequency
0.02 0.04 0.06 0.08 0.10 0.12 0.14 0.16
15 20 25 30
Hours of Wakefulness
BAC%
Complex Motor Cognitive
Linear (Complex) Linear (Motor)
of error incidents. Risk assessment involves identifying the potential risks (i.e., understanding of the hazards), the likelihood of occurrences (i.e., frequency), and the consequences when they do occur. Risk is the likelihood of a hazard-causing loss or damage. Often risk is defined as the probability of an incident multiplied by its consequence as in Equation 1:
Risk = P(Event) * Consequence (1)
Normally, a risk analyst is concerned with what can go wrong, how likely something is to go wrong, and the consequences when something does go wrong. PRA evolved from the need to estimate the frequencies of accidents in complex systems when the data on actual incidents are very small and often zero (Bier, 1999). Typically, there are failure rates for components of the system, for example pumps and valves, but not for the overall system. These component failure rates are propagated through a fault-tree or event-tree model to estimate an overall failure probability of the system (Bier, 1999).
The extreme cost of complex systems, such as nuclear power plants, made the initial development of PRA techniques cost-effective, since a power plant may cost two billion dollars while a full-scope PRA may cost only two million dollars. The resulting PRA may establish safety improvements that are in the tens of thousands of dollars in cost, while yielding large reductions in overall plant risk (Garrick, 1987).
The aim of PRA is to identify areas of significant risk and identify improvements and quantify the overall risk to the plant. PRAs analyze the risk of entire systems by decomposing the systems into their components (e.g., including hardware, software, and human operators). A PRA is begun with an initiating event and is based on the sequence
of possible scenarios and possible resulting errors pursuant to that initiating event. PRA is basically a logic-tree model of the plant and its functions (e.g., fault-trees) (Reason, 1990). The general structure of PRA was established from the 1975 Rasmussen Report commonly referred to as WASH-1400 (Rasmussen, 1975).3 The steps are:
1) identify the source of the potential hazard, 2) identify the initiating events,
3) establish possible sequences stemming from various initiating events using event- trees,
4) quantify each event sequence
a. frequency of the initiating event
b. probability of failure of the relevant safety system when needed, and 5) determine overall plant risk (function of all possible accident sequences and their
consequences).
Even though this structure depends on conditional probabilities, which are rarely collected in practice and often independence of events is assumed, the development of a standardized PRA method was a major step forward in reliability engineering (Reason, 1990).
One difficulty in PRA is that it is limited by the lack of empirical data; this makes PRA hard to validate. This also creates a need to look for better resolution of the models.
One of the least data supported components of PRA is HRA. There is a significant need to improve risk assessment in order to have a realistic risk informed approach. The Nuclear Energy Association stated, “Any improvement in the current state of knowledge
… would have a positive impact on the confidence in probabilistic safety assessment results” (NEA, 1998). There is a need to improve HRA to help with the continual
3 WASH-1400 was replaced with USNRC (1975) NUREG-75/014 and is now USNRC (1990)