Volume 6 Issue 2 Article 9
12-31-2023
Creating Interconnected Outdoor Green Infrastructure in The Case Creating Interconnected Outdoor Green Infrastructure in The Case of Aksum Historical Sites, Ethiopia
of Aksum Historical Sites, Ethiopia
Guesh Hagos Gebru
Adigrat University, Ethiopia, [email protected]
Follow this and additional works at: https://scholarhub.ui.ac.id/jid Part of the Urban, Community and Regional Planning Commons Recommended Citation
Recommended Citation
Gebru, G. H. (2023). Creating Interconnected Outdoor Green Infrastructure in The Case of Aksum Historical Sites, Ethiopia. CSID Journal of Infrastructure Development, 6(2). https://doi.org/10.7454/
jid.v6.i2.1122
This Article is brought to you for free and open access by the Faculty of Engineering at UI Scholars Hub. It has been accepted for inclusion in CSID Journal of Infrastructure Development by an authorized editor of UI Scholars Hub.
CREATING INTERCONNECTED OUTDOOR GREEN INFRASTRUCTURE IN THE CASE OF AKSUM HISTORICAL SITES, ETHIOPIA
Guesh Hagos Gebru1, *
1Urban Design, Adigrat University, 7040, Ethiopia
(Received: November 2023 / Revised: November 2023 / Accepted: December 2023)
ABSTRACT
This study investigates the state of outdoor green infrastructures (GI) in Aksum, Ethiopia, employing qualitative and quantitative approaches to address the disconnect between the expanding urban fabric and sustainable green space development. Sentinel satellite imagery and public perception surveys revealed a fragmented landscape of green spaces, including underdeveloped areas like heritage sites, cemeteries, churches, public spaces, stream fronts, and roadside spaces. Quantitative analysis using the Normalized Difference Vegetation Index (NDVI) and Normalized Difference Built-Up Index (NDBI) indicated limited healthy vegetation and a built environment predominance. NDVI values ranged from +0.1 to +0.5, suggesting the presence of grass and shrubs, while NDBI results varied between 0 and 0.252, reflecting low vegetative cover. Furthermore, the Built-Up (BU) index in residential zones ranged from -0.644 to +0.128, underscoring the poor condition of GIs and their lack of interconnectivity. Addressing these issues, the research proposes a conceptual design for an interconnected GI, integrating various urban spaces into a cohesive green network. This design aims to remedy the fragmentation and enhance the environmental, social, and economic aspects of urban life in Aksum.
Keywords: Built up creating; Green infrastructure; Heritage site; Interconnected; Normalized difference;
Vegetation index
1. INTRODUCTION
The concept of Green Infrastructure (GI) has increasingly become vital in shaping urban communities' political, social, and environmental fabric. This study focuses on the critical role of GI in fostering sustainable urban development, particularly in the context of Aksum, Ethiopia, an area undergoing rapid urbanization. Multicultural societies and groups worldwide have developed different spheres of knowledge about GI use and design (Hernández-Bonilla, 2008).
People’s ideas about GI depends on urban citizens' healthy psychological, political, and social connectedness. Accessibility to GI is linked to positive outcomes for people. Many recent descriptions of urban sustainability have now emerged to facilitate equitable, accessible, sustainable GI at all levels of urban boundaries (Gelan & Girma, 2021). GI's importance lies in its ability to create pedestrian-friendly environments that enhance social and ecological connectivity. Such infrastructures play a pivotal role in addressing urban citizens' psychological and social well-being, contributing significantly to the overall sustainability of cities.
GIs, the open spaces, are planned in the hierarchy of their requirement. The logical order is from the local up to the community park (Ghofrani et al., 2017). Providers of street services and waiting
*Corresponding author’s email: [email protected] DOI: 10.7454/jid.v6.i2.1122
for friends may be local initiatives and private organizations. The governments of cities have devoted themselves to showing their effort by creating representative GIs near their palace. They provide the three pillars of sustainability, solving ecological, economic, and social issues simultaneously. In addition, GIs are designed for political means (Furholt et al., 2020).
This paper explores GI's current state in Aksum and its implications for urban planning and community well-being. The extent to which existing GI meets the needs of the growing population and how it contributes to the three pillars of sustainability: ecological, economic, and social, were examined. Despite the recognized importance of GI, many urban areas, including Aksum, face challenges in developing interconnected and sustainable green spaces. This study addresses these challenges by proposing a framework for integrated GI planning, emphasizing the need for a hierarchy of green spaces ranging from local to community parks. This study’s approach combines theoretical insights with practical considerations to contribute to the broader discourse on urban sustainability and GI development. Therefore, this research aims to explore the topic using the following objectives:
1. Assess the quality of outdoor green infrastructures in the historical site of Aksum Town.
2. Investigate the users' perceptions of changing the outdoor green infrastructures into interconnected nature.
3. Integrate outdoor green infrastructures among themselves and with other existing infrastructures.
Previous studies ignore the possibilities of assessing all the options of green on street/roadside green, median green, and inside backyards of big institutions. They did not specify based on accurate images and inter and intra relationship of each green space. The objective analysis of the entire green network is not assessed. Furthermore, it does not show the interconnection of mitigating solutions that have immediate advantages for planners and designers (Assaye et al., 2017). Assessing the gap in the design of GI and the creation of an interconnected whole green network gives new insight for further developers and municipality designers. The new approach to GI creates a balance of nature conservation and sustainability for the users.
2. LITERATURE STUDY
2.1. The Design of Green Infrastructure
GI forms a critical network of interconnected green spaces and water bodies, seamlessly integrated within urban landscapes and extending into rural areas. This network encompasses diverse spaces – natural, semi-natural, and artificial – each contributing multifunctionally to the community's well-being. Such infrastructures aim to deliver comprehensive benefits:
environmental protection, social enrichment, and health enhancement, as highlighted by Allen et al. (2012). In the urban context, green spaces represent distinct segments of land allocated for recreation or vegetative purposes. The concept of Sustainable Green Space is pivotal, denoting areas that serve current generations and are preserved for future use. Central to this sustainability are the principles of minimizing environmental waste and adopting ecological thinking, as discussed (Shmelev & Shmeleva, 2009).
Furthermore, GI is characterized as a system comprising both man-made assets and ecosystem services dedicated to preserving and restoring nature. A holistic approach to GI planning fosters an interconnected Green Network, transcending the traditional benefits of isolated green spaces.
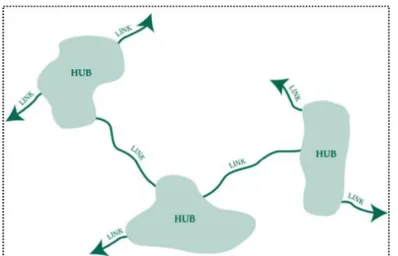
Interconnected Green Network interwoven into the multifaceted aspects of human life, offers greater collective benefits. The effectiveness of this network hinges on three integral components:
sites, hubs, and links. Sites encompass various amenities, such as hospitals, universities, and
individual plots. Hubs, conversely, are significant spaces serving as origin or destination points for species, doubling as centers for diverse activities, including work, recreation, and open-air events. Links, comprising linear elements along roads, landscapes, or riversides, interconnect these hubs, enhancing the network's functionality (see Figure 1). They include conservation corridors, green belts, landscape linkages, and utilitarian corridors. Such linear GI elements, encompassing utility rights of way (e.g., water, power, gas, telephone lines) and river canals, are pivotal in connecting green space hubs, as elucidated by Wolstenholme (2003).
Figure 1 Conceptual Framework of Green Network (Wolstenholme, 2023)
2.2. Sustainable Green Infrastructure
The management and sustainable utilization of urban landscapes are intrinsically linked to the concept of “Ecological Resilience.” This term refers to the capacity of ecosystems to absorb disturbances while changing yet retaining their core functional integrity. As Berghöfer et al.
(2020) articulate, the essence of GI lies in its role as an environmental linchpin, utilizing significant control over socio-economic dynamics. Central to this understanding is the interplay between Natural Capital (NC) and Ecosystem Services (ES), which are fundamental in sustaining urban environments and maintaining the general balance of ecosystems Berghöfer et al. (2020).
NC encompasses various environmental assets, including diverse species, communities, landscapes, ecosystems, soils, water, and air (see Figure 2). These elements collectively contribute to the wide array of services we derive from nature. Prominent among these services are carbon sequestration, erosion control, and water purification. In dense urban areas, outdoor GIs play a pivotal role in providing these varied ecosystem services, reinforcing the resilience and sustainability of urban landscapes.
Figure 2 Natural Capital and Ecosystem Services (Berghöfer et al., 2020)
2.3. Heritage Spaces and Green Infrastructure
Built heritage spaces have robust functions as the centers of attraction for local and non-local visitors. Therefore, these spaces should be integrated with GI. According to Coombes & Viles (2021), integrated heritage can have many advantages, which include: (1) Health and well-being:
heritage sites create a bridge between the past and present, enhancing visitor satisfaction and generating memorable experiences; (2) Environmental benefits: these spaces regulate urban temperature, balance CO2 and O2 levels, and improve air quality, furthermore, GI can mitigate climate variability and protect heritage buildings from environmental damage, including overheating effects and water or wind infiltration (McLean, 2017); (3) Biodiversity centers:
heritage sites facilitate the free movement and integration of plant and animal species, fostering biodiversity and cultural richness; (4) Water quality improvement: green heritage sites are crucial in reducing runoff, managing waste, and enhancing groundwater infiltration, thereby improving water quality downstream; (5) Urban agriculture promotion: these spaces can be utilized for gardening activities, like growing vegetables and flowers, as knowledge-sharing centers for agricultural and cultural services; (6) Noise reduction: well-vegetated heritage sites act as buffer zones, reducing urban traffic noise; (7) Employment opportunities: the management, maintenance, and operation of heritage sites require significant human resources, thus creating job opportunities; and (8) Social interaction and cohesion: heritage sites are unique in attracting diverse groups of people facilitating social interactions and cohesion. Di Turo & Medeghini (2021) note that few services can rival heritage sites in promoting social relations. Therefore, it is crucial that urban planning and GI initiatives strategically incorporate heritage sites, ensuring they are interconnected and equipped with essential services such as vegetation and utilities, as advocated (Alfasi & Fabian, 2009).
2.4. Creating Interconnected Green Infrastructure
The enhancement of GI is crucial in urban planning and can be achieved through several strategic initiatives, which include:
1. Improving pedestrian accessibility and connectivity by expanding pedestrian pathways, such as walkways within parks and sidewalks, makes green spaces more accessible and connected. Firmansyah et al. (2018) emphasize the importance of such infrastructure in augmenting cities' overall attractiveness and functionality.
2. Enhancing accessibility to facilities by providing essential amenities like car parking, shelters, and clear directional signage is vital in increasing the use of green spaces. The accessibility of these services directly influences the frequency of park usage by nearby residents, leading to more active interaction with the environment.
3. Ensuring safety and security measures by addressing safety concerns through adequate lighting, robust infrastructure, clear signage, and security presence can significantly reduce crime and fear, making green areas more inviting.
4. Improving aesthetic enhancement by adding thoughtful design elements that enhance attractive views and restrict undesirable ones, along with creating vantage points, can significantly boost the aesthetic appeal of green spaces.
5. Increasing economic benefits and the 'Proximate Principle'. According to Crompton (2007), the proximity to parks and squares correlates with increased environmental, social, and economic values, a concept known as the 'proximate principle.' Property values are higher near well-maintained GI, underscoring its economic significance.
6. Advancing green transportation and crime reduction by encouraging green transportation modes like cycling and pedestrian access, coupled with sufficient lighting and crime prevention strategies, can increase the utilization and safety of these spaces. Bowman et al. (2009) highlights that individual who engage with their environment are generally healthier than those confined to purely constructed urban areas.
Therefore, the interconnectedness of GI, encompassing pedestrian and cycling routes, safety measures, and aesthetic improvements, is integral to enhancing urban livability. These measures increase the usability of green spaces and contribute to the overall health, safety, and economic prosperity of urban communities.
2.5. Qualities of Green Infrastructure
The effectiveness of GI is gauged by its ability to fulfill users' environmental, health, social, and economic needs. Sugiyama et al. (2009) note the significant usage of GI by older populations, particularly in closer proximity. The overall attractiveness of a city is notably enhanced by sustainable GIs, which can be observed in the vibrancy of neighborhood movements, cafes near main roads, and specialized parks. Stessens et al. (2020) suggest that the quality of GI is best measured by its fitness for intended purposes, including accessibility, inclusivity, maintenance, and functionality.
2.5.1. Environmental Sustainability by Green Infrastructure
GI is critical in modifying climate and micro-climate conditions, such as controlling sun radiation, reducing temperature, and minimizing wind speed. It also contributes to lower energy usage through natural shading and green roofs and walls. Hydrological regulation is another key aspect, achieved through bio-swales, permeable pavements, and retention ponds. Furthermore, GI facilitates waste decomposition and biodiversity enhancement, as outlined (Firmansyah et al., 2018; Lee & Kim, 2015; Trica et al., 2019).
The morphology pattern and properties of urban surfaces determine the micro-climate of an area.
The street corridors, public places, and GIs regulate the change in climate in urban areas. Wind speed decreases in green GIs (Ogryzek et al., 2020). Interconnected GIs lower energy use, by covering buildings with green roofs and green walls and have shading by trees (Firmansyah et al., 2018). They have many cooling effects on walls, roofs, and surrounding backyards. The street side corridors and pedestrian footpaths will significantly reduce energy if they are well preserved, and the land is escaped. In cold and temperate zones, selected and evergreen plants are important.
The use of the plantation may be to break and moderate wind and airflow in and out of the city (Pan et al., 2019).
The other important use of GI is fostering hydrological regulation (Firmansyah et al., 2018). The hydrological cycle begins with the sun's energy in the solar system of the universe, giving energy to the earth's surface. Trees and grass cover the earth's surface, and surface waters evaporate the lower-energy air back into the atmosphere. This pattern regulates the water cycle. “The denser plants in the area, the better flow of rainwater is created.” The other important aspect of GI is enabling water percolation and reducing soil erosion (World Meteorological Organization, 2008).
GIs enable waste decomposition and cycling. The degradable wastes are decomposed in GIs.
These spaces cover different waste separation techniques according to material type and degrading capacity. They also reduce waste treatment plants. They have different recreation areas as well. The solid waste system, from waste production to sludge disposal into selected landfills, is regulated by natural processes.
2.5.2. Health Sustainability by Green Infrastructure
Interconnected GIs significantly improve mental well-being by reducing mental fatigue and promoting healthier emotions, as observed (Firmansyah et al., 2018). Mental well-being has two elements. It includes happiness, life satisfaction, self-realization, and psychological function (Houlden et al., 2017). GIs also reduce mental fatigue and stress (Beyer et al., 2014). Outdoor activities such as walking, sports, physical observing, swimming, playing with friends, and other activities change the mindset and bring health to mind (Lestan et al., 2014).
2.5.3. Social Sustainability by Green Infrastructure
GI improves social relationships (social interaction, integration, and cohesion) (Firmansyah et al., 2018). The degree of people integration or mix is higher as people meet regularly. People perceive the place they have spent more time with, likely famous friends, families, or relatives.
They create social bondage or cohesion. Regular encounters in green spaces can lead to lasting friendships and a strong sense of community (Chen et al., 2016; Ridwan et al., 2017; Salih &
Ismail, 2017). Physical spaces for various activities, including sports and leisure, are essential for nurturing social bonds and tourism. Outdoor activities such as design, multi-functionality, and creating access and user characteristic studies encourage tourism attraction (Salih & Ismail, 2017).
2.5.4. Economic Sustainability by Green Infrastructure
Sustainable spaces increase the economic status of the neighbors. These spaces encourage a rise in property values (land and property price) and increase local economic activity (attraction of local visitors, non-local visitors, and street vendors) (Firmansyah et al., 2018). These uses and differences from the other specific locations increase the demand for the location. This internship increases housing prices (Camargo, 2016). These GIs encourage outdoor activities along the street corridors and street cafes. They also attract retailers, businesspeople, and tourists to the site. Thus, landscape change and the quality enhancement of GIs attract people; they can be locals, people outside the neighborhood, and internationals (Camargo, 2016; Zhu et al., 2019).
2.5.5. Cultural Sustainability by Green Infrastructure
GIs encourage sociocultural sustainability. They improve urban farming (backyard gardening, green walls, green corridors) and create opportunities for recreation, tourism, and social interaction (the facilities are toilets, showers, animal play, fountain, colored plants, and landscaping) (Firmansyah et al., 2018). Urban farming creates the best role, from growing foods and fruits at the plot level to the neighborhood level, growing farmlands, and providing sufficient food for the community's urban spaces. The way urban expansion is used decreases the level of agricultural land. However, the increment of urban green GIs for different planting, fruiting, and growing crops enables the return of normal food security. Ridwan et al. (2017) state that edible landscape fruit planning and design promote food security.
2.6. Managing Green Infrastructure and User Experiences
Effective management of GI, pivotal in fostering social, economic, and environmental benefits, requires a multifaceted approach. Eagles et al. (2010) categorize management models into eight distinct types, each defined by its level of accountability and risk management. These models include: (1) National Park Model managed by the government, which focuses on providing and
maintaining park resources; (2) Parastatal Model that is provided by the government but operated with greater financial flexibility; (3) Non-Profit Organization Model that emphasizes conservation and advocacy, often in collaboration with public entities; (4) Public and For-Profit Combination Model, which is a partnership model between government and business organizations, leveraging public responsibility and private efficiency; (5) Public and Non-Profit Combination Model that combines public resources with non-profit organizations' advocacy and conservation focus; (6) Eco-Lodge Model that is tailored for eco-tourism, balancing environmental conservation with hospitality; (7) Aboriginal Combination Model: Integrates traditional and indigenous practices in natural resource management, predominantly in rural areas; (8) Traditional Community Model that relies on community-led initiatives and traditional methods of managing green spaces.
According to Eagles et al. (2010), the ‘national park model’ is where the government provides and manages park resources. The ‘parastatal model’ is provided by the government but with financial flexibility. The ‘public and for-profit combination model’ creates a partnership between government and business-making organizations, and in ‘the public and non-profit combination model, the non-profit organization plays an advocacy role and focuses on natural resource conservation. Ecology and aboriginal models are used in rural areas for natural resource management.
Green space infrastructure needs continuous management. Managing the available resources, maintenance, financing, sanitation, and facilitating encourage the community. The multifunctional approach to sustaining ecological, economic, and social requires integrated management. The Ethiopian government has adopted a similar fashion. According to (Yirga Ayele et al., 2022), the familiar green spaces management approaches are (1) fully public, (2) public utility, (3) outsourcing, (4) private-no-profit and (5) private for-profit models.
2.7. Green Infrastructure’s Design Principles
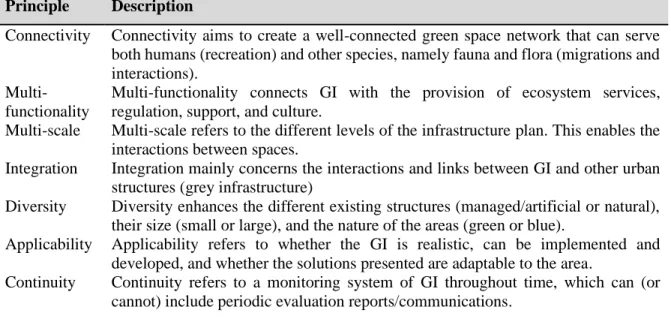
GI has several design principles that cover several aspects, including connectivity, multi- functionality, multi-scale, integration, diversity, applicability, and continuity (see Table 1).
Table 1 Green Infrastructure’s Design Principles Principle Description
Connectivity Connectivity aims to create a well-connected green space network that can serve both humans (recreation) and other species, namely fauna and flora (migrations and interactions).
Multi- functionality
Multi-functionality connects GI with the provision of ecosystem services, regulation, support, and culture.
Multi-scale Multi-scale refers to the different levels of the infrastructure plan. This enables the interactions between spaces.
Integration Integration mainly concerns the interactions and links between GI and other urban structures (grey infrastructure)
Diversity Diversity enhances the different existing structures (managed/artificial or natural), their size (small or large), and the nature of the areas (green or blue).
Applicability Applicability refers to whether the GI is realistic, can be implemented and developed, and whether the solutions presented are adaptable to the area.
Continuity Continuity refers to a monitoring system of GI throughout time, which can (or cannot) include periodic evaluation reports/communications.
Source: Monteiro et al., 2022
3. METHODOLOGY 3.1. Research Design
This research employs a combined quantitative and qualitative approach to obtain its three objectives. The methodology encompasses several key steps:
1. Satellite image analysis: utilizing secondary data, a classification and land cover analysis of the area using Sentinel-2 satellite imagery we conducted. This step allowed for a broad, objective assessment of the current state of GI.
2. Observational study: complementing the satellite data, primary data were gathered through direct observation. This method provided insights into green spaces' physical conditions and usage patterns.
3. Public perception survey: a questionnaire-based survey was conducted to gauge community engagement and needs. This survey aimed to understand the public's perspectives on accessibility and the availability of facilities within the green spaces, such as toilets and play fields.
The goal of this research design was to accurately assess the level and quality of GI in the study area. By integrating insights from Sentinel-2 images with observational data and public feedback, this study aimed to construct a comprehensive understanding of the green spaces, including their utilization and the needs they fulfil for the community. Figure 3 shows the design of the reseach methods.
Figure 1 Methodological Design
3.2. Quality of Green Infrastructure
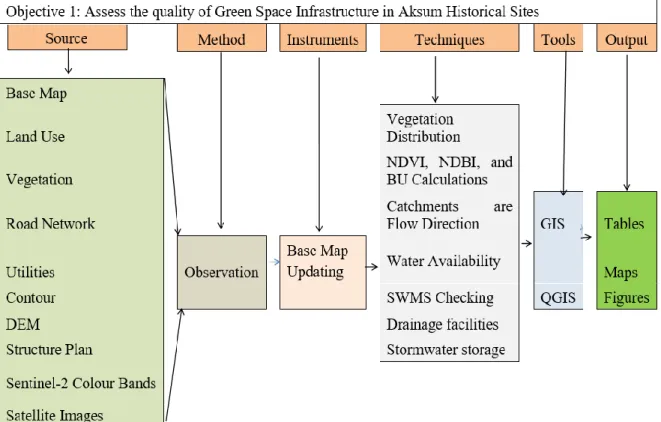
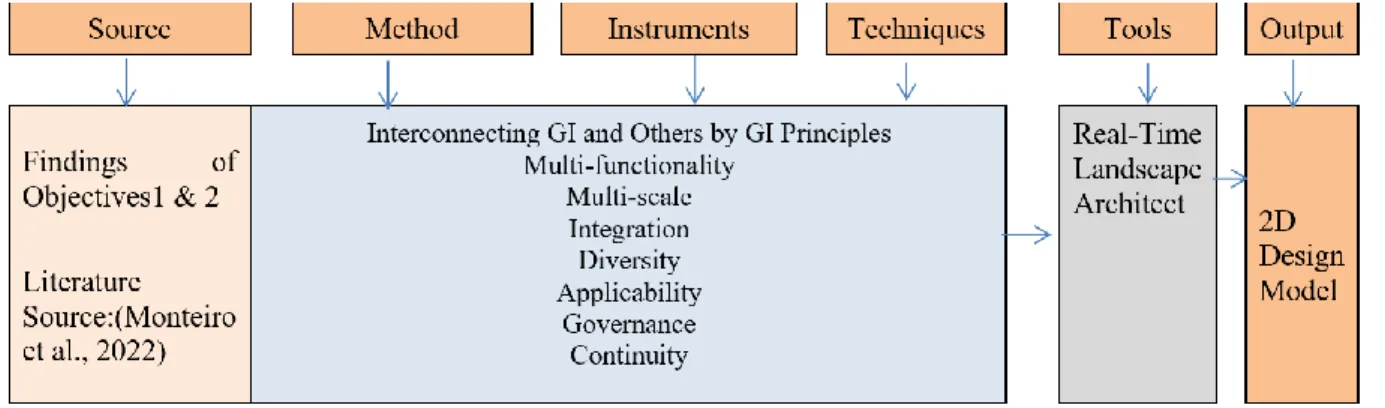
To evaluate the quality of GI in the study area, a dual-method approach outlined in the methodological design were implemented. This approach combines quantitative satellite image analysis with qualitative field observations (see Figure 4).
1. Quantitative Analysis:
a. Satellite Image Analysis, which utilizes Sentinel-2 satellite imagery to analyze the area’s land use patterns. Key indicators used in this analysis were the Normalized Difference Vegetation Index (NDVI) and the Normalized Difference Built-up Index (NDBI). The NDVI is instrumental in assessing the presence and quality of vegetation, while the NDBI is used to evaluate built-up areas.
b. Index Comparison and Interpretation, which compares NDBI and NDVI values to determine the adequacy level of GI. The Built-Up (BU) area is quantified as the difference between NDBI and NDVI values. These calculations used Geographic Information System (GIS) and Quantum Geographic Information System (QGIS) tools.
c. Storm Water Management Systems (SWMS) are analyzed, and their effectiveness are evaluated based on NDVI, NDBI, and BU indices. This analysis helps justify low-impact SWMS's impact on the quality of GI.
2. Qualitative Analysis includes conducting field observations focused on assessing the distribution of vegetation, water availability, catchment areas, and the functionality of various stormwater management systems, such as bio-swales, retention ponds, cisterns, and permeable pavements.
Figure 4 Input Output Diagram for GI Quality Evaluation
The ‘Urban Built-up’ Index helps understand the level of green space infrastructure, calculated using formula (1):
𝐵𝑈 = 𝑁𝐷𝐵𝐼 − 𝑁𝐷𝑉𝐼
The distribution of vegetation, water availability, catchment areas, and stormwater management systems like bio-swale, retention ponds, cisterns, permeable pavements, and further drainage facilities are studied by field observation.
According, Lange et al. (2017). NDVI is calculated from Sentinel 2 images using this formula:
𝑁𝐷𝑉𝐼 =𝑁𝐼𝑅(𝐵8) − 𝑅𝐸𝐷(𝐵4) 𝑁𝐼𝑅(𝑏8) + 𝑅𝐸𝐷(𝐵4)
The NDVI result is measured -1 up to -0.02 = water body, -0.02 up to 0.1 = Rocky area, 0.1 up to 0.5 = Grass and Shrubs, and 0.5 up to +1= dense vegetation.
NDBI is calculated by the formula by color bands indicated in Table 3 (Kuc & Chormański, 2019) above, and it is obtained using this formula:
𝑁𝐷𝐵𝐼 =𝑆𝑊𝐼𝑅 (𝐵11) − 𝑁𝐼𝑅 (𝐵8) 𝑆𝑊𝐼𝑅 (𝐵11) + 𝑁𝐼𝑅 (𝐵8)
NDBI result is measured by the image result in which -1 up to zero (0) = water body and zero (0) up to +1 is Built-up Area.
3.3. User Perceptions in Green Infrastructure 3.3.1. Population and Sample Size
The people’s perceptions of visitors' sample size were determined by given by:
𝑛 =𝑧2𝑝𝑞 𝑑2
where 𝑛 is the desired sample size, 𝑧 is the standard normal deviation usually set at 1.96 (which corresponds to the 95% confidence level), and 𝑝 is the proportion in the target population to have a specific characteristic if no estimate is available set it at 50% (or 0.50), 𝑞 = 1 − 𝑝 and 𝑑: absolute precision or accuracy normally set at 0.05.
𝑛 =(1.96)2(0.5)(0.5) (0.05)2
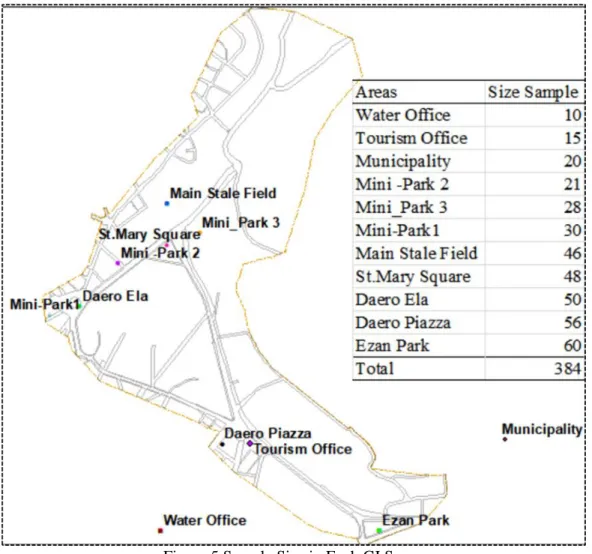
The survey method employed was a typical purposive sampling technique. Under each category, the samples were selected if they can independently read and write to answer questions. The selection of these stakeholders, such as a municipality, tourism office, and water office were based on their requirements. The availability of visitors in the GI spaces enabled us to distribute the size from the lowest to the highest, as is seen in Figure 5.
The survey method employed was a typical purposive sampling technique. Under each category, the samples are selected if they can read and write to answer independently. The selection of these stakeholders, such as a municipality, tourism office, and water office, was based on their requirements.
(1)
(2)
(3)
(4)
hence, 𝑛 = 384 has taken. (5)
Figure 5 Sample Size in Each GI Space
3.3.2. Data Collection Instruments and Methods
After allocating the number of respondents to be asked from each GI space and office, questions of single and multiple responses were prepared to assess the user perceptions regarding GI in the study area. The questions were single response (Q1-Q5), multiple response Q6 (1-10), Q7 (1-6), Q8 (1-6). The multiple response variables were grouped and defined into one variable set in the analysis using the Statistical Package for Social Science (SPSS) software. The input and output for the second objective is shown in Figure 6.
Figure 6 Input Output Diagram for User Perception
The responses to questions in Table 2 were collected and analyzed using the SPSS tool. The multi-response questions are coded for easier work, and the result is cross-tabulated.
Table 2 People Perception Questionnaire
3.4. Integration of Green Infrastructure
Observation and image processing findings have analyzed the connectivity, integration diversity, and multi-functionality of GIs. The assessment data included the total origin and destination sites and necessary links and hubs. The completeness of the network or missing part was analyzed, and the result was drawn in two-dimensional Drawings (2D). The input and output for the third objective is shown in Figure 7.
Figure 7 Input Output Diagram for GI Integration
No Question Code Variable No Question Code Variable
1 Gender 11 7 Types of
Parks to Visit
71 Pocket parks around homes
2 Age 21 72 Children Parks
3 Period of Residence
31 Period of residence in the town
73 Riverside stream park
4 Frequency of Visiting
41 Frequency of visiting Green Space
74 Performance and cultural parks
5 51 Regular Maintenance of
Green Space
8 Methods of participation
75 Sport Park
6
Main Purpose of Visit
61 Relaxation 76 Mountain Parks
64 Relate Nature 81 I am not
particularly eager to change
65 No other Places 82 Joining with the
non-profit organization
66 Attending Community Events 83 Participating in
volunteer workers and clean
environment
67 Spend Time 84 Enforcing
politicians to have a guide for GI
68 Family Recreation 85 Agreement to pay
tax for using the service
69 Social Contact
610 Education For Children
4. RESULT AND DISCUSSION 4.1. Qualities of Green Infrastructure
4.1.1. Calculation Normalized Difference Vegetation Index (NDVI)
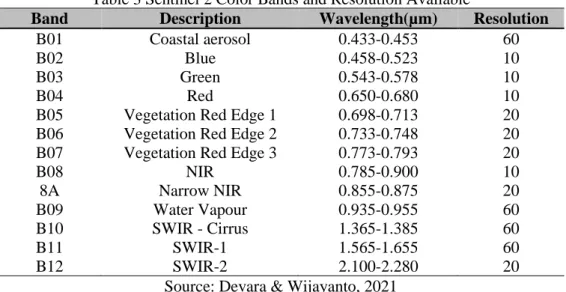
The NDVI is the measure of the vegetation quality. This can measure the health of the vegetation and its distribution in the urban area. The raster calculation in this research was done by downloading Sentinel 2 images from Copernicus data source and NASA. The available color bands calculate the NDVI. The first step is clearing clouds and shadows on the surface of the analysis. Clouds and shadows can affect the NDVI result. Different brand names and imagery sources, such as Land Sat 7, 8, and Sentinel-2 level A, are known. This analysis research has used Sentinel 2 imagery from ‘Copernicus’ data source. Sentinel 2 has 13 bands of different color bands and wavelengths. The description is in Table 3.
Table 3 Sentinel 2 Color Bands and Resolution Available
Band Description Wavelength(µm) Resolution
B01 Coastal aerosol 0.433-0.453 60
B02 Blue 0.458-0.523 10
B03 Green 0.543-0.578 10
B04 Red 0.650-0.680 10
B05 Vegetation Red Edge 1 0.698-0.713 20
B06 Vegetation Red Edge 2 0.733-0.748 20
B07 Vegetation Red Edge 3 0.773-0.793 20
B08 NIR 0.785-0.900 10
8A Narrow NIR 0.855-0.875 20
B09 Water Vapour 0.935-0.955 60
B10 SWIR - Cirrus 1.365-1.385 60
B11 SWIR-1 1.565-1.655 60
B12 SWIR-2 2.100-2.280 20
Source: Devara & Wijayanto, 2021
Knowing the above specification for color bands, water surface and vegetation surface can be synthesized from downloaded imageries of separate bands from one up to 12 bands, as well as false color and true color bands. In Quantum GIS, the downloaded raster data was calculated according to the formula for NDVI. The result is interpreted where the normalized difference is given in data distribution in inclusive (-1, 1). Where -1 is a water body, and +1 is highly and densely vegetated (see Figure 8).
Figure 8 NDVI Result
NDVI is the index showing the probability of finding healthy vegetation, which ranges from -1 up to +1 inclusive. The crude analysis of NDVI from ‘Sentinel 2’ imagery indicates that map 4.34 is grouped into four. -1 up to -0.02 is considered a water body. The group from -0.02 up to +0.1 is considered a rocky area. Grasses and shrubs cover the result from +0.1 up to +0.5. The last healthy vegetation and grown-up trees are indicated by NDVI +0.5 up to +1 (see Table 4).
Table 4 NDVI Result
Range Area (M2) Inference
-1 -0.02 60.26 Water Body
-0.02 0.1 142959.16 Rock
0.1 0.5 500270.58 Grass/Shrubs
0.5 1 1321.94 Dense Vegetation
Total 644611.94
The NDVI result shows a small area (0.132 Ha) of dense vegetation. The grass coverage was 50.02 Ha. The rest is scattered. The result found 14.29 Ha is rocky surface. The Zonal Statistics from GIS also showed that the proportions of different land use classes had different levels of Green Coverage (see Table 5).
Table 5 NDVI versus Land Use
Land Use Area (M2) Min
(NDVI)
Max
(NDVI) Range Mean Std.
Heritage Site 52504.768 0.034 0.534 0.500 0.193 0.110 Forest and Informal green 38672.867 0.021 0.501 0.480 0.170 0.079
Recreation 14678.752 0.003 0.474 0.470 0.172 0.115
Service 109243.792 -0.021 0.543 0.565 0.154 0.080
Manufacturing and Storage 188.189 0.105 0.204 0.100 0.154 0.050 Administration 18066.157 0.032 0.376 0.344 0.136 0.075
Vacant Land 88919.365 0.028 0.605 0.577 0.204 0.087
River 16278.360 0.063 0.505 0.442 0.251 0.090
Residence 103033.550 0.017 0.515 0.499 0.164 0.084
Agriculture 1693.702 0.108 0.243 0.134 0.160 0.042
Mixed Use 18160.251 0.033 0.456 0.423 0.150 0.084
Commerce and Trade 35755.935 0.056 0.565 0.509 0.198 0.083 Road, Transportation, Utilities,
and Infrastructure 106138.671 0.010 0.524 0.515 0.164 0.089
Sum 603334.361
The ‘Zonal Statistics’ regarding land use and respective NDVI index is illustrated in Table 5. The highest index is in vacant land, 0.028-0.605. It means that there is the highest vegetation indicator.
However, the type of vegetation is shrubs and grass. The vegetation is intermittent and is not healthy. They can dry during the dry season. The second highest NDVI is recorded in heritage sites with a range of 0.034-0.534. The third highest NDVI is river stream and river buffer sides, which range from 0.063-0.501.
4.1.2. Calculation for NDBI
Normalized Difference Built-up index (NDBI) shows the areas with high reflectance and shorter wavelength infra-red spectral range (NIR). Quantum GIS calculates the sentinel-2 imagery of the given bands' raster images. The result of the image calculated is shown in Figure 9.
The NDBI is used to identify built surface and water bodies. The sentinel-2 imagery analysis and zonal statistics of different existing land use concerning the NDBI show that the range between - 1 up to zero (0) is water body. The range between zero (0) and +1 is considered a built surface.
The general analysis from map 4.35 indicates most of the area is built-up surface. The stream and its buffer labelled as water surface low range approaches -1. The zonal statistics of NDBI are also calculated. Land cover classes have different levels of built-up (see Table 6).
Figure 9 NDBI Analysis
Table 6 depicts that the NDBI result is lower at land use manufacturing and storage -0.004 up to 0.019 and higher at land use vacant land -0.193 up to 0.253. The NDBI cannot be the representative solution to show a built-up surface.
Table 6 NDBI versus Land Use Analysis Land Use Area (M2) Min
(NDBI)
Max
(NDBI) Range Mean Std Heritage Site 52504.768 -0.136 0.144 0.280 0.036 0.051 Forest and Informal green 38672.867 -0.110 0.239 0.349 0.083 0.068 Recreation 14678.752 -0.145 0.131 0.276 0.027 0.059
Service 109243.792 -0.108 0.203 0.312 0.055 0.045
Manufacturing and Storage 188.189 0.004 0.019 0.015 0.011 0.008 Administration 18066.157 -0.105 0.132 0.236 0.042 0.042 Vacant Land 88919.365 -0.193 0.253 0.445 0.086 0.063
River 16278.360 -0.102 0.144 0.246 0.049 0.046
Residence 103033.550 -0.128 0.240 0.368 0.056 0.047
Agriculture 1693.702 0.036 0.112 0.075 0.074 0.021
Mixed Use 18160.251 -0.128 0.142 0.271 0.054 0.050
Commerce and Trade 35755.935 -0.162 0.223 0.385 0.077 0.078 Road, Transportation,
Utilities, and Infrastructure 106138.671 -0.154 0.248 0.402 0.055 0.049
Sum 603334.361
4.1.3. Calculation BU Index
Having calculated 𝑁𝐷𝑉𝐼 and 𝑁𝐷𝐵𝐼 indexes, the result raster image is also calculated in the raster calculator by 𝐵𝑈 = 𝑁𝐷𝐵𝐼 − 𝑁𝐷𝑉𝐼 (Devara & Wijayanto, 2021), as illustrated in Figure 10.
Figure 10 BU Index
The result of the probability of finding a built surface from the analysis is grouped into -1 up to +1. The below 0 or -1 up to 0 is not built surface, and from 0 up to +1 is built surface. The analysis is, therefore, grouped as indicated in the map in a dark color -0.033-+0.18 is the built surface.
This comparison with the reality of surface cover seems true (see Table 7).
Table 7 BU Index Result
Symbol Range Area (M2) Inference BAR -1 0 557022.49 Not Built
0 1 87766.26 Built-Up 0.13612
Total 644788.75
The total BAR (Built-Up to Total Ratio) indicates 0.136, 13.6 present built. However, the design for the green network is less. The comparative Built Up index with land use indicated by the structure plan is analyzed in different zones. The land use space with the highest built surface is residential area ranging from -0.644-0.128, and road and transport are built surfaces whose index ranges from -0.656- 0.109. In some cases, the forest and formal green indicated by the structure plan are violated and built with an index range of -0.57 up to 0.18. This generally depicts that the built surface and land use built, and non-built regulation is not respected (see Table 8).
Table 8 BU Index versus Land Use Land Use Area (M2) Min
(BU)
Max
(BU) Range Mean Std Heritage Site 52504.768 -0.622 0.085 0.706 -0.156 0.149 Forest and Informal green 38672.867 -0.570 0.180 0.750 -0.087 0.119 Recreation 14678.752 -0.597 0.092 0.689 -0.145 0.166 Service 109243.792 -0.634 0.099 0.733 -0.099 0.112 Manufacturing and Storage 188.189 -0.185 -0.101 0.084 -0.143 0.042 Administration 18066.157 -0.423 0.077 0.499 -0.094 0.107 Vacant Land 88919.365 -0.798 0.079 0.877 -0.118 0.123
River 16278.360 -0.607 0.042 0.649 -0.202 0.124
Residence 103033.550 -0.644 0.128 0.772 -0.107 0.118 Agriculture 1693.702 -0.204 -0.035 0.169 -0.086 0.048 Mixed Use 18160.251 -0.584 0.080 0.664 -0.096 0.125 Commerce and Trade 35755.935 -0.724 0.054 0.778 -0.121 0.136 Road, Transportation, Utilities,
and Infrastructure 106138.671 -0.656 0.109 0.765 -0.109 0.122
Sum 603334.361
4.1.4. Built-up versus Non-Built-Up
The built-up from Sentinel 2 images downloaded at different band resolutions and analysis results do not have built surfaces' accuracy. The roads and footpaths in the public institutions are not included. The built-to-total ratio is 0.14. The built-up to total (BAR) is 0.30. We found the vacant areas and mountain corridors that have indications of GI. There is no clear interconnection among the spaces. The result illustrated in Figure 11 shows the fragmented spaces' sites, hubs, and links, which are not interconnected. The GI result does not show a full network and meaningful web.
The points of attraction (origin-destination) sites and hubs are not interconnected by the linear spaces like riverside buffer green, utilitarian corridors like verges and street side; Storm Water Management (SWM) systems like bio-swale, rain gardens, and permeable pavements are not connected by links with sufficient circulation as footpath and road network. Generally, the link is missed even though the sites have some implications for GI.
Figure 11 Fragmented GI Spaces
4.2. Sensory Perception for Green Infrastructure Development 4.2.1. Gender versus Frequency of Visiting Green Infrastructure
More time can be spent in green spaces if sufficient services are incorporated. The movement characteristic of the people and availability of jobs and recreation in proximities determines this.
The more green spaces were integrated with working areas, homes, and industries, GI's most frequently visited spaces (see Figure 12). The gender relation with frequency illustrates that mostly female visitors occupy the spaces in Aksum recreational parks (Ezana, Daero Ela, and Daero Piazza). This can be done to create business in open recreation. The nature of the observed green spaces is that they are open for all private workers (females) and serve coffee, tea, and other soft drinks for visitors.
Figure 122 Frequency of Visiting GI
4.2.2. Gender versus Period of Residence and Maintenance GI
Many responses showed that no maintenance has been made to GI. The single-response questionnaire had 384 respondents. Therefore, the summation in each category is divided by 384 and multiplied by 100 to get a percentage. For example, the age groups over ten years have 198 out of 384, and the percentage is 51.6% (highest). The GI spaces are characterized by less maintenance. The respondents with more than ten years of residence have admitted that they have an almost similar understanding of the maintenance of GI. However, green space infrastructures need regular maintenance by the government, non-governmental organizations, or contractors.
4.2.3. Methods of Participation Development of GI
Table 9 Participation in GI Maintenance
Variables Responses Percent
of Cases N Percent
I do not want to Participate 73 5.4% 19.0%
Joining with Non-profit Organizations 158 11.7% 41.1%
Agreement with Paying More Tax on Usage Services 225 16.7% 58.6%
Participating by Ideas/Knowledge 250 18.6% 65.1%
Volunteer Work in the Cleaning Environment 297 22.0% 77.3%
Donation of Business and Labour Participation 344 25.5% 89.6%
1347 100.0% 350.8%
The respondents participated in GI maintenance by labor in cleaning roads and environmental sanitation (77.3%). Participating in business or labor covers 89.6 %. Ideas and knowledge sharing also cover d 65.1%. Generally, 1347 multi-response cases have been collected, and the participation method has been ordered in ascending order in the table above. The people participate during the initiation to work and clean the environment, as Table 9 illustrates.
According to the result, people have participated in keeping, watering, cleaning, and knowledge sharing.
4.2.4. Gender versus Main Purpose of Visiting GI
Different motives for GI visiting have been set. The multi-response variables are summarized in the graph. The chart showed that meeting with friends had the highest share, 315 out of 1664.
The percentile was 20.5%. The next was for ‘Relaxation’, which accounts for 18.93%. The chart, therefore, illustrated the frequencies of answers. One can sum up the gender count in each response, divide it by 1664, and multiply it by 100 to find the percentage. Generally, this is good descriptive that by the multi-response question, in this case, people of different age groups, genders, and income levels visited green spaces for different cases (see Figure 13).
Figure 13 Gender versus Main Purpose of Visiting GI
4.2.5. Gender versus Types of Parks Visited
Figure 14 showed that pocket parks have the highest share of visitors. 256 out of 787 cases confirmed this. The next highest was found in sports parks, accounting for 51.2%. Sports performance and cultural parks were the next highest (in the case of Daero Ela and Daero Piazza).
Figure 14 Types of Parks Visited
4.3. Integrating Green Infrastructure Spaces
The GI development has been applied inside the neighborhood river/stream corridors, street channels, roundabouts, median and overpass bridges, vacant spaces, existing parks, historically preserved areas, civic squares, and street leftover spaces. The spaces have to be connected by green. Users will have different options for using spaces in the outdoor environment, and pedestrians, tourists, local visitors, and residents in general will be comfortable if the green network concept is applied. The green concept integrated all the spaces of public and private frontages. The GI spaces are integrated using links like river corridors, linear landscapes, street- side greens, and road verges. The missed design is elaborated on in Figure 15.
Figure 35 Elements of GI, Linkage, and Hubs
4.4. Anatomy of Design Plan/Recommendation
The investigated green space has developed by different interventions. The intervention for all spaces has the following model designs to solve the fragmentation and to bring a sustainable
integrated system of GI. Green space infrastructure is developed by improving its size, shape, and accessibility. It has included environmental, economic, and social sources in sustainable and integrated development. The vacant spaces, street corridors, existing parks, historical areas, and river buffers should be interlinked and bring a complete network. The next development should have the direction of development for GI (see Figure 16).
Figure 16 GI Concept Developments
5. CONCLUSION
This study's comprehensive analysis of GI quality, using high-resolution 'Copernicus Sentinel-2' imagery and public perception surveys, has yielded several critical insights:
1. Satellite Image Analysis Results: The Normalized Difference Vegetation Index (NDVI) results (ranging from 0.1 to 0.5) indicated a predominance of grass or shrubs across 50.02 hectares, signifying a lack of healthy, dense vegetation and large canopy trees in the study
area. The Normalized Difference Built-up Index (NDBI) ranged from -0.193 to 0.253, with values from -1 to 0 indicating water bodies and 0 to +1 indicating built-up areas. The Built-Up (BU) index results further delineated non-built areas (-1 to 0) from built surfaces (0 to +1). The Built Area Ratio (BAR) was calculated as 13.6%, suggesting limited construction but a lack of integrated network development.
2. Stormwater Management Analysis: Examining stormwater systems revealed traditional permeability patterns in the catchment area. Water flowed from higher to lower elevations, with soil erosion from the eastern rocky surfaces and deposition along river/stream banks. The steep, rocky terrain inhibited groundwater infiltration, impacting the overall stormwater management.
3. User Perceptions of GI: Survey results indicated that users frequently visited GI spaces 3-5 times per week, primarily for socializing (20.5%) and relaxation (18.9%). Preferred GI spaces were those near homes, such as mini-parks and cultural markets (e.g., Daero Piazza and Ezana Park). However, regular maintenance of these spaces was reportedly lacking. Participants expressed a willingness to contribute to GI maintenance through personal labor (25.5%) or by keeping their surroundings clean (22%), conditional upon adequate facilitation by government officials.
The overall quality of GI assessed through area proximity, connectivity, economic integrity, social attractiveness, and ecological preservation was suboptimal. Critical elements such as sites, hubs, and links within the green infrastructure network were not effectively interconnected.
Additionally, integrating other infrastructures like circulation systems, roads, water lines, power lines, and pedestrian paths was insufficient.
6. ACKNOWLEGEMENT
The author acknowledges Ambuj Manohar (Ass. professor) for his reviewing and editing the research from the proposal up to the final report. Further, the author acknowledges Aksum municipality members' and participants' perceptions of GI design. Finally, the author acknowledges Arbaminch University for its funding for data collection in this research.
REFERENCES
Alfasi, N., & Fabian, R. (2009). Preserving Urban Heritage: From Old Jaffa to Modern Tel-Aviv. Israel Studies, 14(3), 137–156. https://doi.org/10.2979/ISR.2009.14.3.137
Allen, W., Benedict, M., & O’Connor, K. (2012). Green Infrastructure Plan Evaluation Frameworks.
Andrews, S., Claridge, J., Foster, C., Hutchings, T., Brunt, A., Shah, N., Broadmeadow, S., Lawrence, V., Bryant, R., Stewart, A., Lawrence, A., Molteno, S., Sarajevs, V., Valatin, G., Doick, K., Atkinson, G., & Eycott, A. (n.d.). Benefits of green infrastructure.
Assaye, R., Suryabhagavan, K. V., Balakrishnan, M., & Hameed, S. (2017). Geo-Spatial Approach for Urban Green Space and Environmental Quality Assessment: A Case Study in Addis Ababa City.
Journal of Geographic Information System, 09(02), 191–206.
https://doi.org/10.4236/jgis.2017.92012
Berghöfer, A., Zyl, H. V., Förster, J., Rode, J., Mitlacher, G., & Schröter-Schlaack, C. (2020). Natural Capital in international environmental cooperation: Concepts and application.
https://doi.org/10.13140/RG.2.2.29668.60801
Beyer, K., Kaltenbach, A., Szabo, A., Bogar, S., Nieto, F., & Malecki, K. (2014). Exposure to Neighborhood Green Space and Mental Health: Evidence from the Survey of the Health of Wisconsin. International Journal of Environmental Research and Public Health, 11(3), 3453–
3472. https://doi.org/10.3390/ijerph110303453
Bowman, M., CABE Space (Organisation), & Greater London Authority. (2009). Open space strategies:
Best practice guidance. Commission for Architecture and the Built Environment.
Bryant, S. (n.d.). The Green Infrastructure Strategy: Towards an Interconnected Green Network.
Camargo, R. R. (2016). The effects of Urban Green Spaces on house prices.
https://doi.org/10.13140/RG.2.2.32791.19365
Chen, Y., Liu, T., Xie, X., & Marušić, B. G. (2016). What Attracts People to Visit Community Open Spaces? A Case Study of the Overseas Chinese Town Community in Shenzhen, China. Int. J.
Environ. Res. Public Health, 17.
Coombes, M., & Viles, H. (2021). Challenges, opportunities, and prospects for linking green infrastructure and the conservation of urban built heritage [Other]. Pico. https://doi.org/10.5194/egusphere- egu21-3022
Crompton, J. L. (2007). The Role aof the Proximate Principle in the Emergence of Urban Parks in the United Kingdom and in the United States. Leisure Studies, 26(2), 213–234.
https://doi.org/10.1080/02614360500521457
Devara, T., & Wijayanto, A. W. (2021). MACHINE LEARNING APPLIED TO SENTINEL-2 AND LANDSAT-8 MULTISPECTRAL AND MEDIUM-RESOLUTION SATELLITE IMAGERY FOR THE DETECTION OF RICE PRODUCTION AREAS IN NGANJUK, EAST JAVA, INDONESIA. International Journal of Remote Sensing and Earth Sciences (IJReSES), 18(1), 19.
https://doi.org/10.30536/j.ijreses.2021.v18.a3538
Di Turo, F., & Medeghini, L. (2021). How Green Possibilities Can Help in a Future Sustainable Conservation of Cultural Heritage in Europe. Sustainability, 13(7), Article 7.
https://doi.org/10.3390/su13073609
Eagles, P., Havitz, M., McCutcheon, B., Buteau-Duitschaever, W., & Glover, T. (2010). The Perceived Implications of an Outsourcing Model on Governance within British Columbia Provincial Parks in Canada: A Quantitative Study. Environmental Management, 45(6), 1244–1256.
https://doi.org/10.1007/s00267-010-9477-3
Firmansyah, Soeriaatmadja, A., & Wulanningsih, R. (2018). A set of sustainable urban landscape indicators and parameters to evaluate urban green open space in Bandung City. IOP Conference Series: Earth and Environmental Science, 179, 012016. https://doi.org/10.1088/1755- 1315/179/1/012016
Furholt, M., Grier, C., Spriggs, M., & Earle, T. (2020). Political Economy in the Archaeology of Emergent Complexity: A Synresearch of Bottom-Up and Top-Down Approaches. Journal of Archaeological Method and Theory, 27(2), 157–191. https://doi.org/10.1007/s10816-019-09422- 0
Gelan, E., & Girma, Y. (2021). Sustainable Urban Green Infrastructure Development and Management System in Rapidly Urbanized Cities of Ethiopia. Technologies, 9, 66.
https://doi.org/10.3390/technologies9030066
Ghofrani, Z., Sposito, V., & Faggian, R. (2017). A Comprehensive Review of Blue-Green Infrastructure Concepts. International Journal of Environment, 6, 15-36.
Hernández-Bonilla, M. (2008). Contested Public Space Development: The Case of Low-Income Neighbourhoods in Xalapa, Mexico. Landscape Research, 33(4), 389–406.
https://doi.org/10.1080/01426390802191162
Houlden, V., Weich, S., & Jarvis, S. (2017). A cross-sectional analysis of green space prevalence and mental well-being in England. BMC Public Health, 17(1), 460. https://doi.org/10.1186/s12889- 017-4401-x
Kuc, G., & Chormański, J. (2019). SENTINEL-2 IMAGERY FOR MAPPING AND MONITORING IMPERVIOUSNESS IN URBAN AREAS. The International Archives of the Photogrammetry, Remote Sensing and Spatial Information Sciences, XLII-1-W2, 43–47.
https://doi.org/10.5194/isprs-archives-XLII-1-W2-43-2019
Lange, M., Dechant, B., Rebmann, C., Vohland, M., Cuntz, M., & Doktor, D. (2017). Validating MODIS and Sentinel-2 NDVI Products at a Temperate Deciduous Forest Site Using Two Independent Ground-Based Sensors. Sensors, 17(8), Article 8. https://doi.org/10.3390/s17081855
Lee, Y.-C., & Kim, K.-H. (2015). Attitudes of Citizens towards Urban Parks and Green Spaces for Urban Sustainability: The Case of Gyeongsan City, Republic of Korea. Sustainability, 7(7), 8240–8254.
https://doi.org/10.3390/su7078240